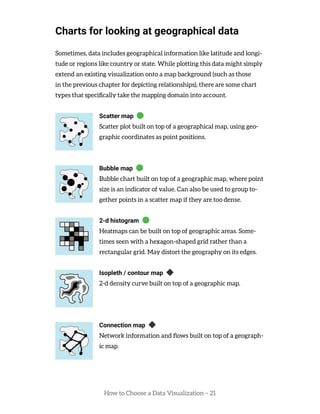
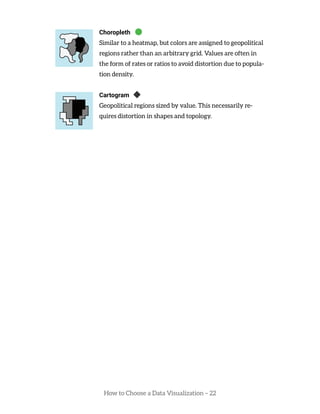
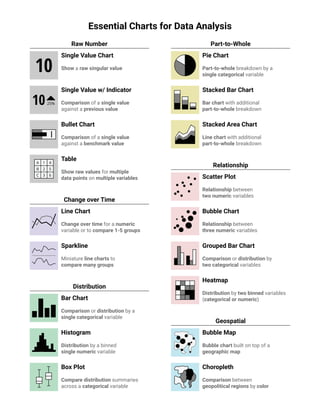
This document provides guidelines on choosing the appropriate data visualization based on the role it should serve and the types of data being used. It categorizes various chart types and their applications, including how to represent changes over time, part-to-whole relationships, and comparisons between groups. The author emphasizes the importance of clarity and simplicity, suggesting the use of multiple visualizations for complex data representation.