We are learningto
understand the purpose and benefits of data visualisation
create clear and accurate data visualisations
choose the correct chart type for various data relationships.
We can
explain why data visualisation is essential for uncovering trends and communicating insights
design visualisations to ensure clarity that focus on key data
implement appropriate chart types to communicate data relationships
critically assess visualisations for clarity, accuracy and potential bias.
5.
Data Visualization
Theart and science of transforming raw data into visual formats
like charts, graphs, and maps. It makes complex data accessible
and understandable.
Data Interpretation
The analytical process of examining these visuals to extract
meaningful insights, patterns, and trends. It turns understanding
into actionable intelligence.
6.
Why visualise data?
Datais only as good as our ability to understand and communicate it
Data visualisation helps:
uncover trends and patterns
visualisations help spot trends and patterns in data that might be missed in
spreadsheets or raw numbers.
make data accessible
charts and graphs translate complex data sets into a format that's easier to
understand for a wider audience.
Cont,
7.
Communicate insights clearly
Visualscan present findings in a compelling way, making it easier
to share data stories and recommendations.
Spark action and decision making
By highlighting key trends, visualisations can guide better
decision-making based on clear data insights.
Make data memorable
Information presented visually is more likely to be remembered
and recalled.
8.
General design tips
Makesure you do the following
Ensure focus on the data and tone-down or remove the
non-data elements such as grid lines, axis lines, chart
borders and colour that does not have a purpose.
Label it up and always include clear and concise legends
and data labels to provide context and ensure viewers
understand what they're looking at.
Cont,
9.
Make sure youdo the following
Take a step back and squint at your visualisation.
If the overall message is still clear without reading any
labels, you're on the right track.
Get feedback.
Don't be afraid to ask for fresh eyes! Sharing your
visualisation with others that can help you identify areas for
improvement and ensure your message is clear.
General design tips
10.
Make sure youdo the following
Avoid clutter by adding too much information to a single
chart as this eliminates the advantages of processing data
visually
.
Avoid 3D visualisations as they can be visually distracting
and make it difficult to compare data points accurately.
Stick to simpler 2D charts for better clarity.
General design tips
11.
Make sure youdo the following
Use ‘bad’ colour combinations. Always try and avoid harsh colour
combinations such as red/green or blue/yellow.
Don't make users perform visual or mental calculations to interpret
your visualisation.
If the chart is complex, break it down into separate visuals and
reduce the viewer's cognitive load.
General design tips
12.
PRINCIPLES OF EFFECTIVEDATA
VISUALIZATION
GUIDELINES TO ENSURE YOUR
VISUALS ARE CLEAR,
ACCURATE, AND IMPACTFUL.
13.
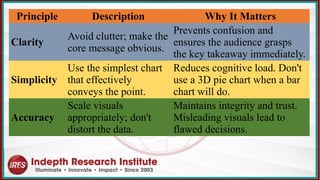
Principle Description WhyIt Matters
Clarity
Avoid clutter; make the
core message obvious.
Prevents confusion and
ensures the audience grasps
the key takeaway immediately.
Simplicity
Use the simplest chart
that effectively
conveys the point.
Reduces cognitive load. Don't
use a 3D pie chart when a bar
chart will do.
Accuracy
Scale visuals
appropriately; don't
distort the data.
Maintains integrity and trust.
Misleading visuals lead to
flawed decisions.
14.
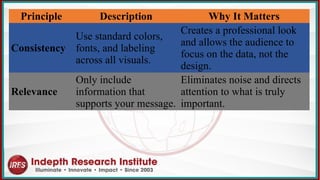
Principle Description WhyIt Matters
Consistency
Use standard colors,
fonts, and labeling
across all visuals.
Creates a professional look
and allows the audience to
focus on the data, not the
design.
Relevance
Only include
information that
supports your message.
Eliminates noise and directs
attention to what is truly
important.
A data chartis a graphical or
visual representation of data. It
translates complex numerical
information and relationships into
a visual format, making patterns,
trends, and outliers easier to see
and understand.
In simple terms: It’s a picture of
your data.
Why Use Charts?
From Data to Insight Charts serve four
primary purposes:
Simplify: Break down complex
datasets into digestible visuals.
Compare: Show differences and
similarities between values.
Reveal Trends: Illustrate how data
changes over time.
Show Relationships: Demonstrate
how variables interact with each
other.
Goal:
To facilitate faster and more accurate
decision-making.
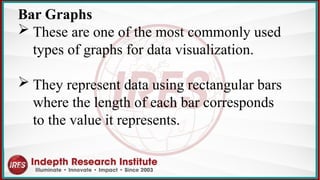
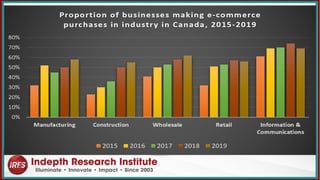
Bar Graphs
Theseare one of the most commonly used
types of graphs for data visualization.
They represent data using rectangular bars
where the length of each bar corresponds
to the value it represents.
20.
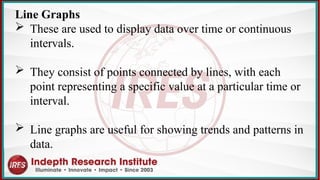
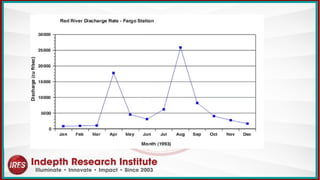
Line Graphs
Theseare used to display data over time or continuous
intervals.
They consist of points connected by lines, with each
point representing a specific value at a particular time or
interval.
Line graphs are useful for showing trends and patterns in
data.
22.
Different Types OfCharts For Data Visualization
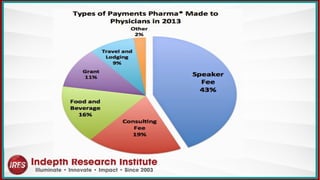
Pie Charts
These are circular graphs divided into sectors, where
each sector represents a proportion of the whole.
Pie charts are effective for showing the composition of a
whole and comparing different categories as parts of a
whole.
24.
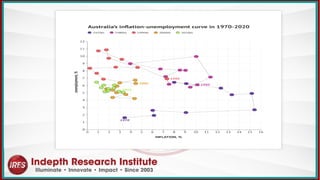
Scatter Plots
Theseare used to visualize the relationship between two
variables.
Each data point in a scatter plot represents a value for both
variables, and the position of the point on the graph
indicates the values of the variables.
Scatter plots are useful for identifying patterns and
relationships between variables, such as correlation or
trends.
26.
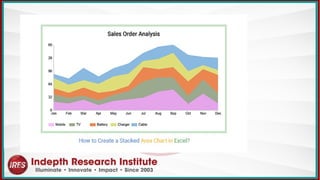
Area Charts
Theyare used to represent cumulative totals or stacked
data over time.
Area charts are effective for showing changes in
composition over time and comparing the contributions
of different categories to the total.
28.
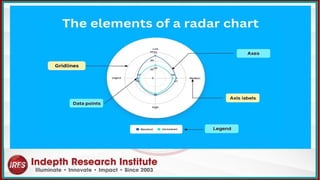
Radar Charts
Alsoknown as a spider chart or a web chart, is a
graphical method of displaying multivariate data in the
form of a two-dimensional chart.
It is particularly useful for visualizing the relative
values of multiple quantitative variables across several
categories.
30.
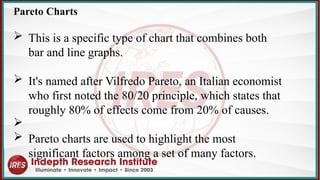
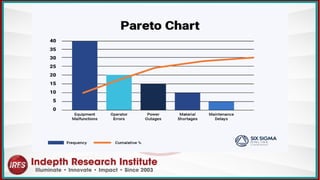
Pareto Charts
Thisis a specific type of chart that combines both
bar and line graphs.
It's named after Vilfredo Pareto, an Italian economist
who first noted the 80/20 principle, which states that
roughly 80% of effects come from 20% of causes.
Pareto charts are used to highlight the most
significant factors among a set of many factors.
32.
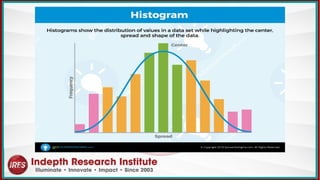
Histograms
These aresimilar to bar graphs but are used specifically
to represent the distribution of continuous data.
In histograms, the data is divided into intervals, or bins,
and the height of each bar represents the frequency or
count of data points within that interval.
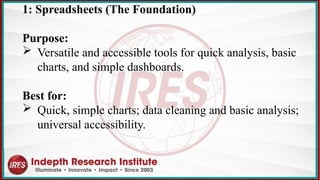
1: Spreadsheets (TheFoundation)
Purpose:
Versatile and accessible tools for quick analysis, basic
charts, and simple dashboards.
Best for:
Quick, simple charts; data cleaning and basic analysis;
universal accessibility.
36.
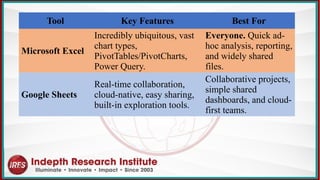
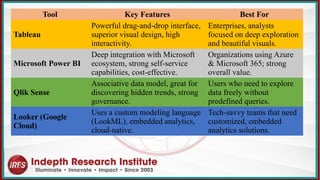
Tool Key FeaturesBest For
Microsoft Excel
Incredibly ubiquitous, vast
chart types,
PivotTables/PivotCharts,
Power Query.
Everyone. Quick ad-
hoc analysis, reporting,
and widely shared
files.
Google Sheets
Real-time collaboration,
cloud-native, easy sharing,
built-in exploration tools.
Collaborative projects,
simple shared
dashboards, and cloud-
first teams.
37.
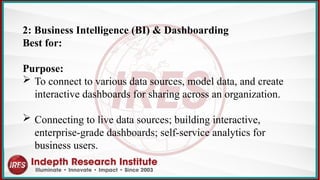
2: Business Intelligence(BI) & Dashboarding
Best for:
Purpose:
To connect to various data sources, model data, and create
interactive dashboards for sharing across an organization.
Connecting to live data sources; building interactive,
enterprise-grade dashboards; self-service analytics for
business users.
38.
Tool Key FeaturesBest For
Tableau
Powerful drag-and-drop interface,
superior visual design, high
interactivity.
Enterprises, analysts
focused on deep exploration
and beautiful visuals.
Microsoft Power BI
Deep integration with Microsoft
ecosystem, strong self-service
capabilities, cost-effective.
Organizations using Azure
& Microsoft 365; strong
overall value.
Qlik Sense
Associative data model, great for
discovering hidden trends, strong
governance.
Users who need to explore
data freely without
predefined queries.
Looker (Google
Cloud)
Uses a custom modeling language
(LookML), embedded analytics,
cloud-native.
Tech-savvy teams that need
customized, embedded
analytics solutions.
39.
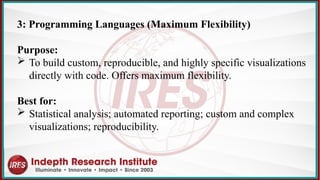
3: Programming Languages(Maximum Flexibility)
Purpose:
To build custom, reproducible, and highly specific visualizations
directly with code. Offers maximum flexibility.
Best for:
Statistical analysis; automated reporting; custom and complex
visualizations; reproducibility.
40.
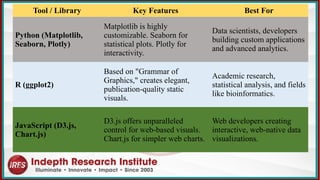
Tool / LibraryKey Features Best For
Python (Matplotlib,
Seaborn, Plotly)
Matplotlib is highly
customizable. Seaborn for
statistical plots. Plotly for
interactivity.
Data scientists, developers
building custom applications
and advanced analytics.
R (ggplot2)
Based on "Grammar of
Graphics," creates elegant,
publication-quality static
visuals.
Academic research,
statistical analysis, and fields
like bioinformatics.
JavaScript (D3.js,
Chart.js)
D3.js offers unparalleled
control for web-based visuals.
Chart.js for simpler web charts.
Web developers creating
interactive, web-native data
visualizations.
41.
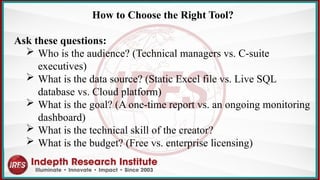
How to Choosethe Right Tool?
Ask these questions:
Who is the audience? (Technical managers vs. C-suite
executives)
What is the data source? (Static Excel file vs. Live SQL
database vs. Cloud platform)
What is the goal? (A one-time report vs. an ongoing monitoring
dashboard)
What is the technical skill of the creator?
What is the budget? (Free vs. enterprise licensing)
The "Story" inthe Data
Raw data is a collection of facts.
Trends and patterns are the meaningful stories we extract
from that data.
They describe relationships, changes, and structures that
allow us to understand the past and anticipate the future.
44.
In essence, theyanswer three key questions:
What is happening? (Description)
Why is it happening? (Analysis)
What is likely to happen next? (Prediction)
45.
What is aTrend?
A trend indicates a consistent, long-term upward or
downward movement in data over a significant period.
It shows the overall direction or tendency.
Key Characteristics:
Direction: Upward (Increasing), Downward (Decreasing),
or Horizontal (Stagnant).
Duration: Long-term (e.g., years, quarters).
Significance: Represents a fundamental shift, not just
short-term noise.
46.
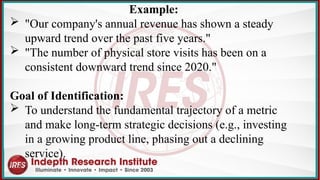
Example:
"Our company'sannual revenue has shown a steady
upward trend over the past five years."
"The number of physical store visits has been on a
consistent downward trend since 2020."
Goal of Identification:
To understand the fundamental trajectory of a metric
and make long-term strategic decisions (e.g., investing
in a growing product line, phasing out a declining
service).
47.
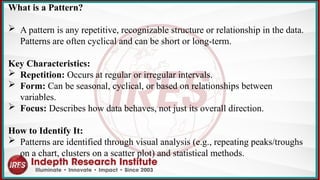
What is aPattern?
A pattern is any repetitive, recognizable structure or relationship in the data.
Patterns are often cyclical and can be short or long-term.
Key Characteristics:
Repetition: Occurs at regular or irregular intervals.
Form: Can be seasonal, cyclical, or based on relationships between
variables.
Focus: Describes how data behaves, not just its overall direction.
How to Identify It:
Patterns are identified through visual analysis (e.g., repeating peaks/troughs
on a chart, clusters on a scatter plot) and statistical methods.
48.
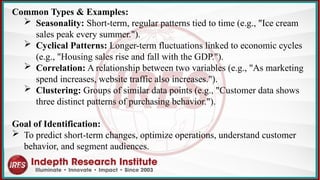
Common Types &Examples:
Seasonality: Short-term, regular patterns tied to time (e.g., "Ice cream
sales peak every summer.").
Cyclical Patterns: Longer-term fluctuations linked to economic cycles
(e.g., "Housing sales rise and fall with the GDP.").
Correlation: A relationship between two variables (e.g., "As marketing
spend increases, website traffic also increases.").
Clustering: Groups of similar data points (e.g., "Customer data shows
three distinct patterns of purchasing behavior.").
Goal of Identification:
To predict short-term changes, optimize operations, understand customer
behavior, and segment audiences.
49.
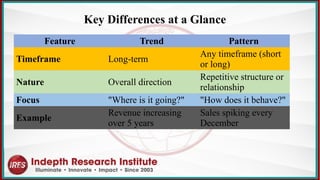
Feature Trend Pattern
TimeframeLong-term
Any timeframe (short
or long)
Nature Overall direction
Repetitive structure or
relationship
Focus "Where is it going?" "How does it behave?"
Example
Revenue increasing
over 5 years
Sales spiking every
December
Key Differences at a Glance
Visual storytellingis the practice of combining data visuals
with a narrative
to present insights in a clear, engaging, and persuasive way.
Goal:
Not just to show data, but to explain what it means,
why it matters, and what actions to take.
52.
What is Data-DrivenStorytelling?
It's the art of weaving data, visuals, and narrative into a compelling
story that inspires action.
It moves beyond simply showing data to explaining what it means and
why it matters.
Without Storytelling:
"Here's a dashboard of last quarter's sales."
(Audience Thinks): "So what? What am I supposed to do with this?"
With Storytelling:
"Last quarter, we gained significant market share in the Midwest.
Our story today is about how a localized marketing strategy drove that
success and how we can apply it nationally to hit our annual target."
(Audience Thinks): "I see! Tell me more."
53.
The Anatomy ofa Data Story
Every effective data story has three core components:
1. Data (The Evidence)
The raw material.
This is your cleaned, analyzed data and the visualizations you build from it
(charts, graphs, maps).
2. Visuals (The Stage)
The presentation of the evidence.
This is the thoughtful design of those visuals using principles of clarity,
simplicity, and emphasis to guide the audience's eye.
54.
3. Narrative (TheScript)
The structure and language that frame the evidence.
It provides context, explains conflict, and builds toward a
resolution.
It answers:
What is happening? (The initial situation)
Why does it matter? (The conflict or opportunity)
What should we do about it? (The resolution & call to
action)
55.
The Storytelling Framework:A Practical Guide
Follow this structure to build your narrative:
1. Hook (The Beginning):
Start with a relatable question, a surprising fact, or the core insight to grab
attention.
Example:
"Did you know we're leaving $5M in revenue on the table?“
2. Conflict/Quest (The Middle):
Present the problem, opportunity, or key finding.
Use data visuals as evidence to build your case.
Example:
"While our overall sales are flat, this chart reveals a hidden gem: a 300% growth in
a specific customer segment we've been ignoring."
56.
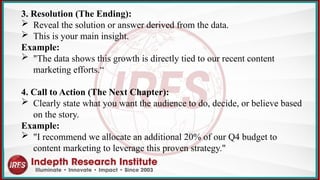
3. Resolution (TheEnding):
Reveal the solution or answer derived from the data.
This is your main insight.
Example:
"The data shows this growth is directly tied to our recent content
marketing efforts.“
4. Call to Action (The Next Chapter):
Clearly state what you want the audience to do, decide, or believe based
on the story.
Example:
"I recommend we allocate an additional 20% of our Q4 budget to
content marketing to leverage this proven strategy."
Enhancing Commercial Decision-Makingwith a Real-Time
Sales Performance Dashboard
Company:
Safaricom PLC
Industry:
Telecommunications, Mobile Money (M-PESA)
Challenge:
Managing and analyzing sales data across vast retail
channels to drive growth and agent network effectiveness.
59.
Executive Summary
The Challenge:
Safaricom's extensive sales operations—spanning direct sales,
dealer networks, M-PESA agents, and retail outlets—generated
massive, siloed data.
Regional managers lacked timely insights, leading to delayed
decisions on agent support, stock allocation, and promotional
campaigns.
Performance reporting was a manual, weekly process,
hindering proactive management.
60.
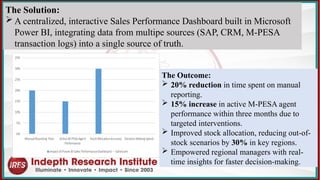
The Outcome:
20%reduction in time spent on manual
reporting.
15% increase in active M-PESA agent
performance within three months due to
targeted interventions.
Improved stock allocation, reducing out-of-
stock scenarios by 30% in key regions.
Empowered regional managers with real-
time insights for faster decision-making.
The Solution:
A centralized, interactive Sales Performance Dashboard built in Microsoft
Power BI, integrating data from multipe sources (SAP, CRM, M-PESA
transaction logs) into a single source of truth.
61.
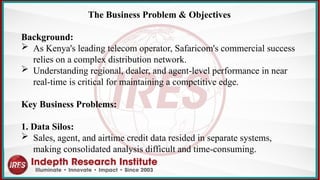
The Business Problem& Objectives
Background:
As Kenya's leading telecom operator, Safaricom's commercial success
relies on a complex distribution network.
Understanding regional, dealer, and agent-level performance in near
real-time is critical for maintaining a competitive edge.
Key Business Problems:
1. Data Silos:
Sales, agent, and airtime credit data resided in separate systems,
making consolidated analysis difficult and time-consuming.
62.
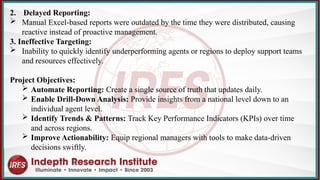
2. Delayed Reporting:
Manual Excel-based reports were outdated by the time they were distributed, causing
reactive instead of proactive management.
3. Ineffective Targeting:
Inability to quickly identify underperforming agents or regions to deploy support teams
and resources effectively.
Project Objectives:
Automate Reporting: Create a single source of truth that updates daily.
Enable Drill-Down Analysis: Provide insights from a national level down to an
individual agent level.
Identify Trends & Patterns: Track Key Performance Indicators (KPIs) over time
and across regions.
Improve Actionability: Equip regional managers with tools to make data-driven
decisions swiftly.
63.
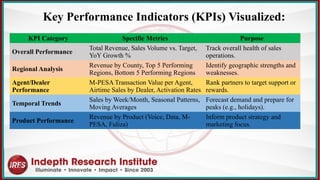
KPI Category SpecificMetrics Purpose
Overall Performance
Total Revenue, Sales Volume vs. Target,
YoY Growth %
Track overall health of sales
operations.
Regional Analysis
Revenue by County, Top 5 Performing
Regions, Bottom 5 Performing Regions
Identify geographic strengths and
weaknesses.
Agent/Dealer
Performance
M-PESA Transaction Value per Agent,
Airtime Sales by Dealer, Activation Rates
Rank partners to target support or
rewards.
Temporal Trends
Sales by Week/Month, Seasonal Patterns,
Moving Averages
Forecast demand and prepare for
peaks (e.g., holidays).
Product Performance
Revenue by Product (Voice, Data, M-
PESA, Fuliza)
Inform product strategy and
marketing focus.
Key Performance Indicators (KPIs) Visualized:


![Hacking-Uncovered-How-People-Get-Hacked-and-How-to-Stay-Safe[1].pptx](https://cdn.slidesharecdn.com/ss_thumbnails/hacking-uncovered-how-people-get-hacked-and-how-to-stay-safe1-260130170011-4883a9c7-thumbnail.jpg?width=640&height=640&fit=bounds)


