3D computer graphics employ the same principles as 2D vector artwork but with an additional axis. The basic objects used in 3D mesh modeling are vertices (points in 3D space) and edges (lines connecting two vertices). Polygons like triangles and quads are formed from edges and vertices and are the most common shapes used in polygonal modeling. A group of connected polygons sharing vertices is referred to as a mesh or wireframe model.
Benefits Of Innovative 3d Graph Techniques In Construction IndustryA Makwana
The construction industry is the second largest industry of the country after agriculture. It makes a significant contribution to the national economy and provides employment to a large number of people. In its path of advancement, the industry has to overcome a number of challenges. One of the challenges is effective utilization of available technology. 3D Graph is one such technique that is rarely being used. Graphs and plots are a natural way to visualize data. It hardly needs saying that their use is common even in non-technical documents. Unfortunately, much work is often required (and rarely performed) to produce plots with sufficient output quality to match a well-typeset document. Recent years have witnessed a rapid development in the technologies that are related to digital visualization and simulation together with the technologies that try to link between digital and physical modelling. Many engineering and design practitioners have begun to apply selective technologies in their practices. The research attempts to classify the possible technologies that can be used throughout stages of urban design projects according to their purpose.
Here in this presentation we will be getting to know about Implicit Interpolation Analytical Curves related to Manufacturing and Designing, Design criteria, we'll be going through interpolating Curves and Equations, interpolating Matrices and Blending Functions
Types of Lines, Their Thickness
and applications in architectural drawings.
- Ar. Shreya Kataria, Asst. Prof., School Of Architecture IPS Academy, Indore
Triangulation is considered to be an important and most adopted method of surveying the desired area. Depending on the nature of topography there are various types of triangulation figures which are discussed here.
Graph Cluster Theory,Generation models for clustered graphs,Desirable cluster properties,Representations of clusters for different classes of graphs,Bipartite graphs,Directed graphs,Graphs, structure, and optimization,Graph partitioning and clustering,Graph partitioning applications,Clustering as a pre processing step in graph partitioning,Clustering in weighted complete versus simple graphs,Vector clustering and graph clustering,Applications in graph clustering,Graph clustering and graph partitioning
Frost & Sullivan identifies the NS-Business Card offering to be amongst the key Mobility Integrators present in the market today. It is an exquisite example of how an transport operator has positioned themselves as an Mobility Integrator. And it is also considered as one of the benchmarks in the industry today.
Powered by humanis.nl
11. Define a simple deformable model to detect a half-circular shape.pdffeetshoemart
11. Define a simple deformable model to detect a half-circular shape (may be rotated). What will
be the energy function?
Solution
shape is a recurring theme in computer vision. For example, shape is one of the main sources of
information that can be used for object recognition. In medical image analysis, geometrical
models of anatomical structures play an important role in automatic tissue segmentation. The
shape of an organ can also be used to diagnose diseases. In a completely different setting, shape
plays an important role in the perception of optical illusions (we tend to see particular shapes)
and this can be used to explain how our visual system interprets the ambiguous and incomplete
information available in an image. Our main goal is to develop techniques that can be used to
represent and detect relatively generic objects in images. The techniques we present here revolve
around a particular shape representation, based on the description of objects using triangulated
polygons. Triangulated polygons allow us to describe complex shapes using simple building
blocks. As we show in the next section, the triangles that decompose a polygon without holes are
connected together in a tree structure, and this has important algorithmic consequences. By
picking a particular triangulation for the polygons we obtain decompositions of objects into
meaningful parts. This yields a discrete representation closely related to Blum’s medial axis
transform [6]. In this paper we concentrate on the task of finding the location of a deformable
shape in an image. This problem is important for the recognition of non-rigid objects. Moreover,
objects in many generic classes can be described as deformed versions of an ideal template. In
this setting, the location of an object is given by a continuous map from a template to an image.
Figure 1 illustrates how we use a deformable template to detect a particular anatomical structure
in an MR image. We will show how triangulated polygons provide rich models for deformable
shapes. These models can capture both boundary and interior information of an object and can be
deformed in an intuitive way. Equally important, we present an efficient algorithm for finding
the optimal location of a deformable shape in an image. In contrast, previous methods that take
into account the interior of deformable objects.
The geometric properties of rigid objects are well understood. We know how three dimensional
features such as corners or edges project into images, and there are a number of methods that can
be used to represent rigid shapes and locate their projections. Some techniques, such as the
alignment method [23], use explicit three dimensional representations. Other techniques, such as
linear combination of views [36], capture the appearance of three dimensional shapes using a
small number of two dimensional pictures. These and similar techniques assume that all shape
variation comes from the viewpoint dependency of two dimensiona.
A Presentation on the Geometric Bonanza. Hope it will be helpful to students in search of this Topic and even in the topic of Geometry and its Applications. Hope u enjoy it.
Eucluidian and Non eucluidian space in Tensor analysis.Non Euclidian space AJAY CHETRI
Eucluidian and Non eucluidian space in Tensor analysis.
Introduction to type of system in sphere.Benefit and advantage of using Tensor analysis.EUCLID’S GEOMETRY
VS.
NON-EUCLIDEAN GEOMETRY
Key Trends Shaping the Future of Infrastructure.pdfCheryl Hung
Keynote at DIGIT West Expo, Glasgow on 29 May 2024.
Cheryl Hung, ochery.com
Sr Director, Infrastructure Ecosystem, Arm.
The key trends across hardware, cloud and open-source; exploring how these areas are likely to mature and develop over the short and long-term, and then considering how organisations can position themselves to adapt and thrive.
Epistemic Interaction - tuning interfaces to provide information for AI supportAlan Dix
Paper presented at SYNERGY workshop at AVI 2024, Genoa, Italy. 3rd June 2024
https://alandix.com/academic/papers/synergy2024-epistemic/
As machine learning integrates deeper into human-computer interactions, the concept of epistemic interaction emerges, aiming to refine these interactions to enhance system adaptability. This approach encourages minor, intentional adjustments in user behaviour to enrich the data available for system learning. This paper introduces epistemic interaction within the context of human-system communication, illustrating how deliberate interaction design can improve system understanding and adaptation. Through concrete examples, we demonstrate the potential of epistemic interaction to significantly advance human-computer interaction by leveraging intuitive human communication strategies to inform system design and functionality, offering a novel pathway for enriching user-system engagements.
JMeter webinar - integration with InfluxDB and GrafanaRTTS
Watch this recorded webinar about real-time monitoring of application performance. See how to integrate Apache JMeter, the open-source leader in performance testing, with InfluxDB, the open-source time-series database, and Grafana, the open-source analytics and visualization application.
In this webinar, we will review the benefits of leveraging InfluxDB and Grafana when executing load tests and demonstrate how these tools are used to visualize performance metrics.
Length: 30 minutes
Session Overview
-------------------------------------------
During this webinar, we will cover the following topics while demonstrating the integrations of JMeter, InfluxDB and Grafana:
- What out-of-the-box solutions are available for real-time monitoring JMeter tests?
- What are the benefits of integrating InfluxDB and Grafana into the load testing stack?
- Which features are provided by Grafana?
- Demonstration of InfluxDB and Grafana using a practice web application
To view the webinar recording, go to:
https://www.rttsweb.com/jmeter-integration-webinar
Generating a custom Ruby SDK for your web service or Rails API using Smithyg2nightmarescribd
Have you ever wanted a Ruby client API to communicate with your web service? Smithy is a protocol-agnostic language for defining services and SDKs. Smithy Ruby is an implementation of Smithy that generates a Ruby SDK using a Smithy model. In this talk, we will explore Smithy and Smithy Ruby to learn how to generate custom feature-rich SDKs that can communicate with any web service, such as a Rails JSON API.
Dev Dives: Train smarter, not harder – active learning and UiPath LLMs for do...UiPathCommunity
💥 Speed, accuracy, and scaling – discover the superpowers of GenAI in action with UiPath Document Understanding and Communications Mining™:
See how to accelerate model training and optimize model performance with active learning
Learn about the latest enhancements to out-of-the-box document processing – with little to no training required
Get an exclusive demo of the new family of UiPath LLMs – GenAI models specialized for processing different types of documents and messages
This is a hands-on session specifically designed for automation developers and AI enthusiasts seeking to enhance their knowledge in leveraging the latest intelligent document processing capabilities offered by UiPath.
Speakers:
👨🏫 Andras Palfi, Senior Product Manager, UiPath
👩🏫 Lenka Dulovicova, Product Program Manager, UiPath
Kubernetes & AI - Beauty and the Beast !?! @KCD Istanbul 2024Tobias Schneck
As AI technology is pushing into IT I was wondering myself, as an “infrastructure container kubernetes guy”, how get this fancy AI technology get managed from an infrastructure operational view? Is it possible to apply our lovely cloud native principals as well? What benefit’s both technologies could bring to each other?
Let me take this questions and provide you a short journey through existing deployment models and use cases for AI software. On practical examples, we discuss what cloud/on-premise strategy we may need for applying it to our own infrastructure to get it to work from an enterprise perspective. I want to give an overview about infrastructure requirements and technologies, what could be beneficial or limiting your AI use cases in an enterprise environment. An interactive Demo will give you some insides, what approaches I got already working for real.
Encryption in Microsoft 365 - ExpertsLive Netherlands 2024Albert Hoitingh
In this session I delve into the encryption technology used in Microsoft 365 and Microsoft Purview. Including the concepts of Customer Key and Double Key Encryption.
Elevating Tactical DDD Patterns Through Object CalisthenicsDorra BARTAGUIZ
After immersing yourself in the blue book and its red counterpart, attending DDD-focused conferences, and applying tactical patterns, you're left with a crucial question: How do I ensure my design is effective? Tactical patterns within Domain-Driven Design (DDD) serve as guiding principles for creating clear and manageable domain models. However, achieving success with these patterns requires additional guidance. Interestingly, we've observed that a set of constraints initially designed for training purposes remarkably aligns with effective pattern implementation, offering a more ‘mechanical’ approach. Let's explore together how Object Calisthenics can elevate the design of your tactical DDD patterns, offering concrete help for those venturing into DDD for the first time!
Elevating Tactical DDD Patterns Through Object Calisthenics
Geometry theory
1. Geometry Theory
3D computer graphics employ the same principles found in 2D vector artwork, but use a further axis.
When creating 2D vector artwork, the computer draws the image by plotting points on X and Y axes
(creating coordinates) and joining these points with paths (lines). The subsequent shapes can be filled
with colour and the lines stroked with colour and thickness if required.
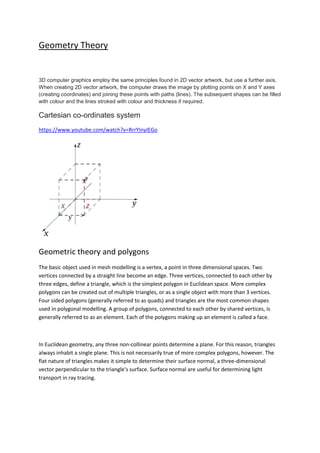
Cartesian co-ordinates system
https://www.youtube.com/watch?v=RrrYInyIEGo
Geometric theory and polygons
The basic object used in mesh modelling is a vertex, a point in three dimensional spaces. Two
vertices connected by a straight line become an edge. Three vertices, connected to each other by
three edges, define a triangle, which is the simplest polygon in Euclidean space. More complex
polygons can be created out of multiple triangles, or as a single object with more than 3 vertices.
Four sided polygons (generally referred to as quads) and triangles are the most common shapes
used in polygonal modelling. A group of polygons, connected to each other by shared vertices, is
generally referred to as an element. Each of the polygons making up an element is called a face.
In Euclidean geometry, any three non-collinear points determine a plane. For this reason, triangles
always inhabit a single plane. This is not necessarily true of more complex polygons, however. The
flat nature of triangles makes it simple to determine their surface normal, a three-dimensional
vector perpendicular to the triangle's surface. Surface normal are useful for determining light
transport in ray tracing.
2. A group of polygons which are connected by shared vertices is referred to as a mesh, often ferred to
as a wireframe model.
Primitive
The term geometric primitive in computer graphics and CAD systems is used in various senses, with
the common meaning of the simplest (i.e. 'atomic' or irreducible) geometric objects that the system
can handle (draw, store). Sometimes the subroutines that draw the corresponding objects are called
"geometric primitives" as well. The most "primitive" primitives are point and straight line segment,
which were all that early vector graphics systems had.
Surfaces
surface, In geometry, a two-dimensional collection of points (flat surface), a three-dimensional
collection of points whose cross section is a curve (curved surface), or the boundary of any three-
dimensional solid. In general, a surface is a continuous boundary dividing a three-dimensional space
into two regions. For example, the surface of a sphere separates the interior from the exterior; a
horizontal plane separates the half-plane above it from the half-plane below. Surfaces are often
called by the names of the regions they enclose, but a surface is essentially two-dimensional and has
an area, while the region it encloses is three-dimensional