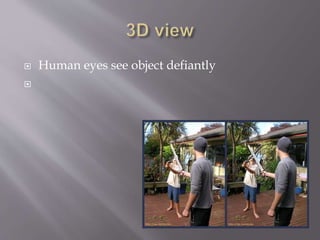
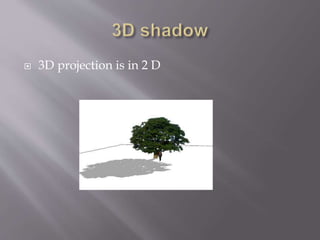
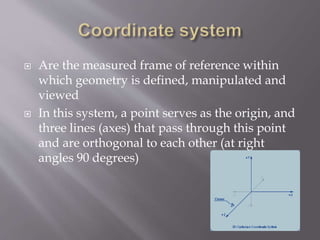
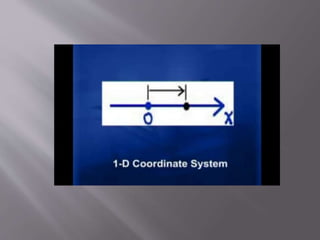
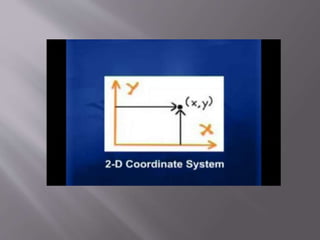
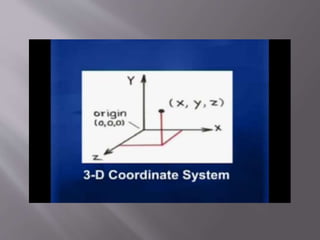
Human eyes perceive 3D projections in 2D. Coordinate systems including 1D, 2D, and 3D Cartesian systems define locations using reference points and orthogonal axes. 3D systems use x, y, and z coordinates to locate points and define geometries in space, including volumes like cubes and spheres. Coordinate transformations allow changing between reference frames.
Hypsometric curves represent a basin-scale topographic metric, comparable to adjacent basins to distinguish relative age and stage of landscape evolution. These curves are easily derivable in GRASS GIS for no cost.
You can find more gis-based geomorphology workflows at my website: https://sites.google.com/site/sorsbysj/
- Skyler Sorsby
Sinuosity is often approximated at the reach scale, as a back-of-the-envelope calculation to aid in describing morphology of fluvial channels. Here, I present a preliminary workflow for calculating continuous, pixel-by-pixel sinuosity along a rasterized stream channel in GRASS GIS.
You can find more gis-based geomorphology workflows at my website: https://sites.google.com/site/sorsbysj/
- Skyler Sorsby
Standard A-A' topographic profiles are widely used in the geosciences to construct cross sections and investigate surficial processes. However, simple line profiles fail to capture the wider topographic regime. Here, I present a workflow to calculate a swath profile in GRASS GIS. The basic premise is, a swath profile "looks off to the side" along each step in a standard profile line, and calculates min/mean/max elevation, hence producing a statistically-relevant 2-d approximation of topography.
You can find more gis-based geomorphology workflows at my website: https://sites.google.com/site/sorsbysj/
- Skyler Sorsby
Chart and graphs in R programming language CHANDAN KUMAR
This slide contains basics of charts and graphs in R programming language. I also focused on practical knowledge so I tried to give maximum example to understand the concepts.
Top 8 Different Types Of Charts In Statistics And Their UsesStat Analytica
Are you confused about various Types Of Charts In Statistics? In this blog, you will get to learn about the various Types Of Charts In Statistics in detail.
Introduction to geomorphology in GRASS GIS - by Skyler SorsbySkyler Sorsby
GRASS GIS comprises a powerful geographic tool with which to analyze topography and tectonics. Specifically, GIS aids investigation of elevation data and fluvial hydrology. Here is my personal introduction to the creation and manipulation of the data from DEM's in GRASS GIS.
You can find more gis-based geomorphology workflows at my website: https://sites.google.com/site/sorsbysj/
- Skyler Sorsby
This PPT shows how to handle data using a Circle graph, how to make a Circle Graph, how to put data in Circle Graph and how to divide the circle graph into sectors or parts.
Comprehensive coverage of fundamentals of computer graphics.
3D Transformations
Reflections
3D Display methods
3D Object Representation
Polygon surfaces
Quadratic Surfaces
Chapter summary and solutions to end-of-chapter exercises for "Data Visualization: Principles and Practice" book by Alexandru C. Telea
Chapter provides an overview of a number of methods for visualizing tensor data. It explains principal component analysis as a technique used to process a tensor matrix and extract from it information that can directly be used in its visualization. It forms a fundamental part of many tensor data processing and visualization algorithms. Section 7.4 shows how the results of the principal component analysis can be visualized using the simple color-mapping techniques. Next parts of the chapter explain how same data can be visualized using tensor glyphs, and streamline-like visualization techniques.
In contrast to Slicer, which is a more general framework for analyzing and visualizing 3D slice-based data volumes, the Diffusion Toolkit focuses on DT-MRI datasets, and thus offers more extensive and easier to use options for fiber tracking.
This is a primer on some of the foundations of 3D math used in computer graphics programming. This is the version of the talk from CocoaConf Chicago 2015.
Transformation:
Transformations are a fundamental part of the computer graphics. Transformations are the movement of the object in Cartesian plane.
Types of transformation
Why we use transformation
3D Transformation
3D Translation
3D Rotation
3D Scaling
3D Reflection
3D Shearing
- Depression symptoms, how do you know you are depressed?, How to identify depression?
- Anxiety symptoms, How to identify anxiety
- Eating disorder
- Addiction illicit drugs
WHAT TO DO?
Introduction to machine learningunsupervised learningSardar Alam
Introduction to Machine learning and unsupervised learning by Andrew Ng is an Associate Professor at Stanford; Chief Scientist of Baidu; and Chairman and Co-Founder of Coursera. intresting slides...its video lecture also on Coursera.
Why React Native as a Strategic Advantage for Startup Innovation.pdfayushiqss
Do you know that React Native is being increasingly adopted by startups as well as big companies in the mobile app development industry? Big names like Facebook, Instagram, and Pinterest have already integrated this robust open-source framework.
In fact, according to a report by Statista, the number of React Native developers has been steadily increasing over the years, reaching an estimated 1.9 million by the end of 2024. This means that the demand for this framework in the job market has been growing making it a valuable skill.
But what makes React Native so popular for mobile application development? It offers excellent cross-platform capabilities among other benefits. This way, with React Native, developers can write code once and run it on both iOS and Android devices thus saving time and resources leading to shorter development cycles hence faster time-to-market for your app.
Let’s take the example of a startup, which wanted to release their app on both iOS and Android at once. Through the use of React Native they managed to create an app and bring it into the market within a very short period. This helped them gain an advantage over their competitors because they had access to a large user base who were able to generate revenue quickly for them.
Quarkus Hidden and Forbidden ExtensionsMax Andersen
Quarkus has a vast extension ecosystem and is known for its subsonic and subatomic feature set. Some of these features are not as well known, and some extensions are less talked about, but that does not make them less interesting - quite the opposite.
Come join this talk to see some tips and tricks for using Quarkus and some of the lesser known features, extensions and development techniques.
OpenFOAM solver for Helmholtz equation, helmholtzFoam / helmholtzBubbleFoamtakuyayamamoto1800
In this slide, we show the simulation example and the way to compile this solver.
In this solver, the Helmholtz equation can be solved by helmholtzFoam. Also, the Helmholtz equation with uniformly dispersed bubbles can be simulated by helmholtzBubbleFoam.
Listen to the keynote address and hear about the latest developments from Rachana Ananthakrishnan and Ian Foster who review the updates to the Globus Platform and Service, and the relevance of Globus to the scientific community as an automation platform to accelerate scientific discovery.
Paketo Buildpacks : la meilleure façon de construire des images OCI? DevopsDa...Anthony Dahanne
Les Buildpacks existent depuis plus de 10 ans ! D’abord, ils étaient utilisés pour détecter et construire une application avant de la déployer sur certains PaaS. Ensuite, nous avons pu créer des images Docker (OCI) avec leur dernière génération, les Cloud Native Buildpacks (CNCF en incubation). Sont-ils une bonne alternative au Dockerfile ? Que sont les buildpacks Paketo ? Quelles communautés les soutiennent et comment ?
Venez le découvrir lors de cette session ignite
Providing Globus Services to Users of JASMIN for Environmental Data AnalysisGlobus
JASMIN is the UK’s high-performance data analysis platform for environmental science, operated by STFC on behalf of the UK Natural Environment Research Council (NERC). In addition to its role in hosting the CEDA Archive (NERC’s long-term repository for climate, atmospheric science & Earth observation data in the UK), JASMIN provides a collaborative platform to a community of around 2,000 scientists in the UK and beyond, providing nearly 400 environmental science projects with working space, compute resources and tools to facilitate their work. High-performance data transfer into and out of JASMIN has always been a key feature, with many scientists bringing model outputs from supercomputers elsewhere in the UK, to analyse against observational or other model data in the CEDA Archive. A growing number of JASMIN users are now realising the benefits of using the Globus service to provide reliable and efficient data movement and other tasks in this and other contexts. Further use cases involve long-distance (intercontinental) transfers to and from JASMIN, and collecting results from a mobile atmospheric radar system, pushing data to JASMIN via a lightweight Globus deployment. We provide details of how Globus fits into our current infrastructure, our experience of the recent migration to GCSv5.4, and of our interest in developing use of the wider ecosystem of Globus services for the benefit of our user community.
How Recreation Management Software Can Streamline Your Operations.pptxwottaspaceseo
Recreation management software streamlines operations by automating key tasks such as scheduling, registration, and payment processing, reducing manual workload and errors. It provides centralized management of facilities, classes, and events, ensuring efficient resource allocation and facility usage. The software offers user-friendly online portals for easy access to bookings and program information, enhancing customer experience. Real-time reporting and data analytics deliver insights into attendance and preferences, aiding in strategic decision-making. Additionally, effective communication tools keep participants and staff informed with timely updates. Overall, recreation management software enhances efficiency, improves service delivery, and boosts customer satisfaction.
Developing Distributed High-performance Computing Capabilities of an Open Sci...Globus
COVID-19 had an unprecedented impact on scientific collaboration. The pandemic and its broad response from the scientific community has forged new relationships among public health practitioners, mathematical modelers, and scientific computing specialists, while revealing critical gaps in exploiting advanced computing systems to support urgent decision making. Informed by our team’s work in applying high-performance computing in support of public health decision makers during the COVID-19 pandemic, we present how Globus technologies are enabling the development of an open science platform for robust epidemic analysis, with the goal of collaborative, secure, distributed, on-demand, and fast time-to-solution analyses to support public health.
Experience our free, in-depth three-part Tendenci Platform Corporate Membership Management workshop series! In Session 1 on May 14th, 2024, we began with an Introduction and Setup, mastering the configuration of your Corporate Membership Module settings to establish membership types, applications, and more. Then, on May 16th, 2024, in Session 2, we focused on binding individual members to a Corporate Membership and Corporate Reps, teaching you how to add individual members and assign Corporate Representatives to manage dues, renewals, and associated members. Finally, on May 28th, 2024, in Session 3, we covered questions and concerns, addressing any queries or issues you may have.
For more Tendenci AMS events, check out www.tendenci.com/events
Cyaniclab : Software Development Agency Portfolio.pdfCyanic lab
CyanicLab, an offshore custom software development company based in Sweden,India, Finland, is your go-to partner for startup development and innovative web design solutions. Our expert team specializes in crafting cutting-edge software tailored to meet the unique needs of startups and established enterprises alike. From conceptualization to execution, we offer comprehensive services including web and mobile app development, UI/UX design, and ongoing software maintenance. Ready to elevate your business? Contact CyanicLab today and let us propel your vision to success with our top-notch IT solutions.
Accelerate Enterprise Software Engineering with PlatformlessWSO2
Key takeaways:
Challenges of building platforms and the benefits of platformless.
Key principles of platformless, including API-first, cloud-native middleware, platform engineering, and developer experience.
How Choreo enables the platformless experience.
How key concepts like application architecture, domain-driven design, zero trust, and cell-based architecture are inherently a part of Choreo.
Demo of an end-to-end app built and deployed on Choreo.
Large Language Models and the End of ProgrammingMatt Welsh
Talk by Matt Welsh at Craft Conference 2024 on the impact that Large Language Models will have on the future of software development. In this talk, I discuss the ways in which LLMs will impact the software industry, from replacing human software developers with AI, to replacing conventional software with models that perform reasoning, computation, and problem-solving.
Innovating Inference - Remote Triggering of Large Language Models on HPC Clus...Globus
Large Language Models (LLMs) are currently the center of attention in the tech world, particularly for their potential to advance research. In this presentation, we'll explore a straightforward and effective method for quickly initiating inference runs on supercomputers using the vLLM tool with Globus Compute, specifically on the Polaris system at ALCF. We'll begin by briefly discussing the popularity and applications of LLMs in various fields. Following this, we will introduce the vLLM tool, and explain how it integrates with Globus Compute to efficiently manage LLM operations on Polaris. Attendees will learn the practical aspects of setting up and remotely triggering LLMs from local machines, focusing on ease of use and efficiency. This talk is ideal for researchers and practitioners looking to leverage the power of LLMs in their work, offering a clear guide to harnessing supercomputing resources for quick and effective LLM inference.
Globus Connect Server Deep Dive - GlobusWorld 2024Globus
We explore the Globus Connect Server (GCS) architecture and experiment with advanced configuration options and use cases. This content is targeted at system administrators who are familiar with GCS and currently operate—or are planning to operate—broader deployments at their institution.
Strategies for Successful Data Migration Tools.pptxvarshanayak241
Data migration is a complex but essential task for organizations aiming to modernize their IT infrastructure and leverage new technologies. By understanding common challenges and implementing these strategies, businesses can achieve a successful migration with minimal disruption. Data Migration Tool like Ask On Data play a pivotal role in this journey, offering features that streamline the process, ensure data integrity, and maintain security. With the right approach and tools, organizations can turn the challenge of data migration into an opportunity for growth and innovation.
Unleash Unlimited Potential with One-Time Purchase
BoxLang is more than just a language; it's a community. By choosing a Visionary License, you're not just investing in your success, you're actively contributing to the ongoing development and support of BoxLang.
Multiple Your Crypto Portfolio with the Innovative Features of Advanced Crypt...Hivelance Technology
Cryptocurrency trading bots are computer programs designed to automate buying, selling, and managing cryptocurrency transactions. These bots utilize advanced algorithms and machine learning techniques to analyze market data, identify trading opportunities, and execute trades on behalf of their users. By automating the decision-making process, crypto trading bots can react to market changes faster than human traders
Hivelance, a leading provider of cryptocurrency trading bot development services, stands out as the premier choice for crypto traders and developers. Hivelance boasts a team of seasoned cryptocurrency experts and software engineers who deeply understand the crypto market and the latest trends in automated trading, Hivelance leverages the latest technologies and tools in the industry, including advanced AI and machine learning algorithms, to create highly efficient and adaptable crypto trading bots
Globus Compute wth IRI Workflows - GlobusWorld 2024Globus
As part of the DOE Integrated Research Infrastructure (IRI) program, NERSC at Lawrence Berkeley National Lab and ALCF at Argonne National Lab are working closely with General Atomics on accelerating the computing requirements of the DIII-D experiment. As part of the work the team is investigating ways to speedup the time to solution for many different parts of the DIII-D workflow including how they run jobs on HPC systems. One of these routes is looking at Globus Compute as a way to replace the current method for managing tasks and we describe a brief proof of concept showing how Globus Compute could help to schedule jobs and be a tool to connect compute at different facilities.
4. Are the measured frame of reference within
which geometry is defined, manipulated and
viewed
In this system, a point serves as the origin, and
three lines (axes) that pass through this point
and are orthogonal to each other (at right
angles 90 degrees)
5. 1D coordinate system
2D coordinate system
3D coordinate system
6. Direction and magnitude along a single axis,
with reference to origin
Location are defined by a single coordinate
7. We can define points, segments, lines rays
Can have multiple origins (frame of reference)
and transform coordinates among them
8.
9. Direction and magnitude along two axes, with
reference to an origin
Location are defined by x, y coordinate
10. We can define points, segments, lines rays,
curves, polygons (any other planar geometry)
Can have multiple origins (frame of reference)
and transform coordinates among them
11.
12. 3D Cartesian coordinate system
Direction and magnitude along three axes, with
reference to an origin
Location are defined by x, y, z coordinate
13. We can define points, segments, lines rays,
curves, polygons (any other planar geometry)
and cubes, cones, spheres, etc. (volume in
space)
Can have multiple origins (frame of reference)
and transform coordinates among them
14.
15. right hand rules etc.
These rules determine orientation of axes and
direction of rotations
Thumb = pos x
Index up = pos y
Middle out = pos z
16. Most world and objects axes tend to be right
handed
Left hand axes often are used for cmaeras
17.
18. Grasp axis with right hand
with thumb oriented in
positive direction, fingers
will then curl in direction of
positive rotation for that
axis
19. Right handed Cartesian coordinate system
describes the relationship of the x, y, z in the
following manner
X is positive to the right of the origin and
negative to the left
Y is positive to the above of the origin and
negative to the below
Z is positive behind the origin and negative
beyond
20. Z up typically used by designers
Y up typically used by animators
21. Application data will be transformed among
the various coordinate systems depending on
whats to be accomplished
Individual coordinate systems often are
hierarchically linked within the scene
22. Use OPP to make the object of the 3d points
Class 3d-class
{ public:
Float x;
Float y;
Float z;
}
23. Modeling is the process of describing an object
or scene so that we can construct an image of it
Angle, location, size etc..
Polygon strips or meshes
Meshes provide a more economical description than
multiple individual polygons (wireframe model
100 individual triangles, each have 3 vertices, would
require 100 x3 vertex definitions
Triangle strips require n + 2 vertex definitions, n is
number of triangles in strip. For 100 needs 102
unique vertex definitions
24. Meshes also provide continuity across surfaces
which is important for shading calculations
25.
26. With cured surfaces the accuracy of the
approximation is directly proportional to the
number of polygons used in the representation
More polygons yield a better approximation
But more polygons also exact greater
computational overhead..
27. The process of computing a 2d image using a
combination of a 3 D database, scene
characteristics and viewing transformations
Various Alog. According to the need of
applications
28. The subdivision of an entity or surface into one
or more non-overlapping primitives
Typically, renderers decompose surfaces into
triangles as part of the rendering
29.
30.
31. The process of selecting a representative but
finite number of values along a continuous
function sufficient to render a reasonable
approximations of the function for the task at
hand
32. To improve rendering efficiency when
dynamically viewing a scene, more or less
detailed versions of a model may be swapped
in and out of the scene database depending on
the importance of the object in current view
33. A vector perpendicular to a surface and
outward facing
SN are used to determine visibility and also in
the calculation of shading values