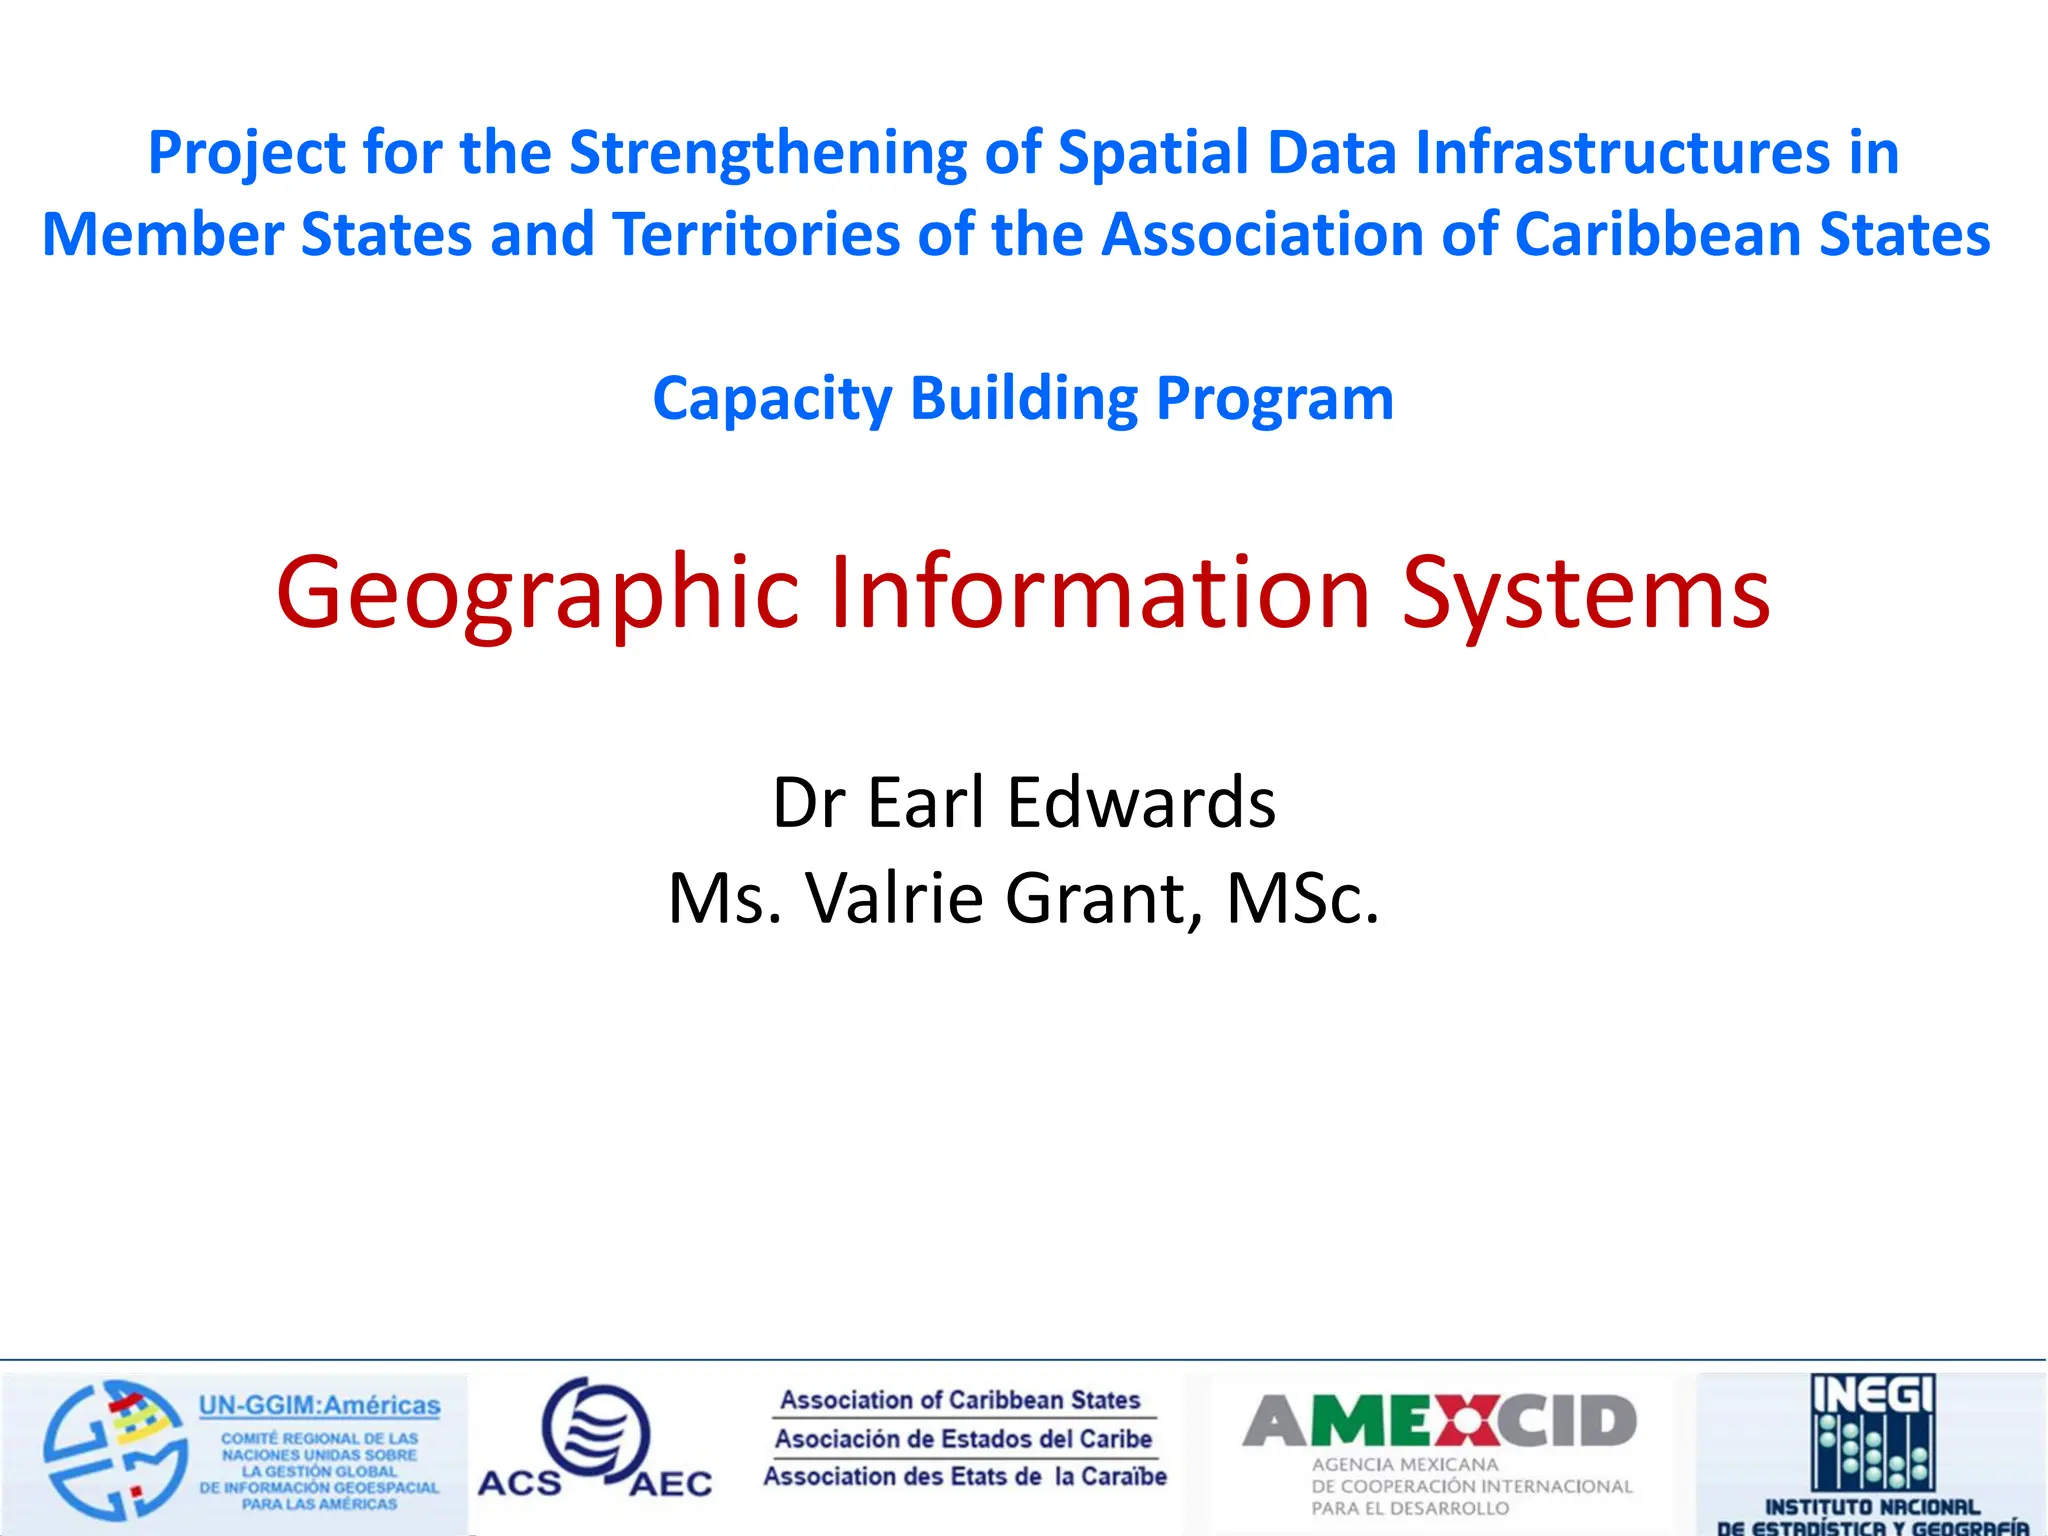
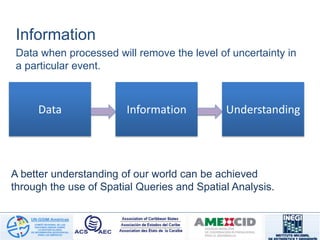
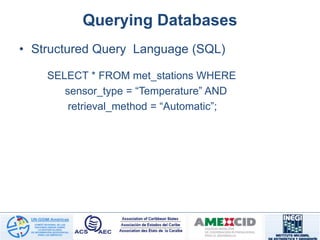
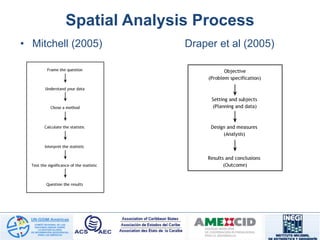
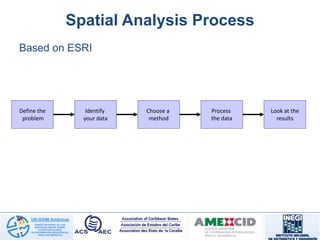
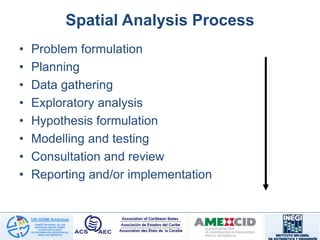
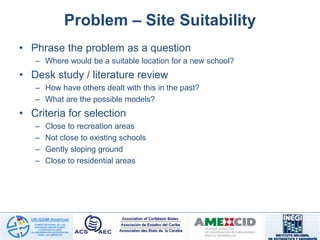
Project for the Strengthening of Spatial Data Infrastructures in
Member States and Territories of the Association of Caribbean States
Capacity Building Program
Geographic Information Systems
Dr Earl Edwards
Ms. Valrie Grant, MSc.
The GIS Process
Geospatial Information processing begins and
ends with the real world
Source: Aronoff (1991)
Data Management
Data Sources
Real World
Analysis
Data
Input
Users
Topic 6:
Spatial Query and Analysis in GIS
Topic Outline
• What is Spatial Query?
• Querying Geodatabases
• ArcGIS Spatial Tools
• What is Spatial Analysis?
• Components of Spatial Analysis
• Spatial Interpolation
• Spatial Analysis Process
Information
Data when processed will remove the level of uncertainty in
a particular event.
Data Information Understanding
A better understanding of our world can be achieved
through the use of Spatial Queries and Spatial Analysis.
What is a Spatial Query?
• A spatial query is a special type of database
query supported by geodatabases and spatial
databases.
• It allows for the use of geometry data types such
as points, lines and polygons and that these
queries consider the spatial relationship
between these geometries.
Querying Databases
• Structured Query Language (SQL)
SELECT * FROM met_stations WHERE
sensor_type = “Temperature” AND
retrieval_method = “Automatic”;
Querying Geodatabases
Querying the Geodatabase
ArcGIS Tools
• Found in ArcToolbox
– ArcMap, ArcCatalog,
ArcScene, and ArcGlobe
• Powerful set of tools to
perform analysis
geoprocessing tasks
• Designed to perform
vector analysis
• License determines tools
ArcGIS Advanced license level
Select
• Extracts features from a feature class or layer and stores
them in a new feature class
• Output feature class optionally created using a SQL
expression
Select zoning
polygons designated
as community
shopping district
Buffer
What is Spatial Analysis?
• Analysis is one of six GIS functions
• Process for highlighting patterns and
relationships in spatial (geographic) data
using spatial query
• Most people are still using GIS to only make
maps
• GIS can do much more - Analysis Query
Analyze
Store
Display
Capture
Output
Buildings
Streets
Reality
Customers
Components of Spatial Analysis
• Visualization
– Showing interesting patterns
• Exploratory Spatial Data Analysis (ESDA)
– Finding interesting patterns
• Spatial Modelling, Regression
– Explaining interesting patterns
Why do analysis?
• Gives insight into places of interest
• Helps focus actions to choose the best option
Determining the
relationship between
crime locations
and schools
Crimes
Schools
0.1 mile buffer
Analysis answers simple questions
Map where
things are located
Map the most
and least
Map density
Find what
is inside
Find what
is nearby
Map change
X,Y
Analysis
Typical Operations
• Point pattern analysis (Hotspots)
• Points in polygons
• Polygon overlay
• Spatial interpolation
• Density estimation
Point Pattern Analysis
• Determine if patterns
exist among point
features
• Examine the spatial
patterns and draw
suitable conclusions
• Example: Crime hot
spot analysis in
Trinidad or Tobago
Point Pattern Analysis
For example, the work of
John Snow 1865 plotting
deaths from cholera on a
map along with the 11
community wells.
The map revealed an
association between
cholera and the broad
street pump
Point Pattern Analysis
PPA relies heavily on Tobler's
First Law of Geography
“Everything is related to
everything else, but
nearby things are more
related than distant things”
Foundation of the fundamental
concept of spatial dependence
which is at the core of spatial
analysis
Waldo R Tobler
Overlay Analysis
Line on Polygon
+ + + + + + +
Polygon on
Polygon
Point on
Polygon
Raster cell coincidence
• Analysis between rasters compares values for cells
– Rasters must be registered to a common coordinate system
TotCost (3,2) = Cost1 (3,2) + Cost2 (3,2)
15 = 5 + 10
TotCost
Cost1
Cost2
0 1 2
1 0
2
3 3 4
4
5
10
15
Spatial Interpolation
• Traditionally, data collected in the field comprise of point
measurements at discrete locations. Today it is usual to
have automated system, like weather station, that collect
vast amounts of data
• These datasets are still samples and would not
represent a continuous surface over the area of interest
• Spatial interpolation methods are used to estimate
values at unsampled locations using measurements at
sampled locations
• Effectively fills in the unknown information using the
known information
Spatial Interpolation
• Methods include
– Inverse Distance
Weighted
– Spline
– Kriging
• Mitchell (2005) Draper et al (2005)
Spatial Analysis Process
Define the
problem
Identify
your data
Choose a
method
Process
the data
Look at the
results
Based on ESRI
Spatial Analysis Process
• Problem formulation
• Planning
• Data gathering
• Exploratory analysis
• Hypothesis formulation
• Modelling and testing
• Consultation and review
• Reporting and/or implementation
Problem – Site Suitability
• Phrase the problem as a question
– Where would be a suitable location for a new school?
• Desk study / literature review
– How have others dealt with this in the past?
– What are the possible models?
• Criteria for selection
– Close to recreation areas
– Not close to existing schools
– Gently sloping ground
– Close to residential areas
Possible Result - Optimal Site
A Simple Model
Onions
Chop
Boil
Whole
Chicken
Celery Carrots
Wild
Rice
Chopped
Vegetables
Chicken
Broth
Garlic
Chicken
Soup
Salt
and
Pepper
Boil
Chicken
Boiled
Separate Chicken
Bones
Chicken
Meat
31
Roads
A Cartographic Model
Streams
Perennial
Stream
Road
Buffer
Stream
Buffer
Composite 2
Composite 3
BUFFER
200
SELECT
OVERLAY
Soils
Zones
Composite 1
BUFFER
500
OVERLAY
OVERLAY
Cartographic Modelling with Model Builder
Modelling Susceptibility to Landslides
• Precipitation
• Elevation
• Slope
• Aspect
• Curvature
• Earthquake zones
• Landcover
• Soil/Geology
• Human activities
• etc
Source: USGS
Source: Jamaica Gleaner
Historical Landslides
Source: Dr Rafi Ahmad, UWI Mona
Landslide Susceptibility Model
Landslide Susceptibility Zones
Source: Mona Geoinfomatics Institute
Other Analysis Examples
 Determination of visibility
 line-of-sight
 view sheds
 Site Suitability Analysis
 Finding the best site for a school
 Network Analysis
 optimal routes
 allocation of resources
Site Suitability
A suitability model typically answers the question, Where is the best location?—whether it involves
finding the best location for a new road or pipeline, a new housing development, or a retail store.
For instance, a commercial developer building a new retail store may take into consideration distance
to major highways and any competitors' stores, then combine the results with land-use, population
density, and consumer spending data to decide on the best location for the store.
ArcGIS Spatial Analyst derives new information from the overlay of multiple layers, which can then
be used to determine the best location.
Network Analysis
Route Closest Facility Service Area
Vehicle Routing
Problem
Location-Allocation
Origin-Destination
Cost Matrix
Density Analysis
Hydrologic Analysis
British statistician
George E. Box
“Essentially all
models are wrong,
but some are useful”
UP NEXT …..
Activity: Conducting Spatial Query and
Analysis in ArcGIS
Acknowledgement
Except where stated, images used in this
presentation were acquired from multiple sources
on the world wide web.

Geographic Information Systems Spatial query and analysis

  • 1.
    Project for theStrengthening of Spatial Data Infrastructures in Member States and Territories of the Association of Caribbean States Capacity Building Program Geographic Information Systems Dr Earl Edwards Ms. Valrie Grant, MSc.
  • 2.
    The GIS Process GeospatialInformation processing begins and ends with the real world Source: Aronoff (1991) Data Management Data Sources Real World Analysis Data Input Users
  • 3.
    Topic 6: Spatial Queryand Analysis in GIS
  • 4.
    Topic Outline • Whatis Spatial Query? • Querying Geodatabases • ArcGIS Spatial Tools • What is Spatial Analysis? • Components of Spatial Analysis • Spatial Interpolation • Spatial Analysis Process
  • 5.
    Information Data when processedwill remove the level of uncertainty in a particular event. Data Information Understanding A better understanding of our world can be achieved through the use of Spatial Queries and Spatial Analysis.
  • 6.
    What is aSpatial Query? • A spatial query is a special type of database query supported by geodatabases and spatial databases. • It allows for the use of geometry data types such as points, lines and polygons and that these queries consider the spatial relationship between these geometries.
  • 7.
    Querying Databases • StructuredQuery Language (SQL) SELECT * FROM met_stations WHERE sensor_type = “Temperature” AND retrieval_method = “Automatic”;
  • 8.
  • 9.
  • 10.
    ArcGIS Tools • Foundin ArcToolbox – ArcMap, ArcCatalog, ArcScene, and ArcGlobe • Powerful set of tools to perform analysis geoprocessing tasks • Designed to perform vector analysis • License determines tools ArcGIS Advanced license level
  • 11.
    Select • Extracts featuresfrom a feature class or layer and stores them in a new feature class • Output feature class optionally created using a SQL expression Select zoning polygons designated as community shopping district
  • 12.
  • 13.
    What is SpatialAnalysis? • Analysis is one of six GIS functions • Process for highlighting patterns and relationships in spatial (geographic) data using spatial query • Most people are still using GIS to only make maps • GIS can do much more - Analysis Query Analyze Store Display Capture Output Buildings Streets Reality Customers
  • 14.
    Components of SpatialAnalysis • Visualization – Showing interesting patterns • Exploratory Spatial Data Analysis (ESDA) – Finding interesting patterns • Spatial Modelling, Regression – Explaining interesting patterns
  • 15.
    Why do analysis? •Gives insight into places of interest • Helps focus actions to choose the best option Determining the relationship between crime locations and schools Crimes Schools 0.1 mile buffer
  • 16.
    Analysis answers simplequestions Map where things are located Map the most and least Map density Find what is inside Find what is nearby Map change X,Y Analysis
  • 17.
    Typical Operations • Pointpattern analysis (Hotspots) • Points in polygons • Polygon overlay • Spatial interpolation • Density estimation
  • 18.
    Point Pattern Analysis •Determine if patterns exist among point features • Examine the spatial patterns and draw suitable conclusions • Example: Crime hot spot analysis in Trinidad or Tobago
  • 19.
    Point Pattern Analysis Forexample, the work of John Snow 1865 plotting deaths from cholera on a map along with the 11 community wells. The map revealed an association between cholera and the broad street pump
  • 20.
    Point Pattern Analysis PPArelies heavily on Tobler's First Law of Geography “Everything is related to everything else, but nearby things are more related than distant things” Foundation of the fundamental concept of spatial dependence which is at the core of spatial analysis Waldo R Tobler
  • 21.
    Overlay Analysis Line onPolygon + + + + + + + Polygon on Polygon Point on Polygon
  • 22.
    Raster cell coincidence •Analysis between rasters compares values for cells – Rasters must be registered to a common coordinate system TotCost (3,2) = Cost1 (3,2) + Cost2 (3,2) 15 = 5 + 10 TotCost Cost1 Cost2 0 1 2 1 0 2 3 3 4 4 5 10 15
  • 23.
    Spatial Interpolation • Traditionally,data collected in the field comprise of point measurements at discrete locations. Today it is usual to have automated system, like weather station, that collect vast amounts of data • These datasets are still samples and would not represent a continuous surface over the area of interest • Spatial interpolation methods are used to estimate values at unsampled locations using measurements at sampled locations • Effectively fills in the unknown information using the known information
  • 24.
    Spatial Interpolation • Methodsinclude – Inverse Distance Weighted – Spline – Kriging
  • 25.
    • Mitchell (2005)Draper et al (2005) Spatial Analysis Process
  • 26.
    Spatial Analysis Process Definethe problem Identify your data Choose a method Process the data Look at the results Based on ESRI
  • 27.
    Spatial Analysis Process •Problem formulation • Planning • Data gathering • Exploratory analysis • Hypothesis formulation • Modelling and testing • Consultation and review • Reporting and/or implementation
  • 28.
    Problem – SiteSuitability • Phrase the problem as a question – Where would be a suitable location for a new school? • Desk study / literature review – How have others dealt with this in the past? – What are the possible models? • Criteria for selection – Close to recreation areas – Not close to existing schools – Gently sloping ground – Close to residential areas
  • 29.
    Possible Result -Optimal Site
  • 30.
    A Simple Model Onions Chop Boil Whole Chicken CeleryCarrots Wild Rice Chopped Vegetables Chicken Broth Garlic Chicken Soup Salt and Pepper Boil Chicken Boiled Separate Chicken Bones Chicken Meat
  • 31.
    31 Roads A Cartographic Model Streams Perennial Stream Road Buffer Stream Buffer Composite2 Composite 3 BUFFER 200 SELECT OVERLAY Soils Zones Composite 1 BUFFER 500 OVERLAY OVERLAY
  • 32.
  • 33.
    Modelling Susceptibility toLandslides • Precipitation • Elevation • Slope • Aspect • Curvature • Earthquake zones • Landcover • Soil/Geology • Human activities • etc Source: USGS Source: Jamaica Gleaner
  • 34.
  • 35.
  • 36.
    Landslide Susceptibility Zones Source:Mona Geoinfomatics Institute
  • 37.
    Other Analysis Examples Determination of visibility  line-of-sight  view sheds  Site Suitability Analysis  Finding the best site for a school  Network Analysis  optimal routes  allocation of resources
  • 39.
    Site Suitability A suitabilitymodel typically answers the question, Where is the best location?—whether it involves finding the best location for a new road or pipeline, a new housing development, or a retail store. For instance, a commercial developer building a new retail store may take into consideration distance to major highways and any competitors' stores, then combine the results with land-use, population density, and consumer spending data to decide on the best location for the store. ArcGIS Spatial Analyst derives new information from the overlay of multiple layers, which can then be used to determine the best location.
  • 40.
    Network Analysis Route ClosestFacility Service Area Vehicle Routing Problem Location-Allocation Origin-Destination Cost Matrix
  • 41.
  • 42.
  • 43.
    British statistician George E.Box “Essentially all models are wrong, but some are useful”
  • 44.
    UP NEXT ….. Activity:Conducting Spatial Query and Analysis in ArcGIS
  • 45.
    Acknowledgement Except where stated,images used in this presentation were acquired from multiple sources on the world wide web.