Download to read offline


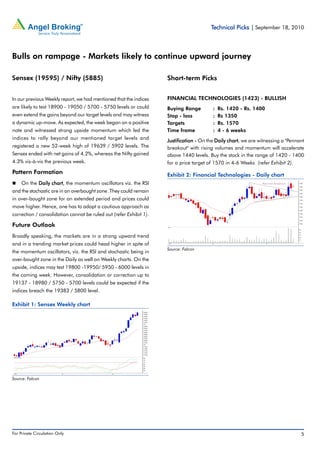

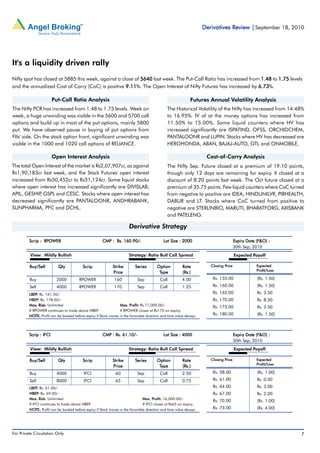

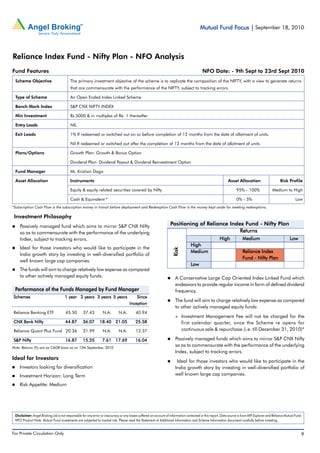


The document provides a weekly market review for the period ending September 17, 2010. Key points include: - Indian markets hit 32-month highs and ended the week up over 4%, led by banking stocks which rose nearly 6%. - The RBI raised interest rates in its mid-quarter policy review to control inflation, hiking repo rates 25 bps to 6% and reverse repo 50 bps to 5%. - Banking stocks are expected to outperform over the next two years due to strong credit growth. Large private banks are favored due to their competitive positioning in a rising rate environment.


