Download to read offline

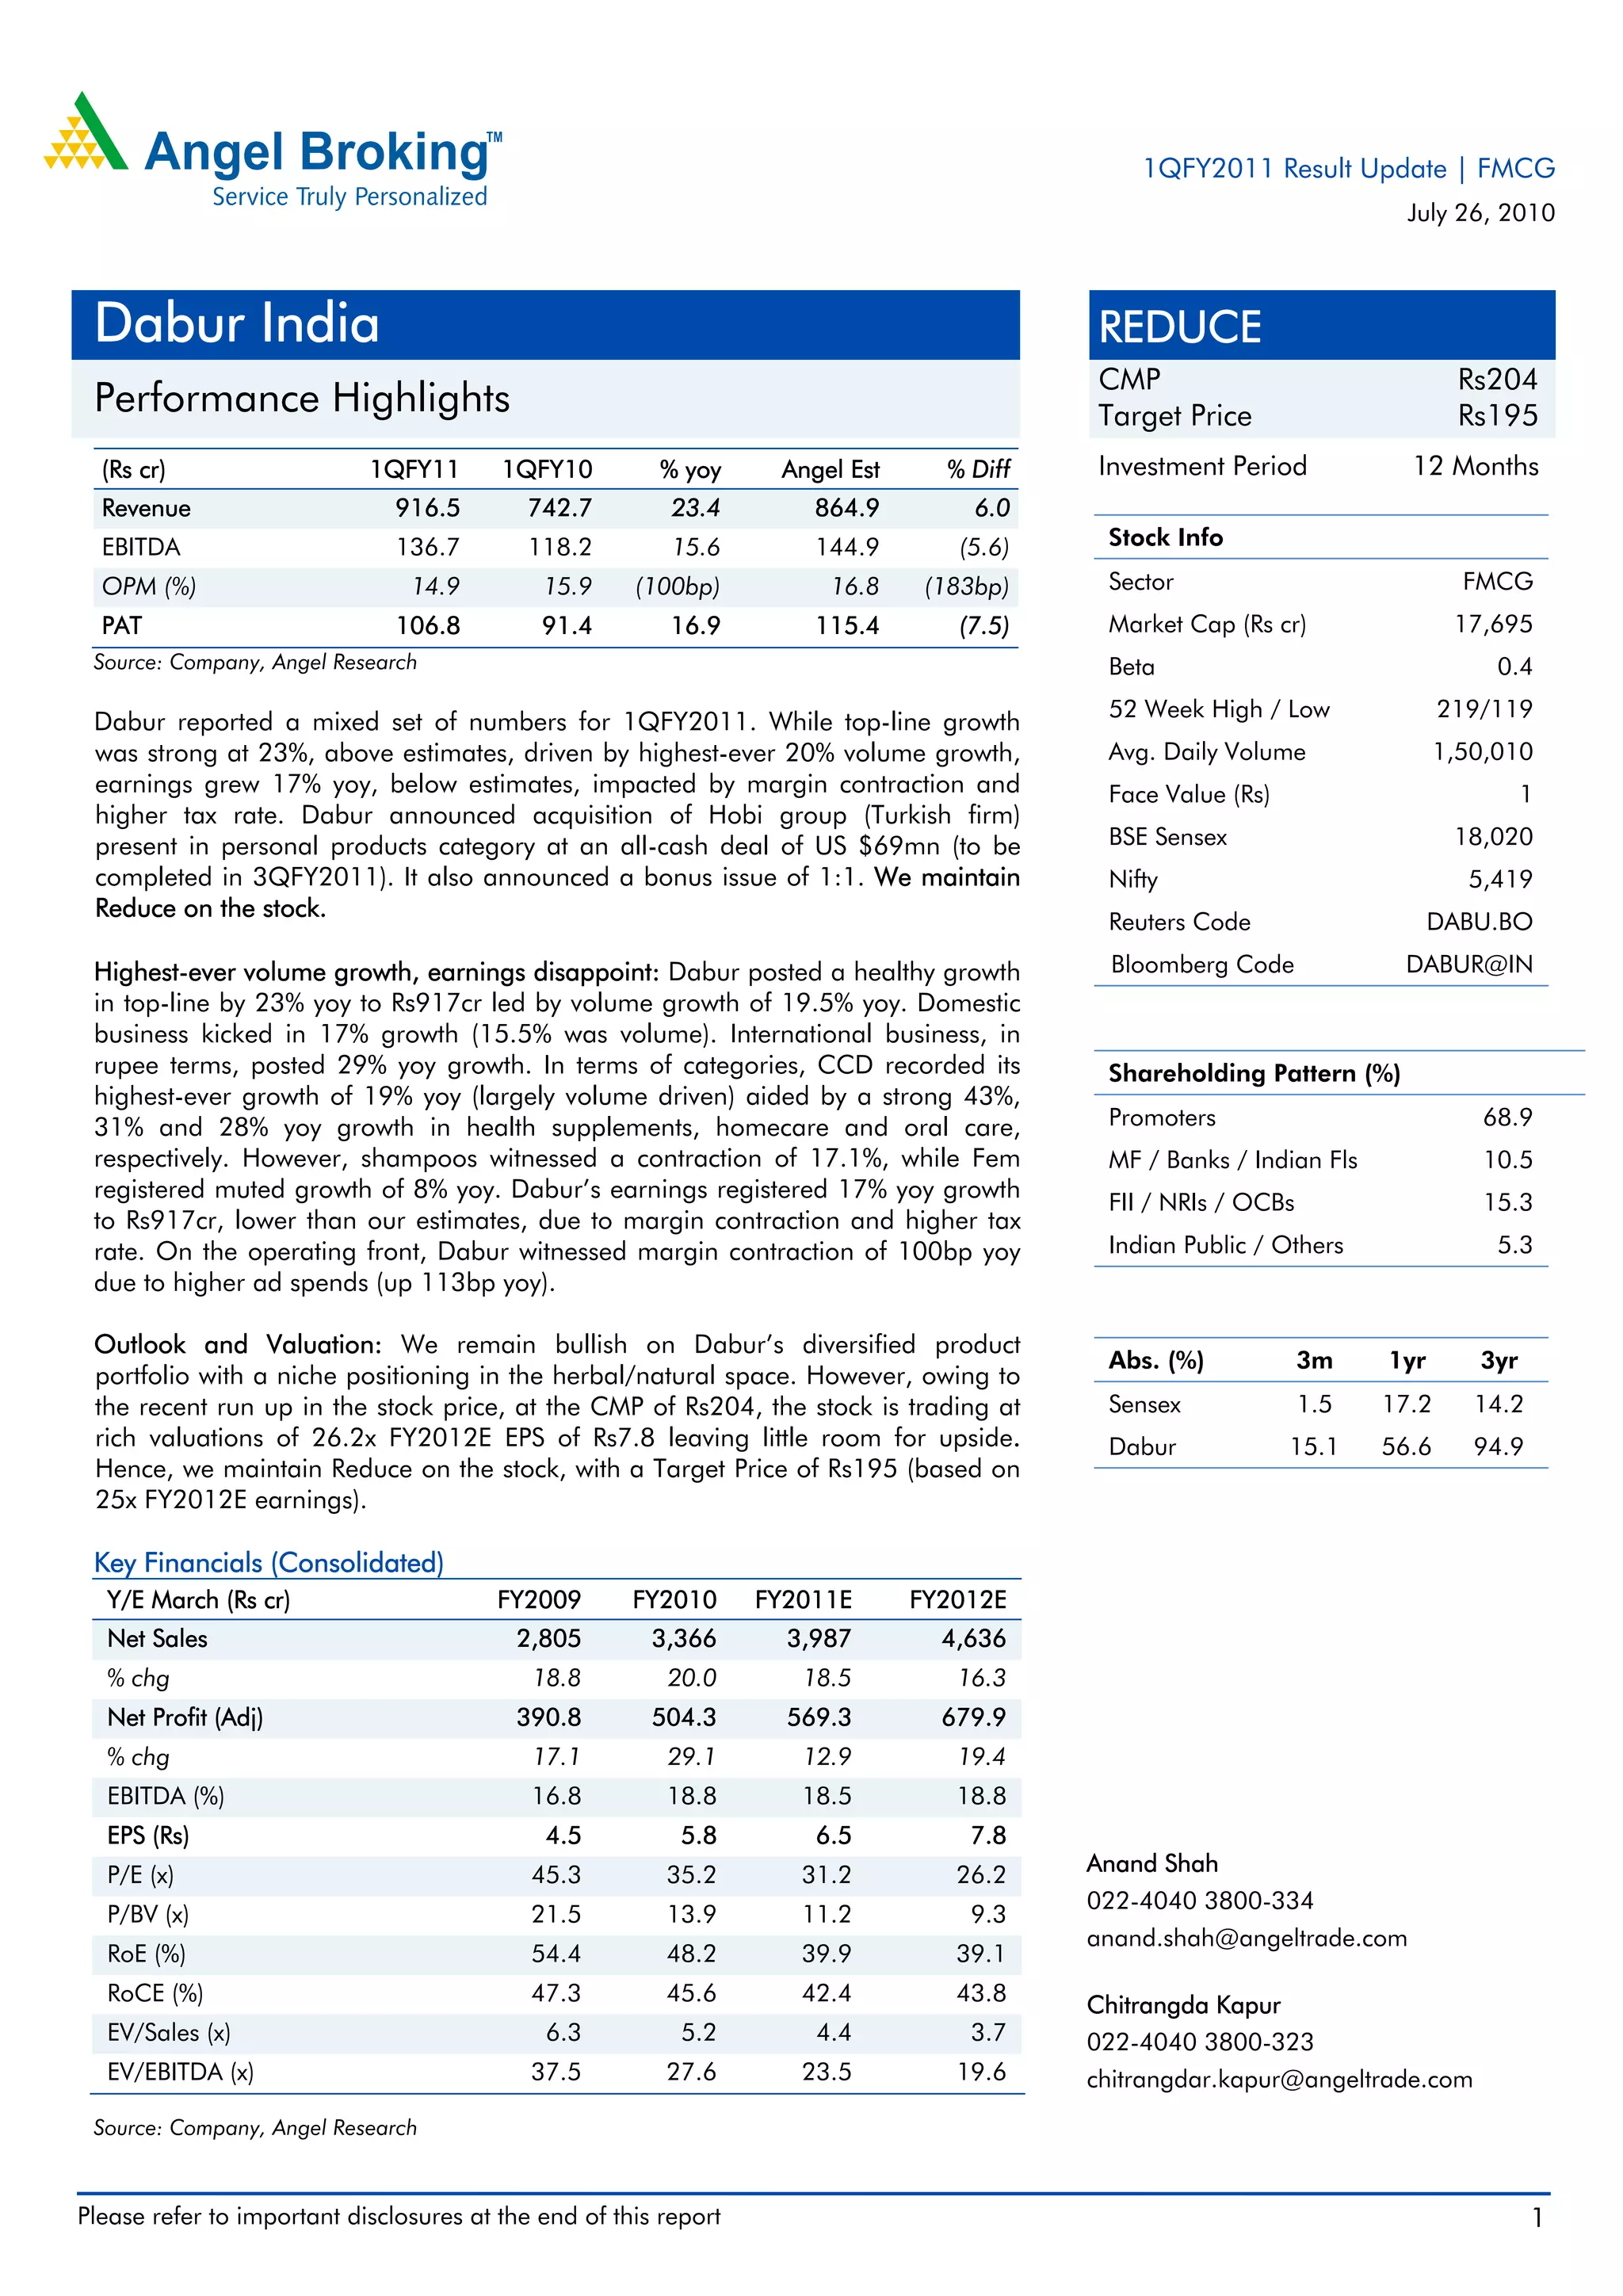
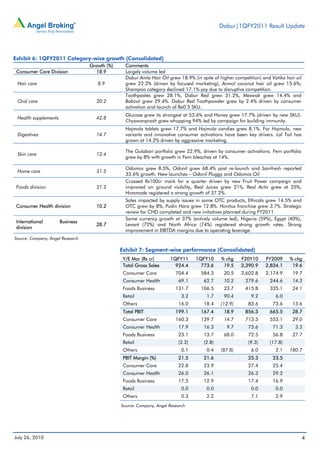

Dabur reported a mixed set of results for the first quarter of fiscal year 2011. While revenue growth was strong at 23% due to a record 20% increase in volume, earnings growth disappointed at 17% due to margin contraction and higher taxes. Revenue was boosted by double-digit growth in consumer care division categories like oral care, health supplements, and home care. However, earnings fell short of estimates due to a rise in advertising spending squeezing margins. The company also announced an acquisition and a bonus share issue.