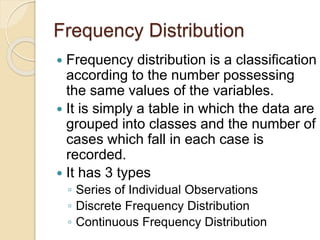
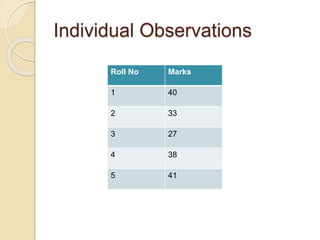
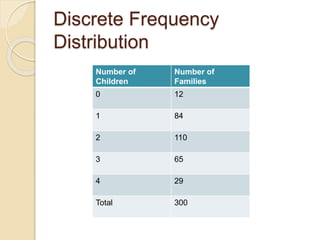
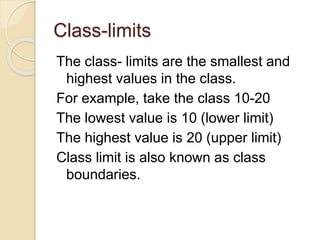
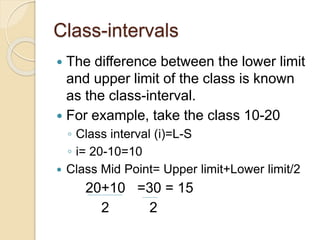
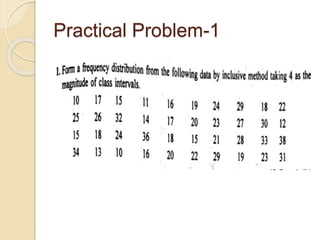
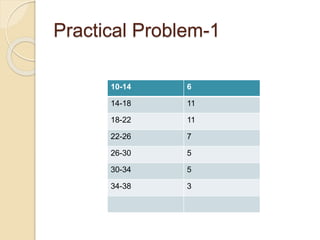
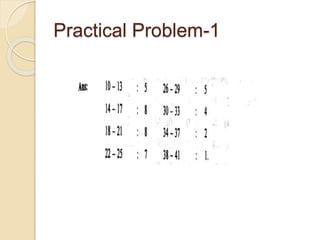
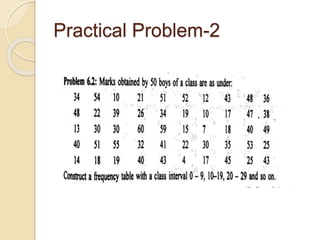
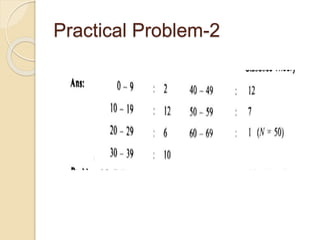
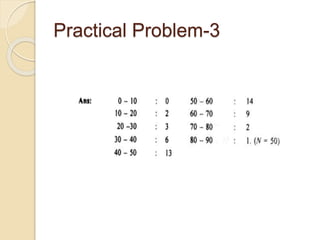
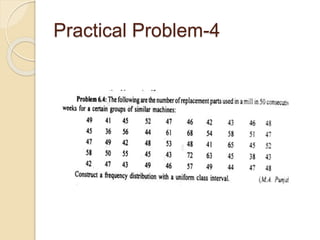
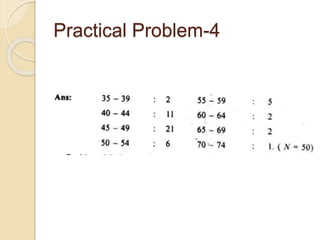
Frequency Distribution of
Data
Mrs.P.RAMALAKSHMI, M.Sc.,
M.Phil.,
Assistant Professor of Food
Processing and Quality Control
V.V.Vanniaperumal College for
Women
Virudhunagar.
Frequency Distribution
 Frequency distribution is a classification
according to the number possessing
the same values of the variables.
 It is simply a table in which the data are
grouped into classes and the number of
cases which fall in each case is
recorded.
 It has 3 types
◦ Series of Individual Observations
◦ Discrete Frequency Distribution
◦ Continuous Frequency Distribution
Individual Observations
Roll No Marks
1 40
2 33
3 27
4 38
5 41
Discrete Frequency
Distribution
Number of
Children
Number of
Families
0 12
1 84
2 110
3 65
4 29
Total 300
Continuous Frequency
Distribution
Marks No of
Students
10-20 15
20-30 20
30-40 10
Total 45
Marks No of
Students
10-19 17
20-29 15
30-39 12
Total 44
Overlapping Method
Non-Overlapping Method
Inclusive Method Exclusive Method
Class-limits
The class- limits are the smallest and
highest values in the class.
For example, take the class 10-20
The lowest value is 10 (lower limit)
The highest value is 20 (upper limit)
Class limit is also known as class
boundaries.
Class-intervals
 The difference between the lower limit
and upper limit of the class is known
as the class-interval.
 For example, take the class 10-20
◦ Class interval (i)=L-S
◦ i= 20-10=10
 Class Mid Point= Upper limit+Lower limit/2
20+10 =30 = 15
2 2
Practical Problem-1
Practical Problem-1
10-14 6
14-18 11
18-22 11
22-26 7
26-30 5
30-34 5
34-38 3
Practical Problem-1
Practical Problem-2
Practical Problem-2
Practical Problem-3
Practical Problem-3
Practical Problem-4
Practical Problem-4
Frequency Distribution of Data

Frequency Distribution of Data