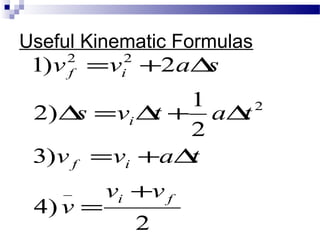
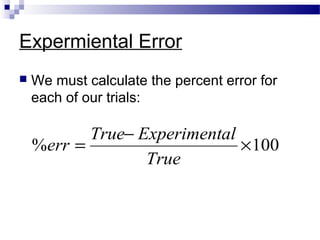
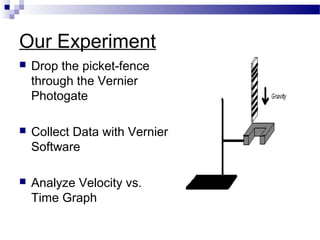
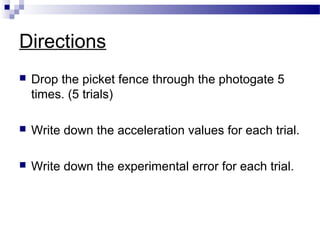
Free-Fall Motion
What happens ?
 1) When you drop a rock from a cliff?
Ans: It falls downward.
 2) When a Skydiver jumps from a plane?
Ans: He/She will fall to the ground.
 3) To a skydiver’s speed as he is falling?
Ans: It will reach a terminal velocity due to
air resistance.
Free-Fall Motion
 An object moving under the influence of
gravity only!!
Our Goal For Today
 1) Perform an experiment to analyze a
free-falling object.
 2) Determine the value of g.
 3) Enable you to solve problems dealing
with free-falling objects.
Properties of Motion
 1) Displacement
 2) Velocity
 3) Acceleration
Displacement
 Displacement: the distance and direction
travelled.
 Alex Rodriguez hits a home run. What is
his total displacement around the bases?
 Ans: 0!!!
Velocity
 Velocity:
A Home-Run takes about 3.5 sec to clear Shea’s
center wall (420 ft.) What is the velocity of the
ball?
Ans:
- For every second, the ball travels 120 ft.
→
=
∆
∆
=
−−
−−
v
t
s
timeinchange
ntdisplacemeinchange
sft
ss
ftft
velocity /120
05.3
0420
=
−
−
=
Acceleration
 Average Acceleration:
A car does 0-85 m/s in 6.4 seconds. What the average
acceleration for this interval of time?
Ans:
*For every second, the velocity increases by
13.28
→
=
∆
∆
=
−−
−−
a
t
v
timeinchange
velocityinchange
2
/28.13
04.6
/0/85
sm
ss
smsm
a =
−
−
=
→
Vector & Scalar Quantities
 A vector quantity has size and direction
EX: Displacement, Velocity, Acceleration
 A scalar quantity has only size and no direction
EX: Distance,Speed
Useful Kinematic Formulas
2
)4
)3
2
1
)2
2)1
_
2
22
fi
if
i
if
vv
v
tavv
tatvs
savv
+
=
∆+=
∆+∆=∆
∆+=
The Velocity vs. Time Graph
 Pictorial representation of velocity vs. time
graph. As time increases, the
velocity increases in this
graph.
The Slope of this graph
gives us the acceleration
of this object.
Do You Understand It?
 Can you Describe the motion of this
object? It’s Acceleration?
 Ans : Zero Acceleration, Constant Velocity
Experimental Error
 What if our values do not match g?
 Remember question regarding terminal velocity
2
/81.9 smg =
Expermiental Error
 We must calculate the percent error for
each of our trials:
100% ×
−
=
True
alExperimentTrue
err
Our Experiment
 Drop the picket-fence
through the Vernier
Photogate
 Collect Data with Vernier
Software
 Analyze Velocity vs.
Time Graph
Directions
 Drop the picket fence through the photogate 5
times. (5 trials)
 Write down the acceleration values for each trial.
 Write down the experimental error for each trial.

Free fall PHYSICS IGCSE FORM 3 MRSM

  • 1.
  • 2.
    What happens ? 1) When you drop a rock from a cliff? Ans: It falls downward.  2) When a Skydiver jumps from a plane? Ans: He/She will fall to the ground.  3) To a skydiver’s speed as he is falling? Ans: It will reach a terminal velocity due to air resistance.
  • 3.
    Free-Fall Motion  Anobject moving under the influence of gravity only!!
  • 4.
    Our Goal ForToday  1) Perform an experiment to analyze a free-falling object.  2) Determine the value of g.  3) Enable you to solve problems dealing with free-falling objects.
  • 5.
    Properties of Motion 1) Displacement  2) Velocity  3) Acceleration
  • 6.
    Displacement  Displacement: thedistance and direction travelled.  Alex Rodriguez hits a home run. What is his total displacement around the bases?  Ans: 0!!!
  • 7.
    Velocity  Velocity: A Home-Runtakes about 3.5 sec to clear Shea’s center wall (420 ft.) What is the velocity of the ball? Ans: - For every second, the ball travels 120 ft. → = ∆ ∆ = −− −− v t s timeinchange ntdisplacemeinchange sft ss ftft velocity /120 05.3 0420 = − − =
  • 8.
    Acceleration  Average Acceleration: Acar does 0-85 m/s in 6.4 seconds. What the average acceleration for this interval of time? Ans: *For every second, the velocity increases by 13.28 → = ∆ ∆ = −− −− a t v timeinchange velocityinchange 2 /28.13 04.6 /0/85 sm ss smsm a = − − = →
  • 9.
    Vector & ScalarQuantities  A vector quantity has size and direction EX: Displacement, Velocity, Acceleration  A scalar quantity has only size and no direction EX: Distance,Speed
  • 10.
  • 11.
    The Velocity vs.Time Graph  Pictorial representation of velocity vs. time graph. As time increases, the velocity increases in this graph. The Slope of this graph gives us the acceleration of this object.
  • 12.
    Do You UnderstandIt?  Can you Describe the motion of this object? It’s Acceleration?  Ans : Zero Acceleration, Constant Velocity
  • 13.
    Experimental Error  Whatif our values do not match g?  Remember question regarding terminal velocity 2 /81.9 smg =
  • 14.
    Expermiental Error  Wemust calculate the percent error for each of our trials: 100% × − = True alExperimentTrue err
  • 15.
    Our Experiment  Dropthe picket-fence through the Vernier Photogate  Collect Data with Vernier Software  Analyze Velocity vs. Time Graph
  • 16.
    Directions  Drop thepicket fence through the photogate 5 times. (5 trials)  Write down the acceleration values for each trial.  Write down the experimental error for each trial.