Downloaded 114 times

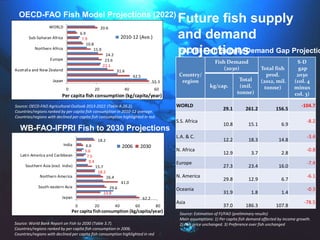
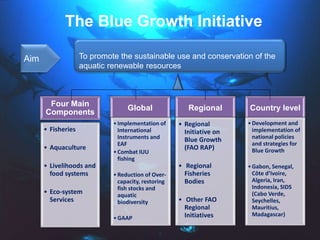
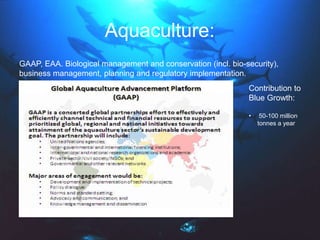
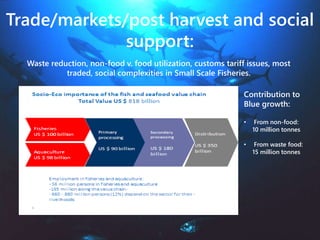
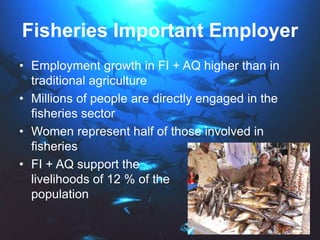
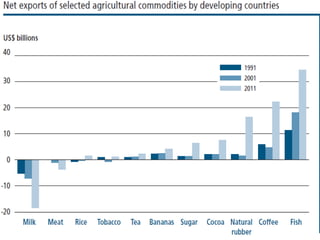


The presentation highlights the essential role of fish in human nutrition, detailing its high micronutrient content and significance as a protein source for over 3 billion people, especially in developing countries. It discusses future fish supply and demand projections, indicating a significant gap in production needed to meet increasing demand by 2030, and outlines the Blue Growth Initiative aimed at promoting sustainable fisheries and aquaculture. The document emphasizes the economic and employment contributions of fisheries, as well as challenges such as environmental degradation and illegal fishing.


