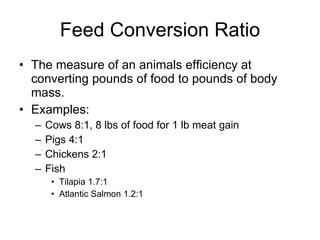
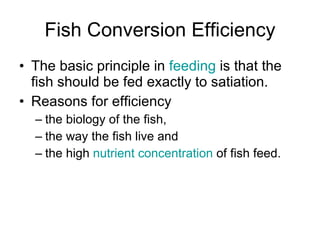
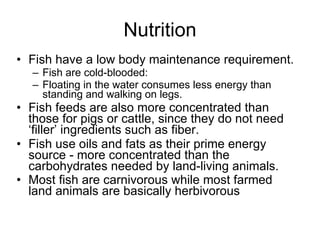
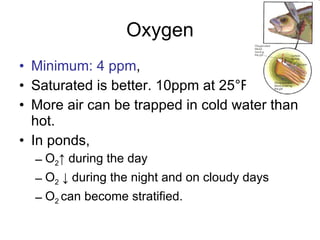
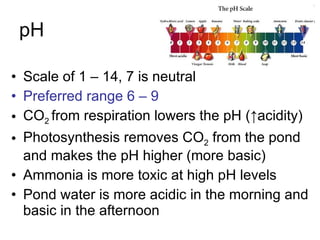
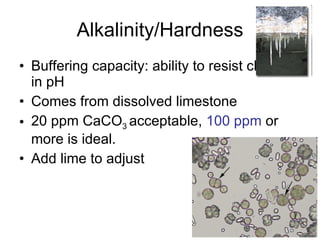
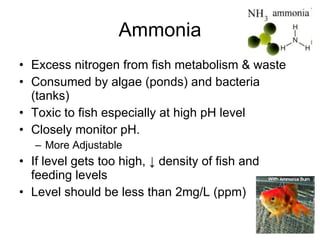
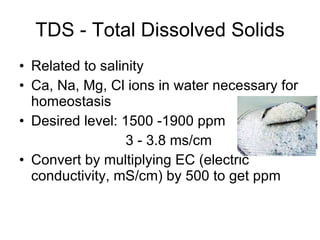
Aquaculture Nutrition
Feed Conversion Ratio The measure of an animals efficiency at converting pounds of food to pounds of body mass. Examples: Cows 8:1, 8 lbs of food for 1 lb meat gain Pigs 4:1 Chickens 2:1 Fish  Tilapia 1.7:1 Atlantic Salmon 1.2:1
Fish Conversion Efficiency The basic principle in  feeding  is that the fish should be fed exactly to satiation. Reasons for efficiency the biology of the fish,  the way the fish live and  the high  nutrient   concentration  of fish feed.
Nutrition Fish have a low body maintenance requirement.  Fish are cold-blooded:  Floating in the water consumes less energy than standing and walking on legs. Fish feeds are also more concentrated than those for pigs or cattle, since they do not need ‘filler’ ingredients such as fiber.  Fish use oils and fats as their prime energy source - more concentrated than the carbohydrates needed by land-living animals. Most fish are carnivorous while most farmed land animals are basically herbivorous
Nutrition Protein Balanced mix of amino acids builds muscle Fat Provides dense energy for metabolism Oxidizes rapidly – becomes rancid Carbohydrate Fish can only digest simple sugars Vitamins & Minerals Included in mixed rations
Food Storage Keep cool – slows oxidation Keep dry – prevent mold growth Mold produce mycotoxins Keep covered
Water quality elements Oxygen Temperature Sunlight pH Alkalinity Hardness Ammonia Nitrite
Oxygen Minimum: 4 ppm ,  Saturated is better. 10ppm at 25 °F More air can be trapped in cold water than hot. In ponds,  O 2 ↑ during the day O 2  ↓ during the night and on cloudy days O 2  can become stratified.
pH Scale of 1 – 14, 7 is neutral Preferred range 6 – 9 CO 2  from respiration lowers the pH ( ↑acidity) Photosynthesis removes C O 2  from the pond and makes the pH higher (more basic) Ammonia is more toxic at high pH levels Pond water is more acidic in the morning and basic in the afternoon
Alkalinity/Hardness Buffering capacity: ability to resist changes in pH Comes from dissolved limestone 20 ppm CaCO 3  acceptable,  100 ppm  or more is ideal. Add lime to adjust
Ammonia Excess nitrogen from fish metabolism & waste Consumed by algae (ponds) and bacteria (tanks) Toxic to fish especially at high pH level Closely monitor pH. More Adjustable If level gets too high,  ↓ density of fish and feeding levels Level should be less than 2mg/L (ppm)
Salinity Salinity – measure of salt in water in ppt (multiply by 1000 for ppm) Our aquaculture tanks are ~ 1.5 ppt Fresh water is less than 0.5 Brackish water is 0.5 to 17 (Estuaries) Ocean water averages 35
TDS - Total Dissolved Solids Related to salinity Ca, Na, Mg, Cl ions in water necessary for homeostasis Desired level: 1500 -1900 ppm   3 - 3.8 ms/cm Convert by multiplying EC (electric conductivity, mS/cm) by 500 to get ppm
Today Water tests Tomorrow –  Aquaculture quiz  Start shop safety

Fish Nutrition

  • 1.
  • 2.
    Feed Conversion RatioThe measure of an animals efficiency at converting pounds of food to pounds of body mass. Examples: Cows 8:1, 8 lbs of food for 1 lb meat gain Pigs 4:1 Chickens 2:1 Fish Tilapia 1.7:1 Atlantic Salmon 1.2:1
  • 3.
    Fish Conversion EfficiencyThe basic principle in feeding is that the fish should be fed exactly to satiation. Reasons for efficiency the biology of the fish, the way the fish live and the high nutrient concentration of fish feed.
  • 4.
    Nutrition Fish havea low body maintenance requirement. Fish are cold-blooded: Floating in the water consumes less energy than standing and walking on legs. Fish feeds are also more concentrated than those for pigs or cattle, since they do not need ‘filler’ ingredients such as fiber. Fish use oils and fats as their prime energy source - more concentrated than the carbohydrates needed by land-living animals. Most fish are carnivorous while most farmed land animals are basically herbivorous
  • 5.
    Nutrition Protein Balancedmix of amino acids builds muscle Fat Provides dense energy for metabolism Oxidizes rapidly – becomes rancid Carbohydrate Fish can only digest simple sugars Vitamins & Minerals Included in mixed rations
  • 6.
    Food Storage Keepcool – slows oxidation Keep dry – prevent mold growth Mold produce mycotoxins Keep covered
  • 7.
    Water quality elementsOxygen Temperature Sunlight pH Alkalinity Hardness Ammonia Nitrite
  • 8.
    Oxygen Minimum: 4ppm , Saturated is better. 10ppm at 25 °F More air can be trapped in cold water than hot. In ponds, O 2 ↑ during the day O 2 ↓ during the night and on cloudy days O 2 can become stratified.
  • 9.
    pH Scale of1 – 14, 7 is neutral Preferred range 6 – 9 CO 2 from respiration lowers the pH ( ↑acidity) Photosynthesis removes C O 2 from the pond and makes the pH higher (more basic) Ammonia is more toxic at high pH levels Pond water is more acidic in the morning and basic in the afternoon
  • 10.
    Alkalinity/Hardness Buffering capacity:ability to resist changes in pH Comes from dissolved limestone 20 ppm CaCO 3 acceptable, 100 ppm or more is ideal. Add lime to adjust
  • 11.
    Ammonia Excess nitrogenfrom fish metabolism & waste Consumed by algae (ponds) and bacteria (tanks) Toxic to fish especially at high pH level Closely monitor pH. More Adjustable If level gets too high, ↓ density of fish and feeding levels Level should be less than 2mg/L (ppm)
  • 12.
    Salinity Salinity –measure of salt in water in ppt (multiply by 1000 for ppm) Our aquaculture tanks are ~ 1.5 ppt Fresh water is less than 0.5 Brackish water is 0.5 to 17 (Estuaries) Ocean water averages 35
  • 13.
    TDS - TotalDissolved Solids Related to salinity Ca, Na, Mg, Cl ions in water necessary for homeostasis Desired level: 1500 -1900 ppm 3 - 3.8 ms/cm Convert by multiplying EC (electric conductivity, mS/cm) by 500 to get ppm
  • 14.
    Today Water testsTomorrow – Aquaculture quiz Start shop safety