Downloaded 97 times
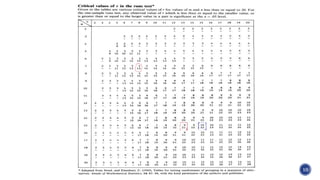
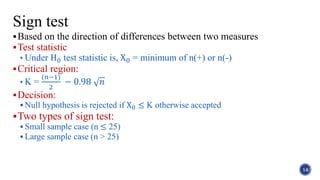
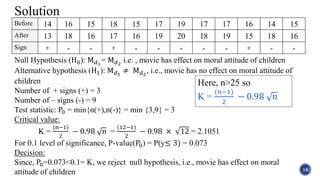
![Example: A study was designed to determine the effect if a certain movie on
the moral attitude of young children. The data below represents a rating from 0
to 20 on a moral attitude to high morality. Carry out the test hypothesis that
movie had no effect on moral attitude of children against it had using sign test
at level 0.1. [T.U 2069]
15
Before 14 16 15 18 15 17 19 17 17 16 14 15
After 13 18 16 17 16 19 20 18 19 15 18 16](https://image.slidesharecdn.com/8thpsgrouppresentation-180109095101/85/Statistics-Non-parametric-test-15-320.jpg)
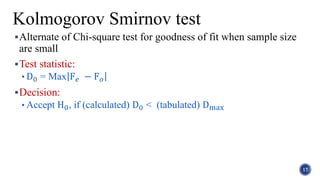
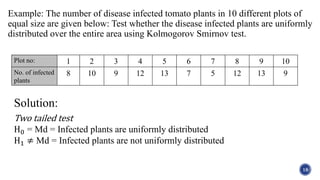
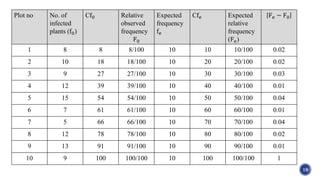
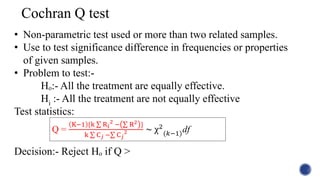
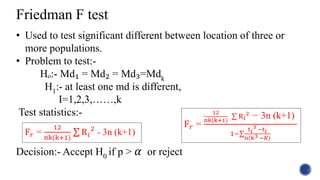


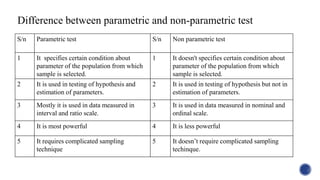
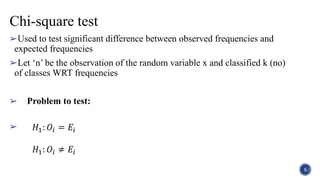
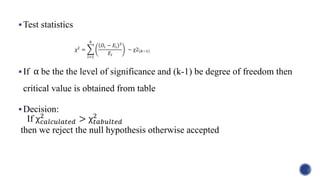
The document discusses parametric and non-parametric statistical tests. It defines parametric tests as those that make assumptions about the population distribution, such as assuming a normal distribution. Non-parametric tests make fewer assumptions. Specific tests covered include the chi-square test, run test, sign test, Kolmogorov-Smirnov test, Cochran Q test, and Friedman F test. Examples are provided for several of the tests.