Downloaded 527 times

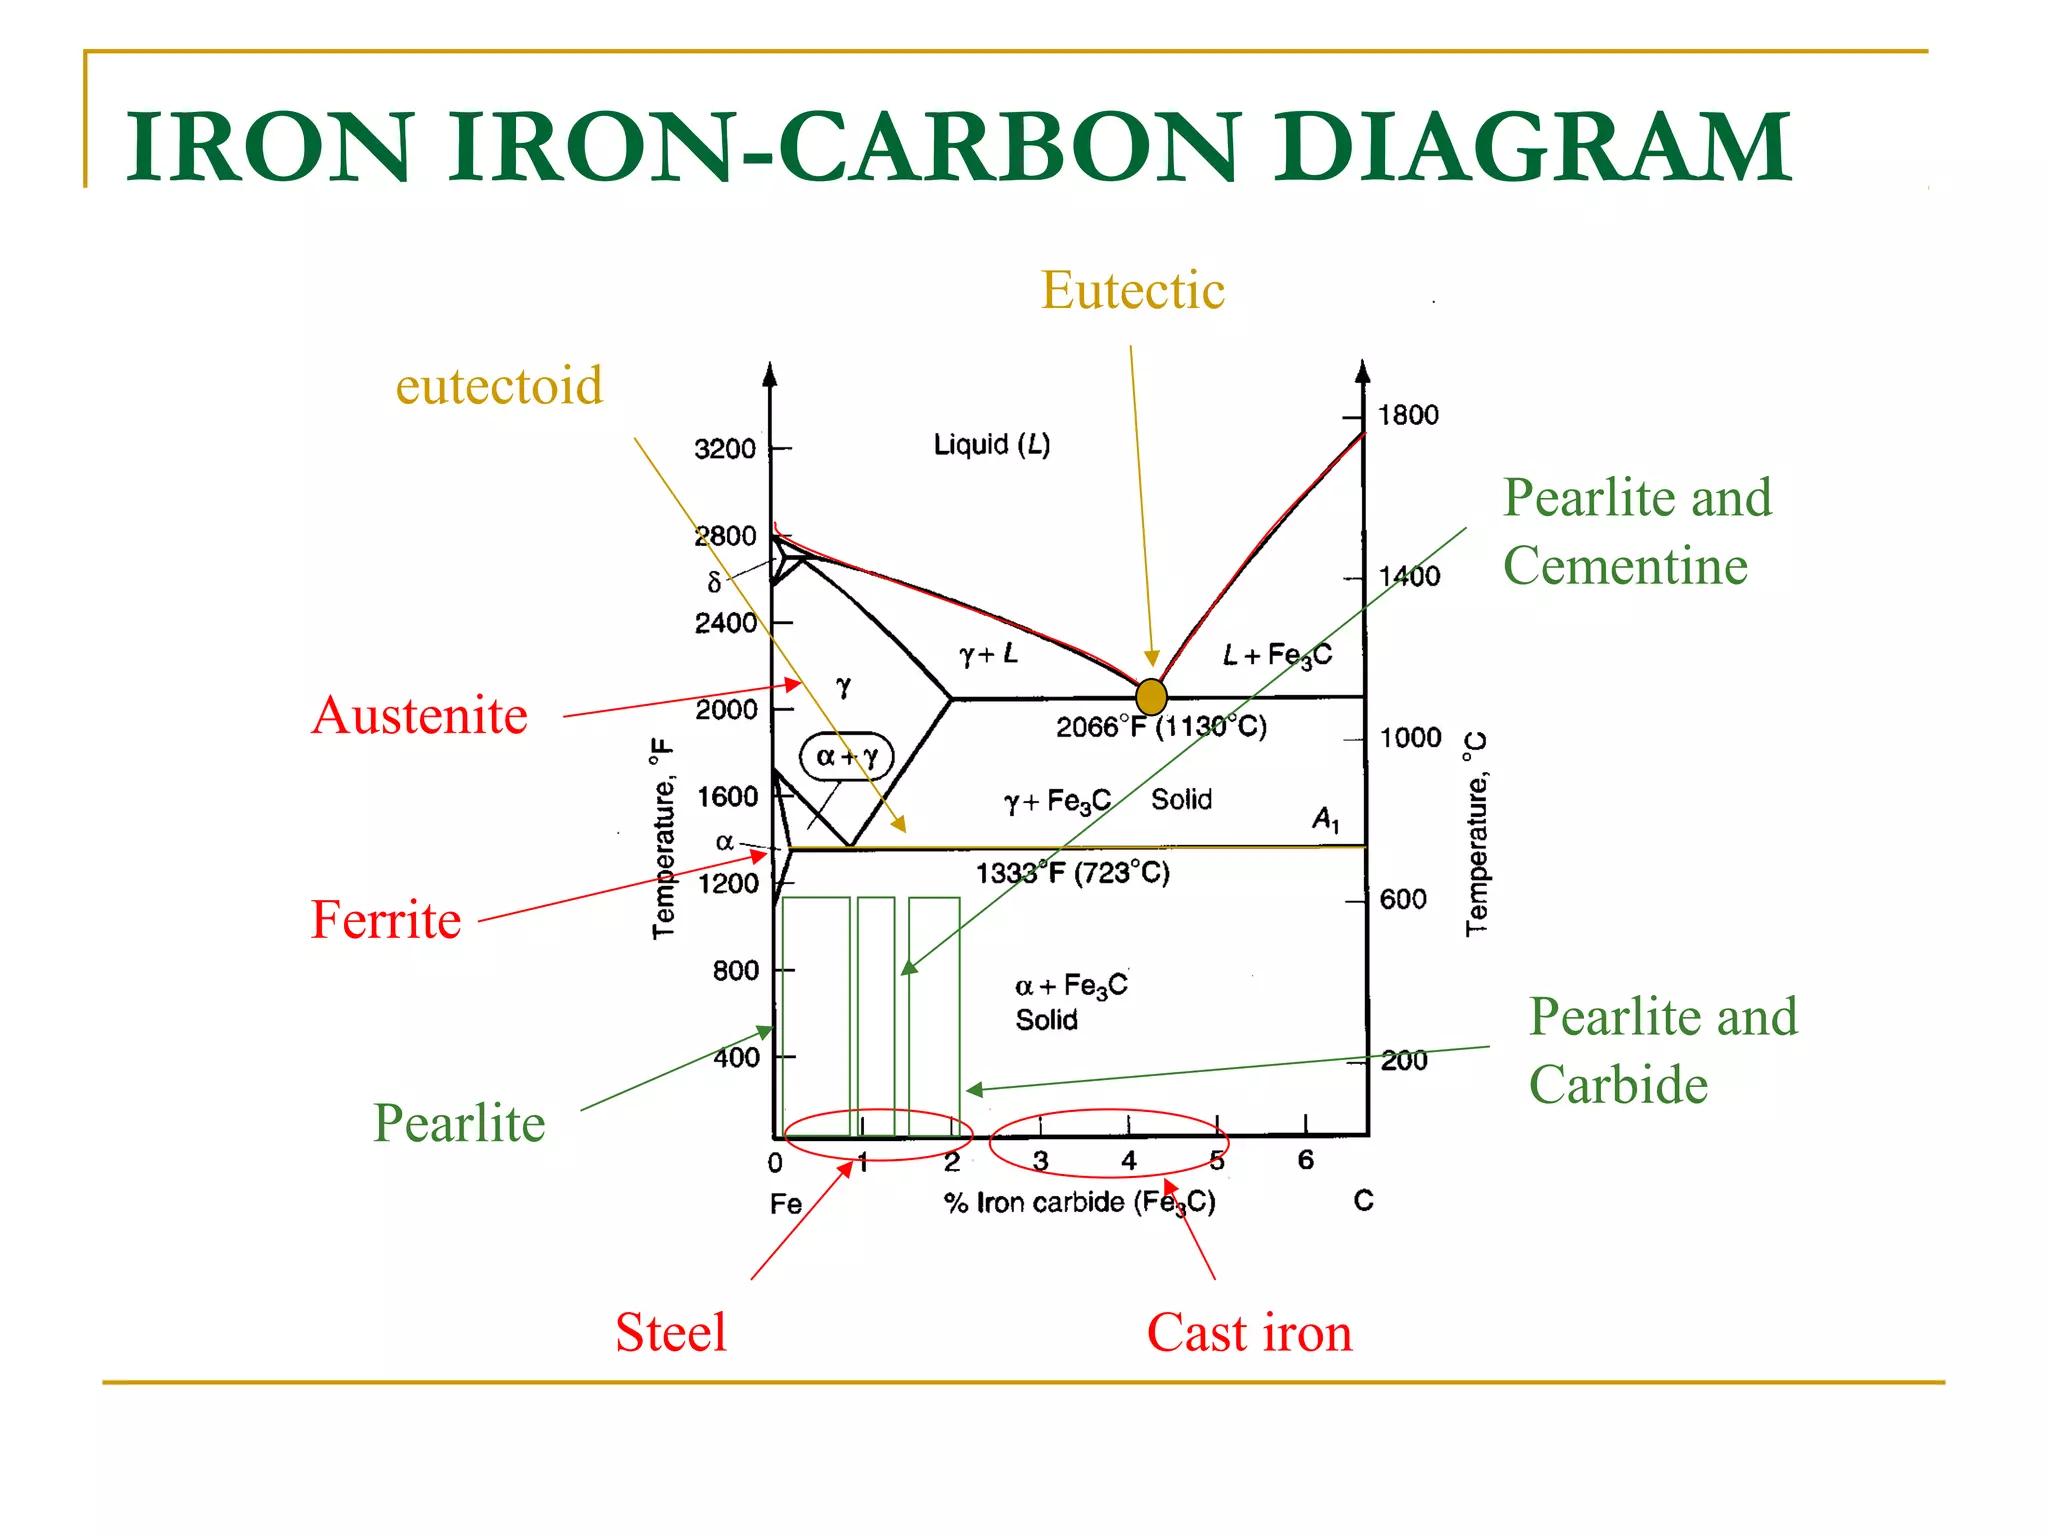


The document provides information about the iron-iron carbide phase diagram, including: 1) It shows the different phases that appear on the diagram (austenite, ferrite, pearlite, cementite, etc.) and the transformations between them like the eutectic and eutectoid reactions. 2) It explains how the microstructure of steels and cast irons depends on the cooling process and carbon content, resulting in structures like pearlite, ferrite, or cementite. 3) It describes how alloying elements can change the eutectoid composition and temperature, allowing the properties of steels to be tailored for different applications.