Download as PDF, PPTX


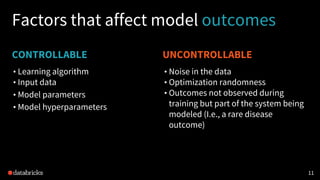
, r.getAs[Double]("label"))))
Dataframe of
(prediction,
label)](https://image.slidesharecdn.com/experimentaldesignfordistributedmachinelearning-171030230847/85/Experimental-Design-for-Distributed-Machine-Learning-with-Myles-Baker-18-320.jpg)
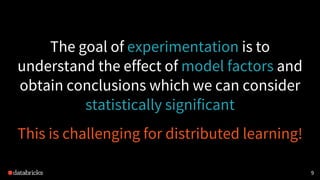
, r.getAs[Double]("label"))))
Dataframe of
(prediction,
label)
Usually not a
robust metric
by itself](https://image.slidesharecdn.com/experimentaldesignfordistributedmachinelearning-171030230847/85/Experimental-Design-for-Distributed-Machine-Learning-with-Myles-Baker-20-320.jpg)
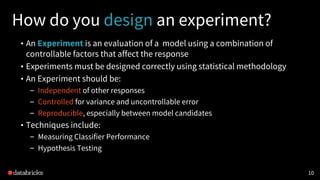
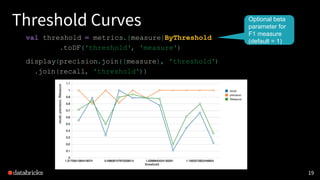
![2121
Confusion Matrix
metrics.confusionMatrix
.toArray
//Display using non-Scala tool
%python
confusion = np.array([[...],[...]])](https://image.slidesharecdn.com/experimentaldesignfordistributedmachinelearning-171030230847/85/Experimental-Design-for-Distributed-Machine-Learning-with-Myles-Baker-21-320.jpg)
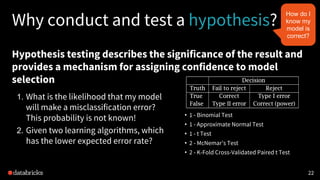

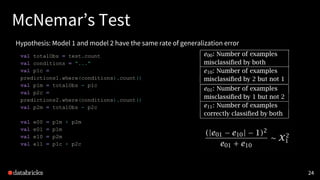
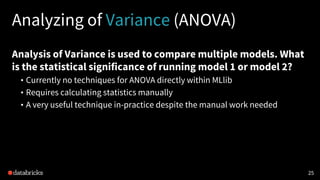


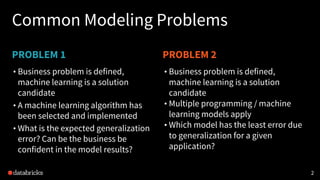
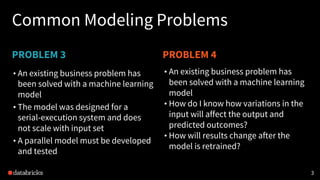
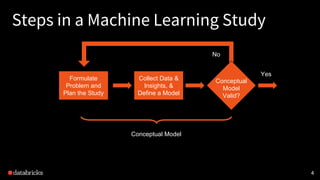
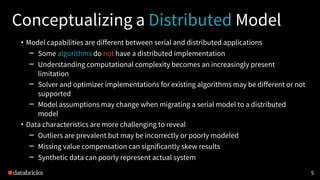
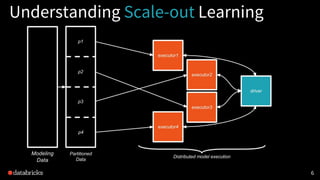
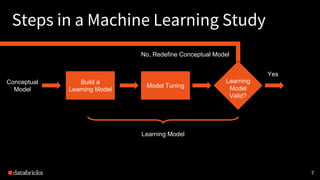
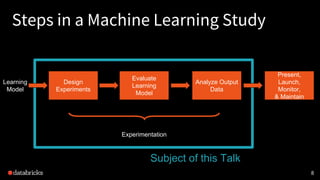
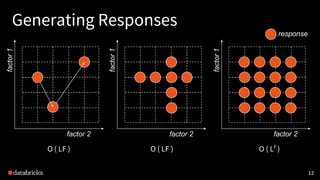
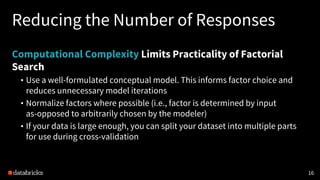
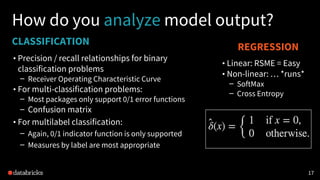
This document discusses experimental design for distributed machine learning models. It outlines common problems in machine learning modeling like selecting the best algorithm and evaluating a model's expected generalization error. It describes steps in a machine learning study like collecting data, building models, and designing experiments. The goal of experimentation is to understand how model factors affect outcomes and obtain statistically significant conclusions. Techniques discussed for analyzing distributed model outputs include precision-recall curves, confusion matrices, and hypothesis testing methods like the chi-squared test and McNemar's test. The document emphasizes that experimental design for distributed learning poses new challenges around data characteristics, computational complexity, and reproducing results across models.