Download as PDF, PPTX


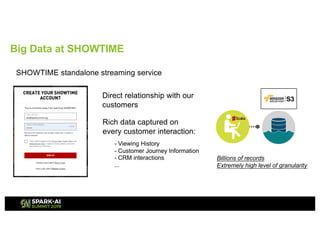
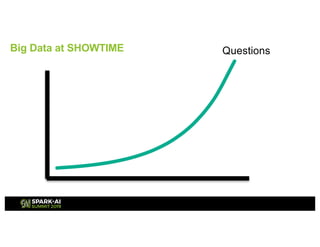

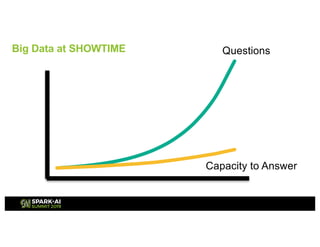
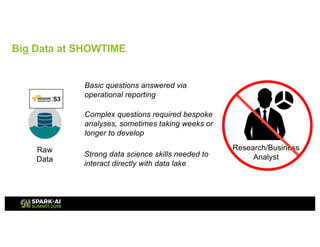
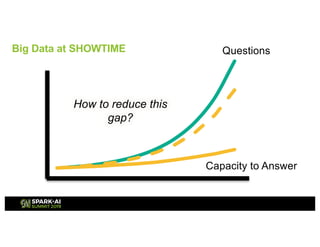
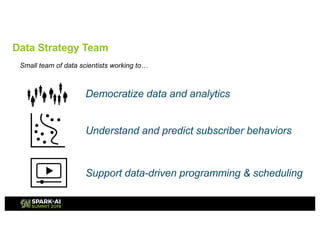
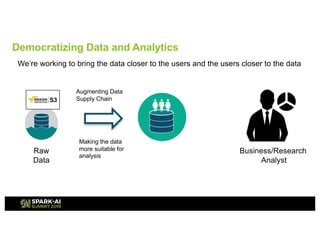
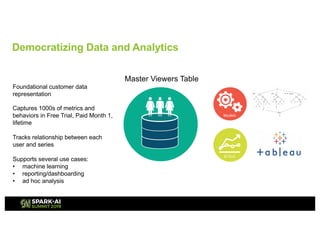


Showtime Networks Inc. leverages big data through its standalone streaming service to understand subscriber behaviors and optimize content offerings, employing data science techniques and machine learning models. A small team of data scientists enhances data accessibility and quality by using tools like Apache Spark, Airflow, and Delta for efficient data management. Their efforts aim to improve subscriber retention, reduce churn, and ultimately drive revenue growth through data-driven decision-making.