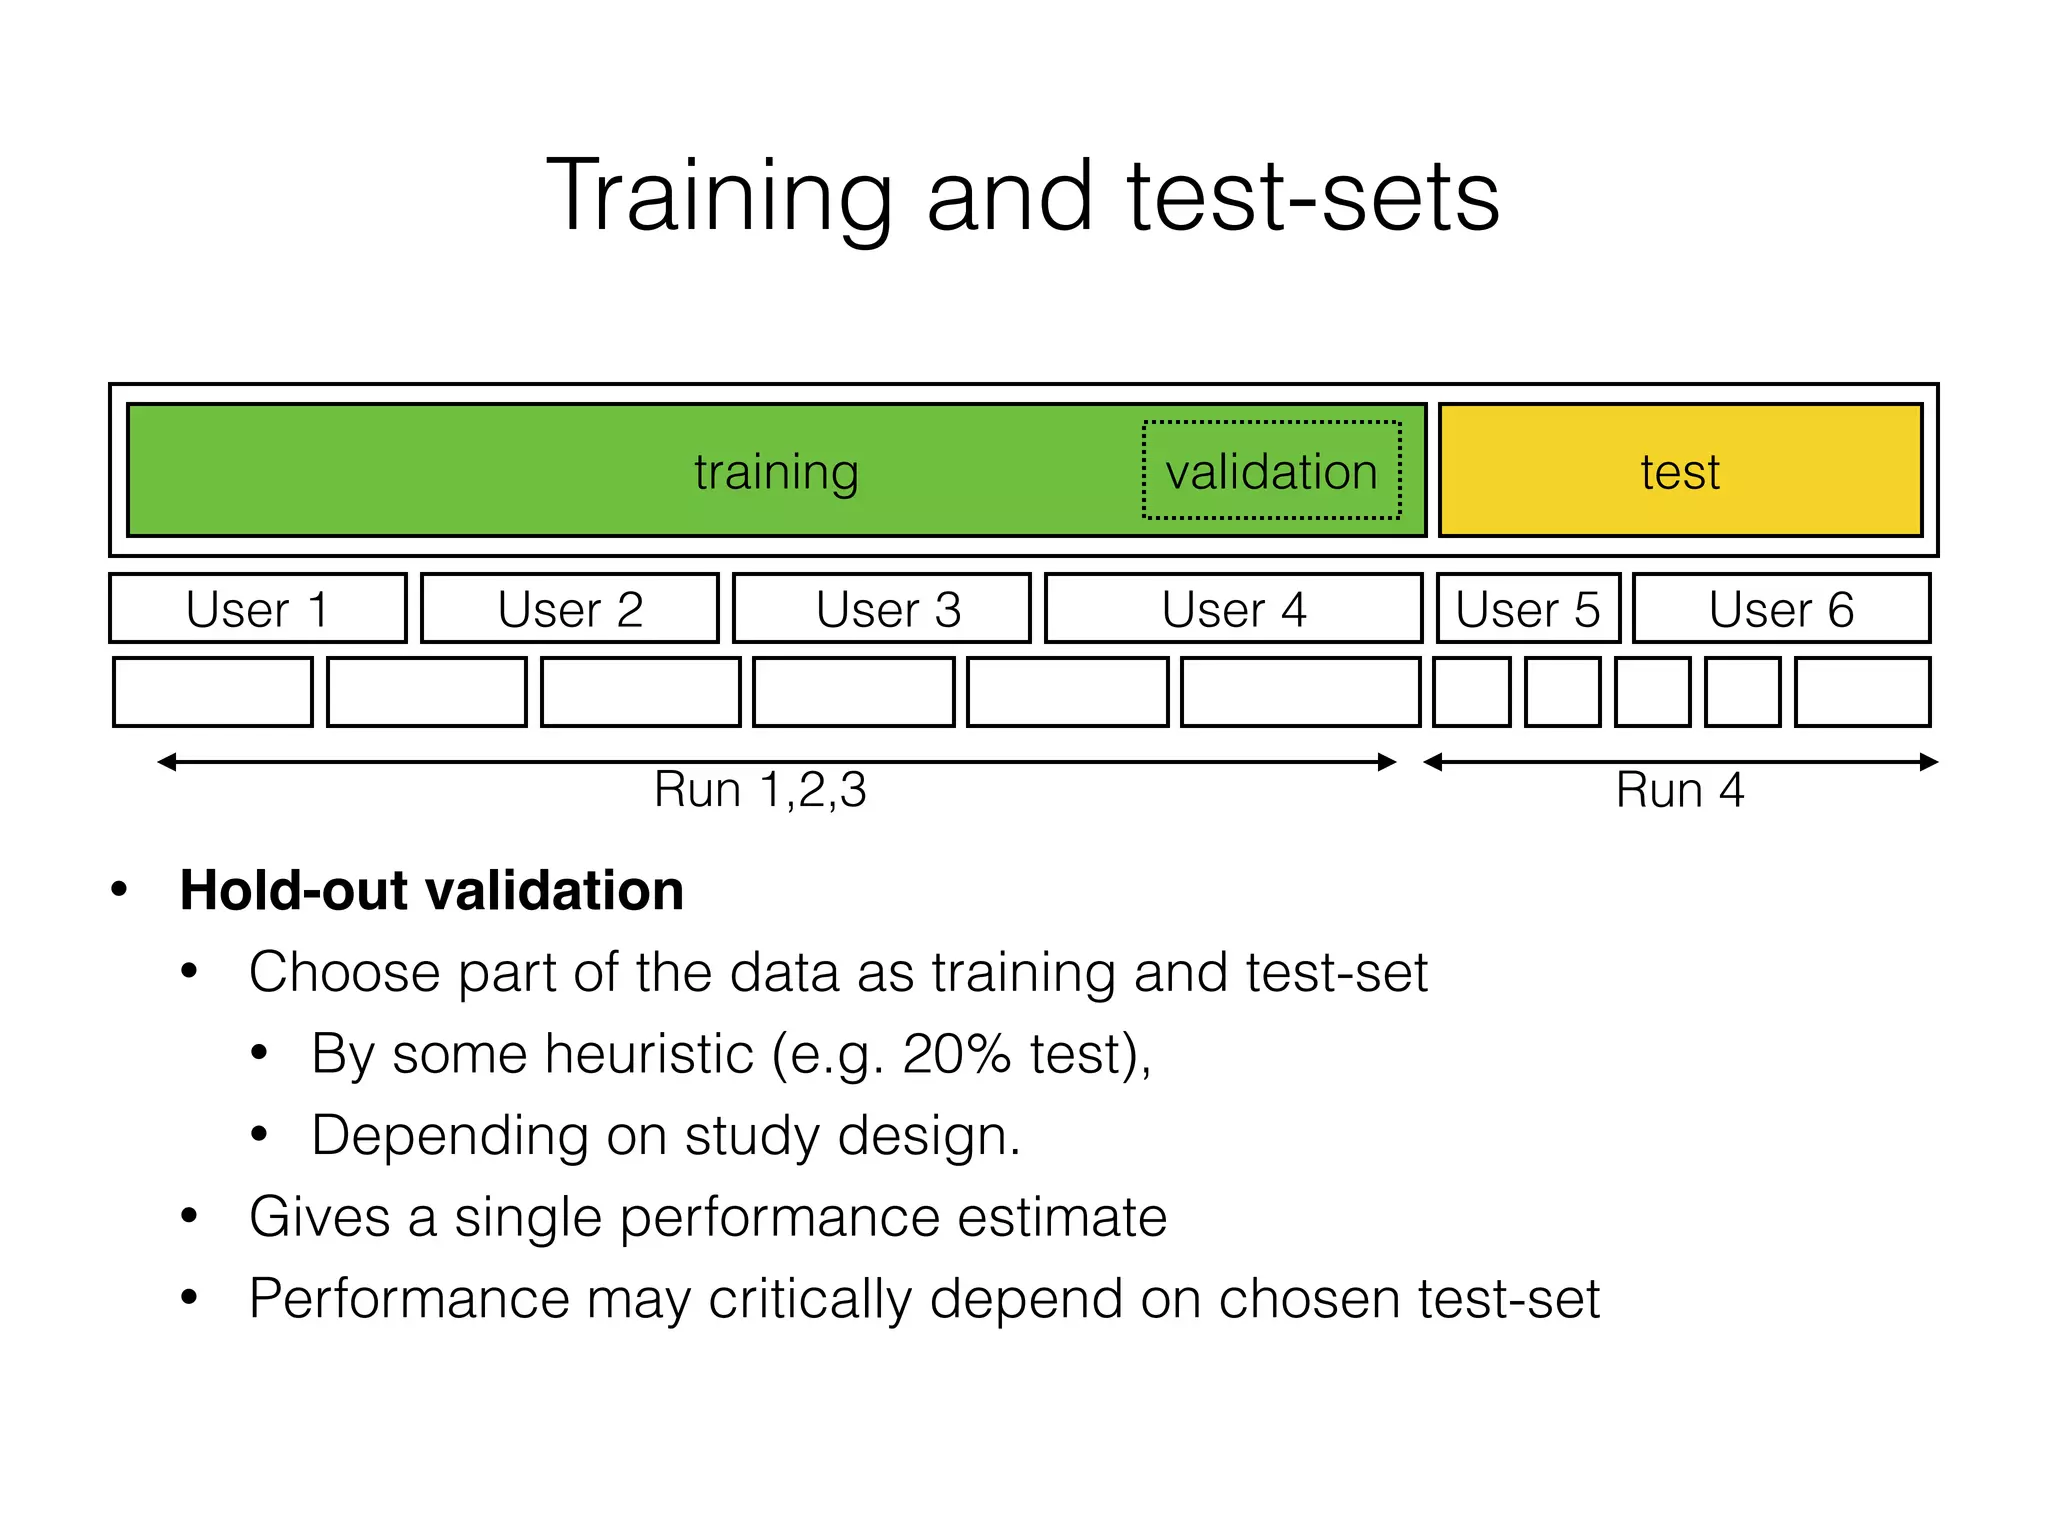
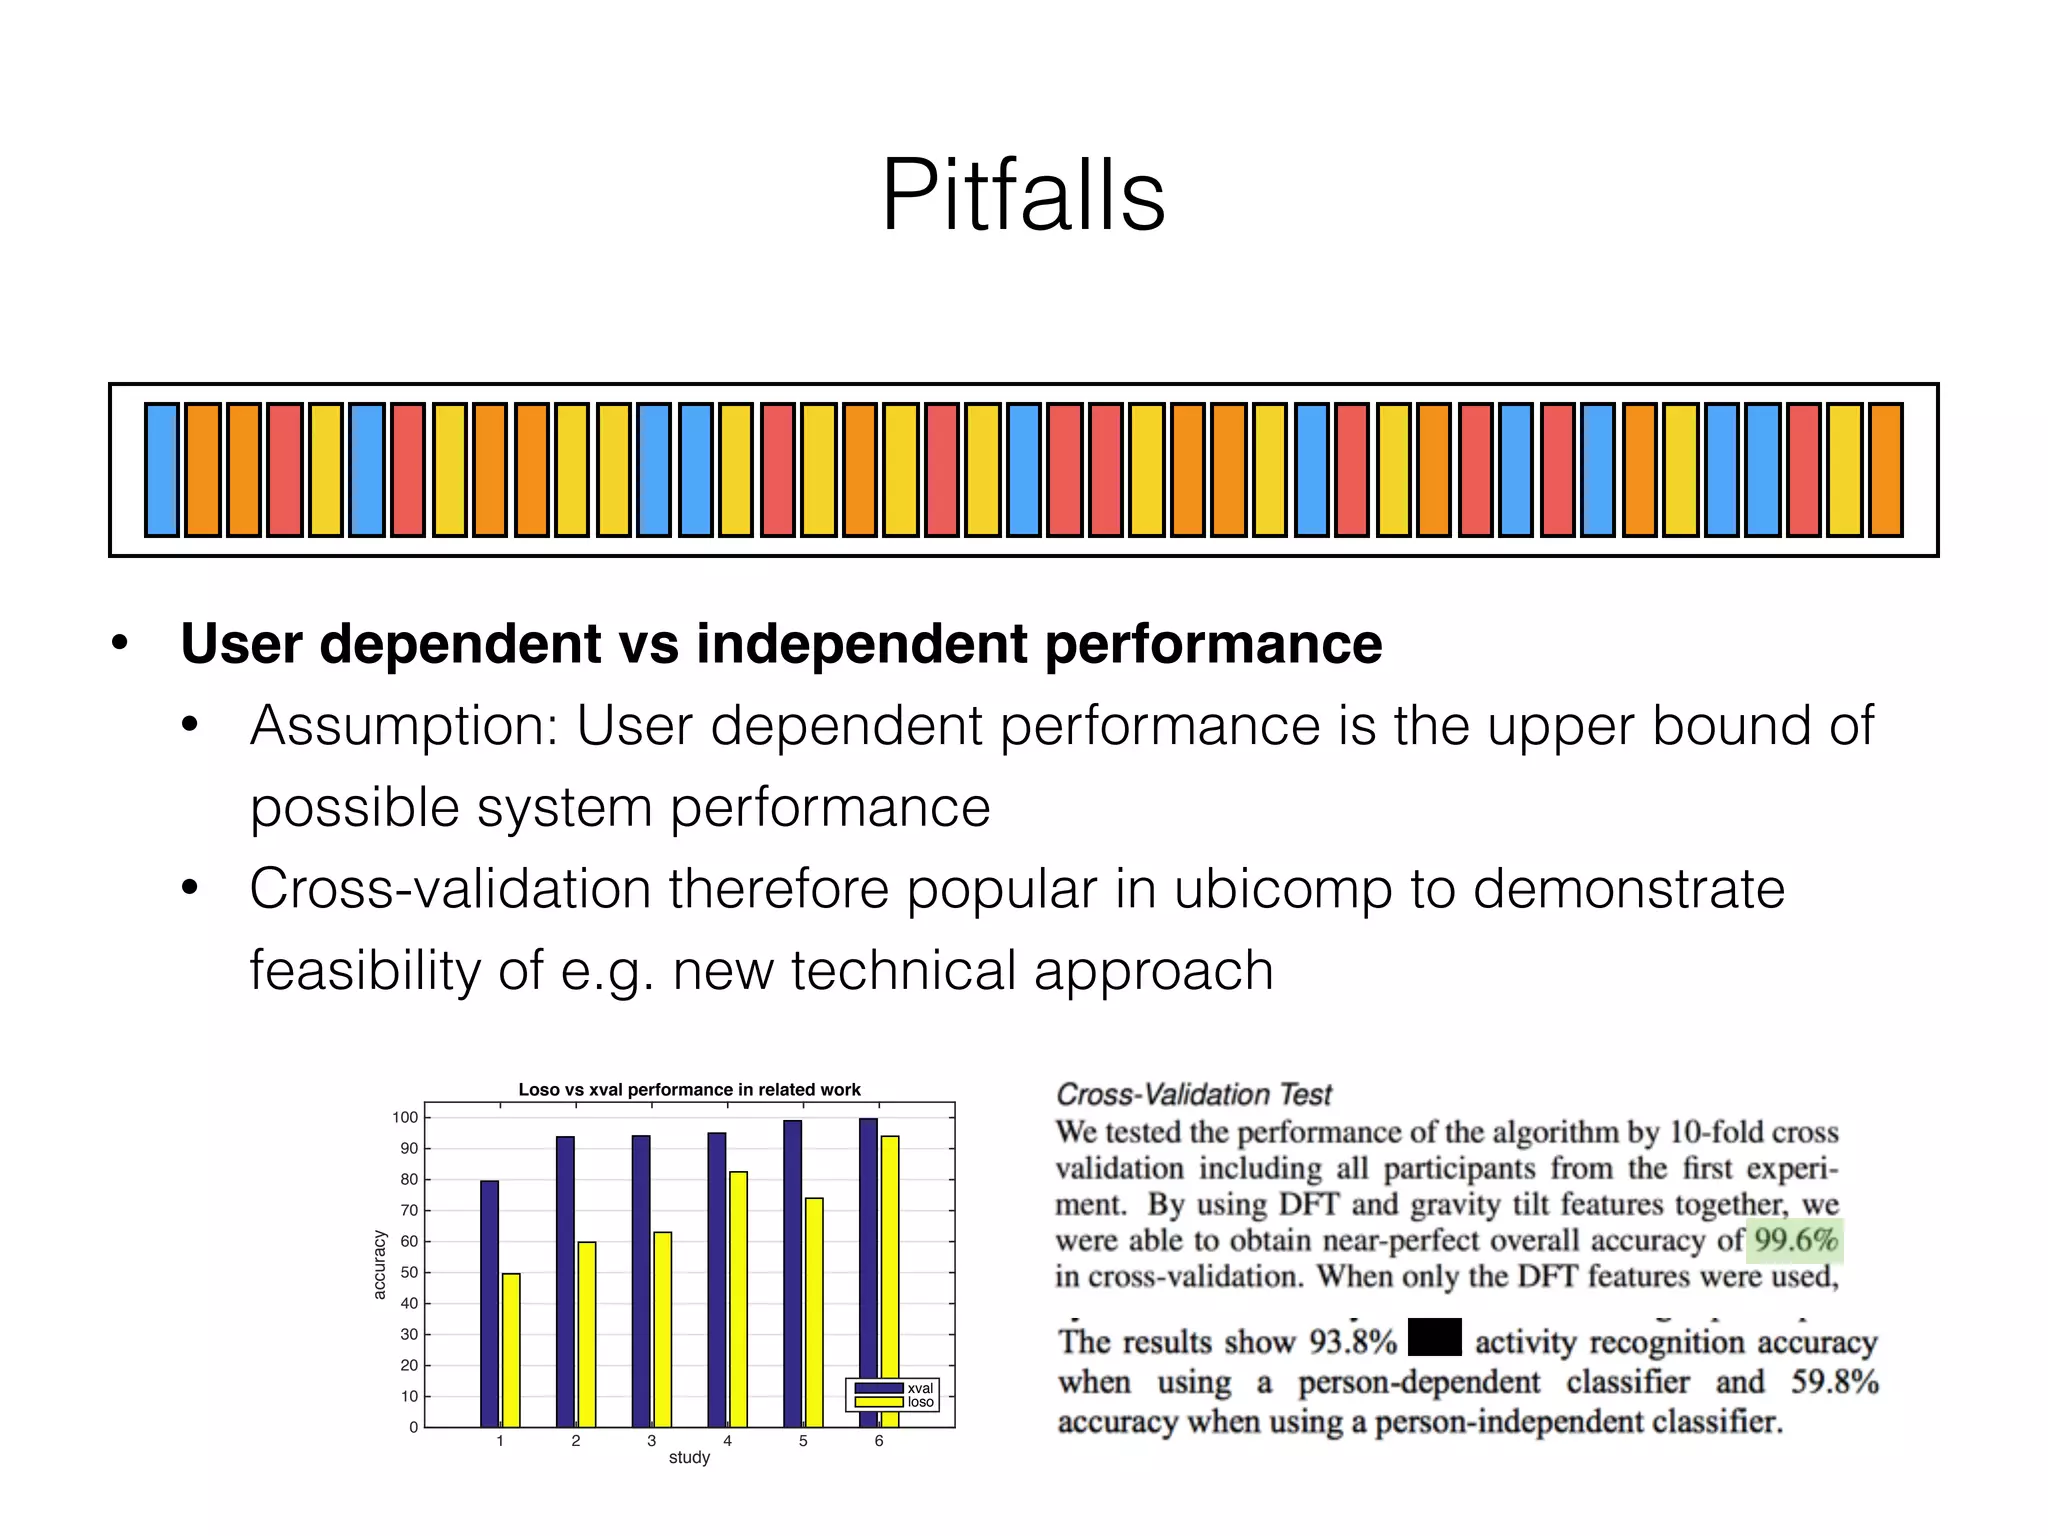
The document discusses evaluation methods in ubiquitous computing, focusing on training and test strategies, including hold-out validation and cross-validation. It highlights challenges in performance estimation, particularly in user-dependent versus user-independent scenarios, and emphasizes the importance of appropriate performance metrics. The summary also notes that different applications require different evaluation metrics, and suggests tailored scoring systems for continuous recognition tasks to accurately reflect performance.
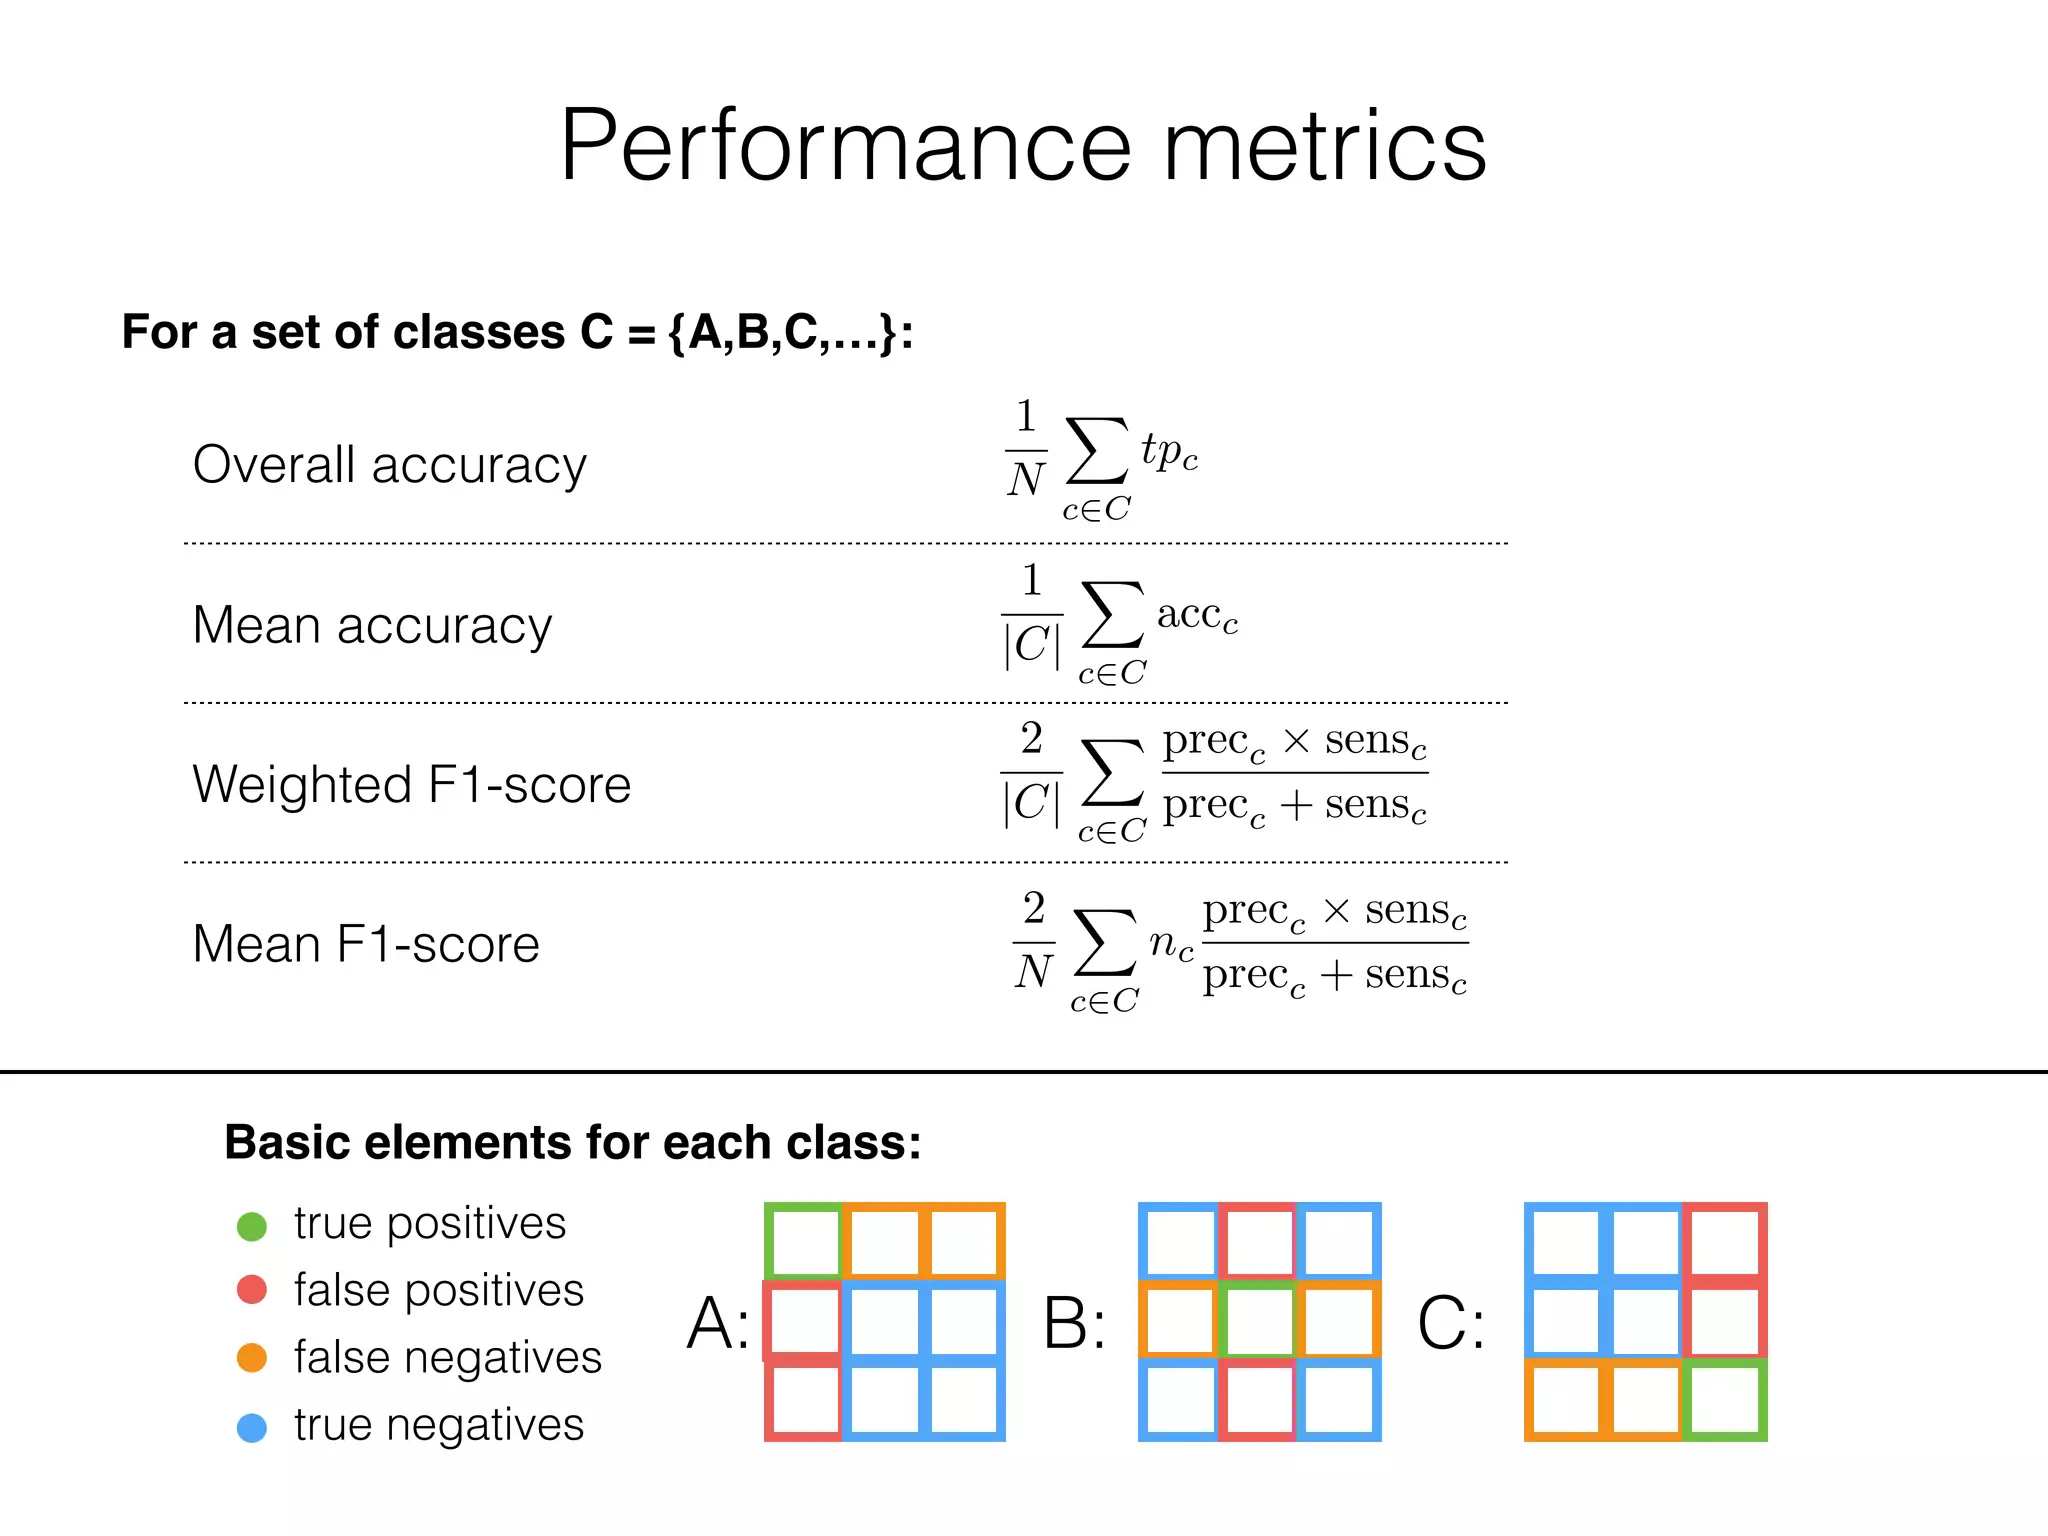
![Performance metrics
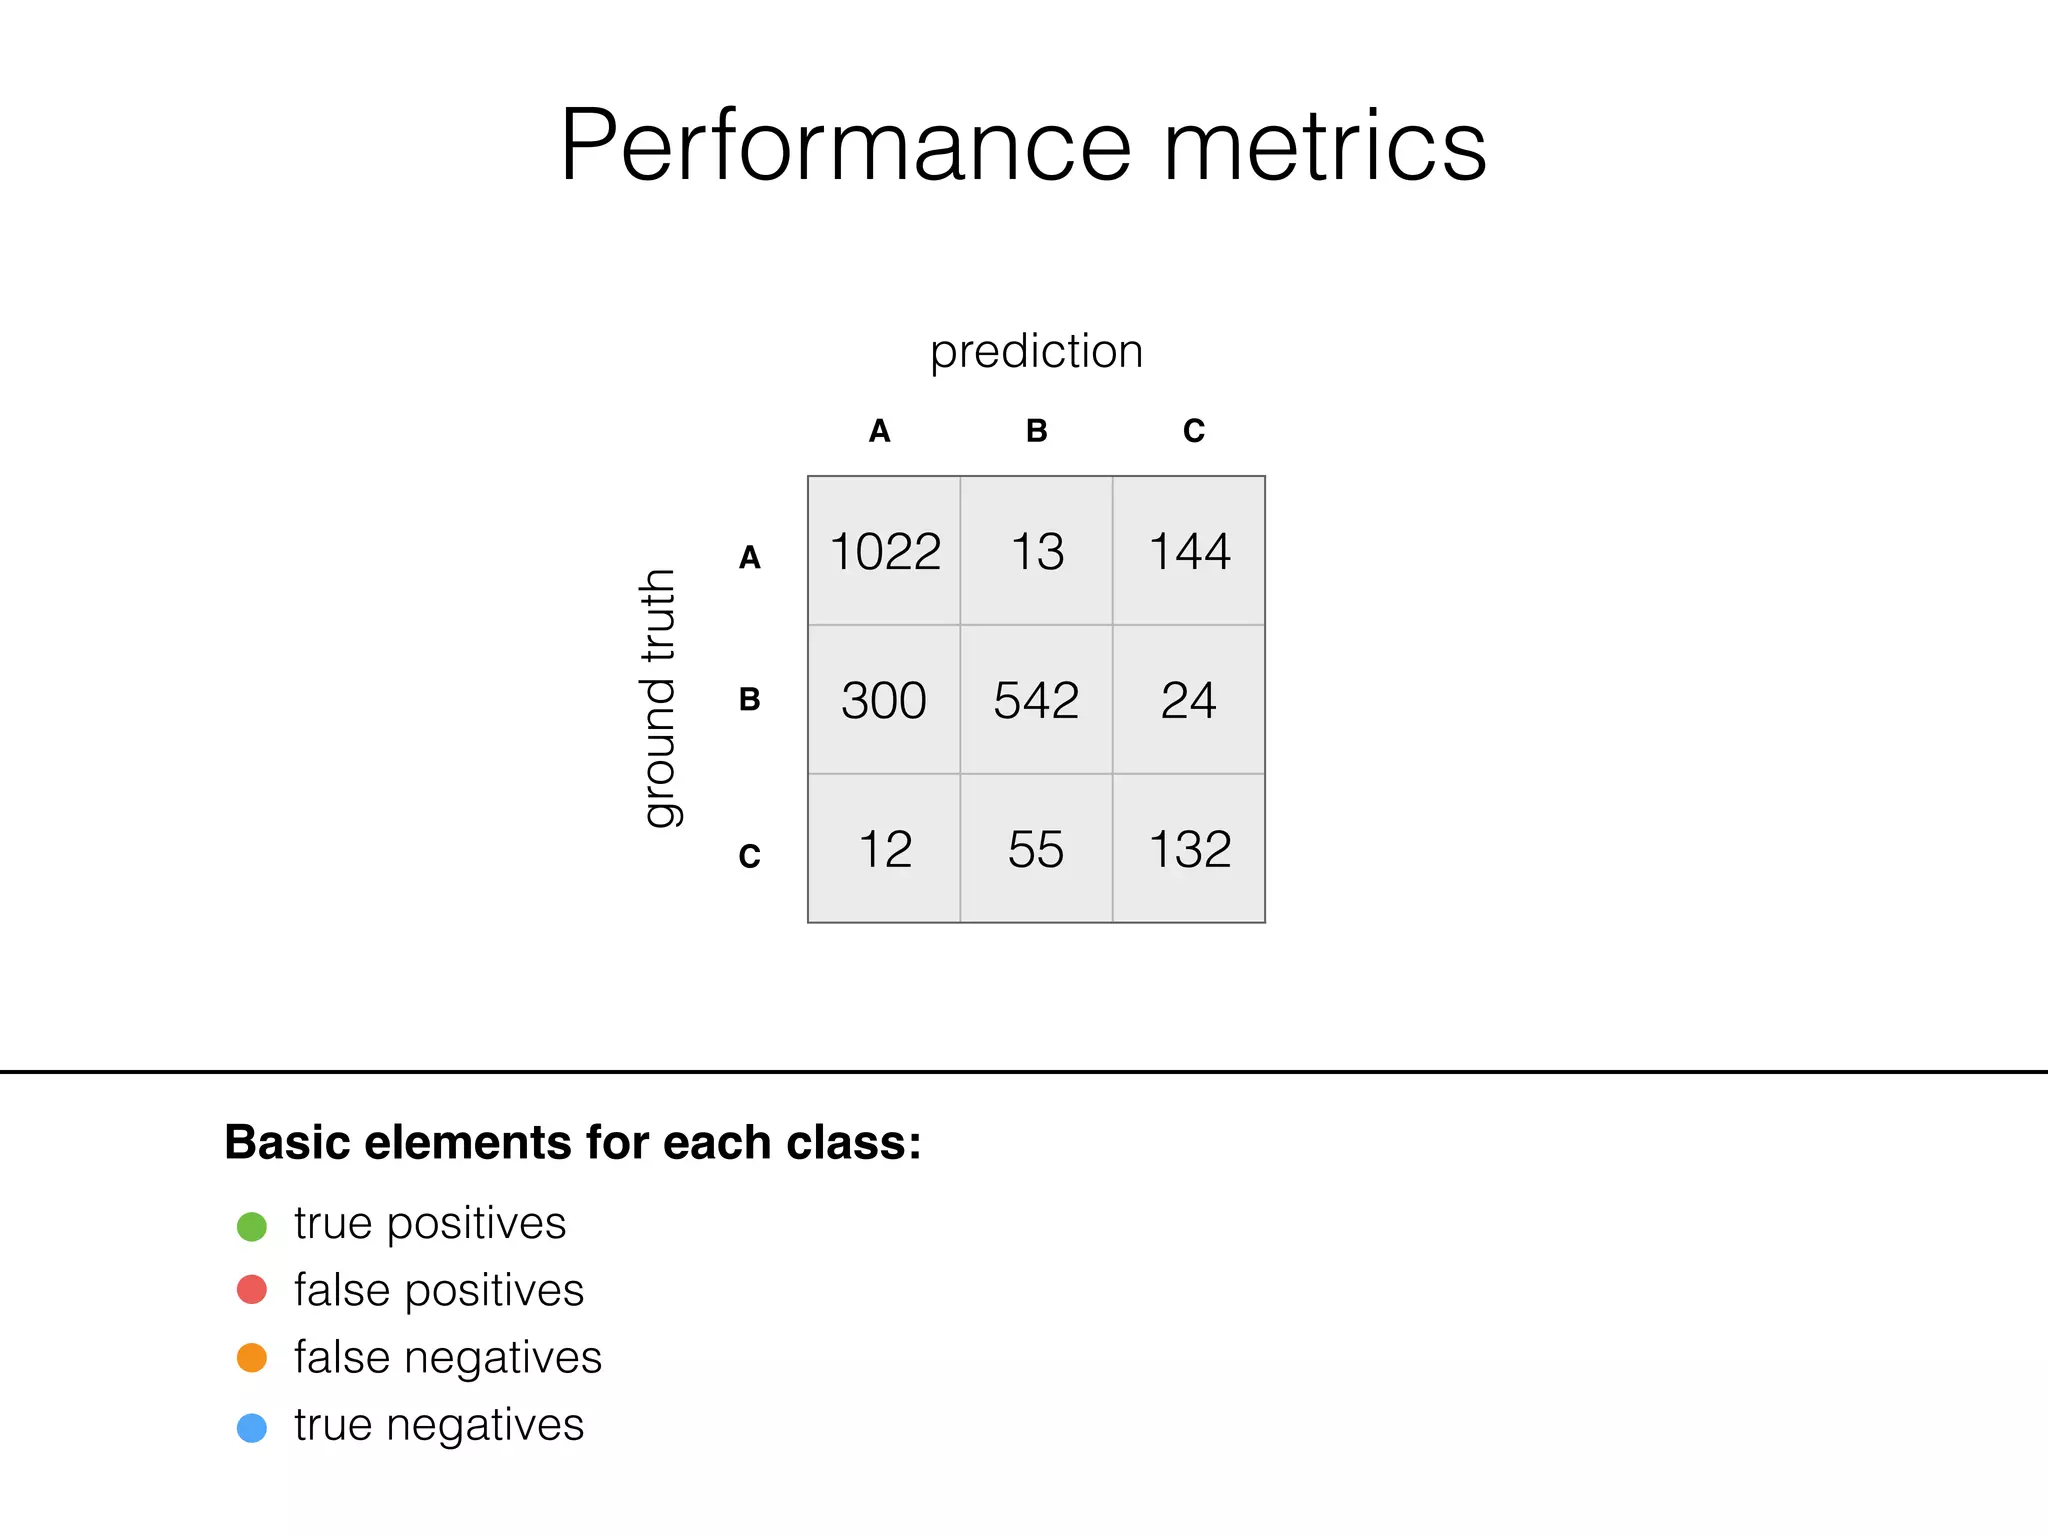
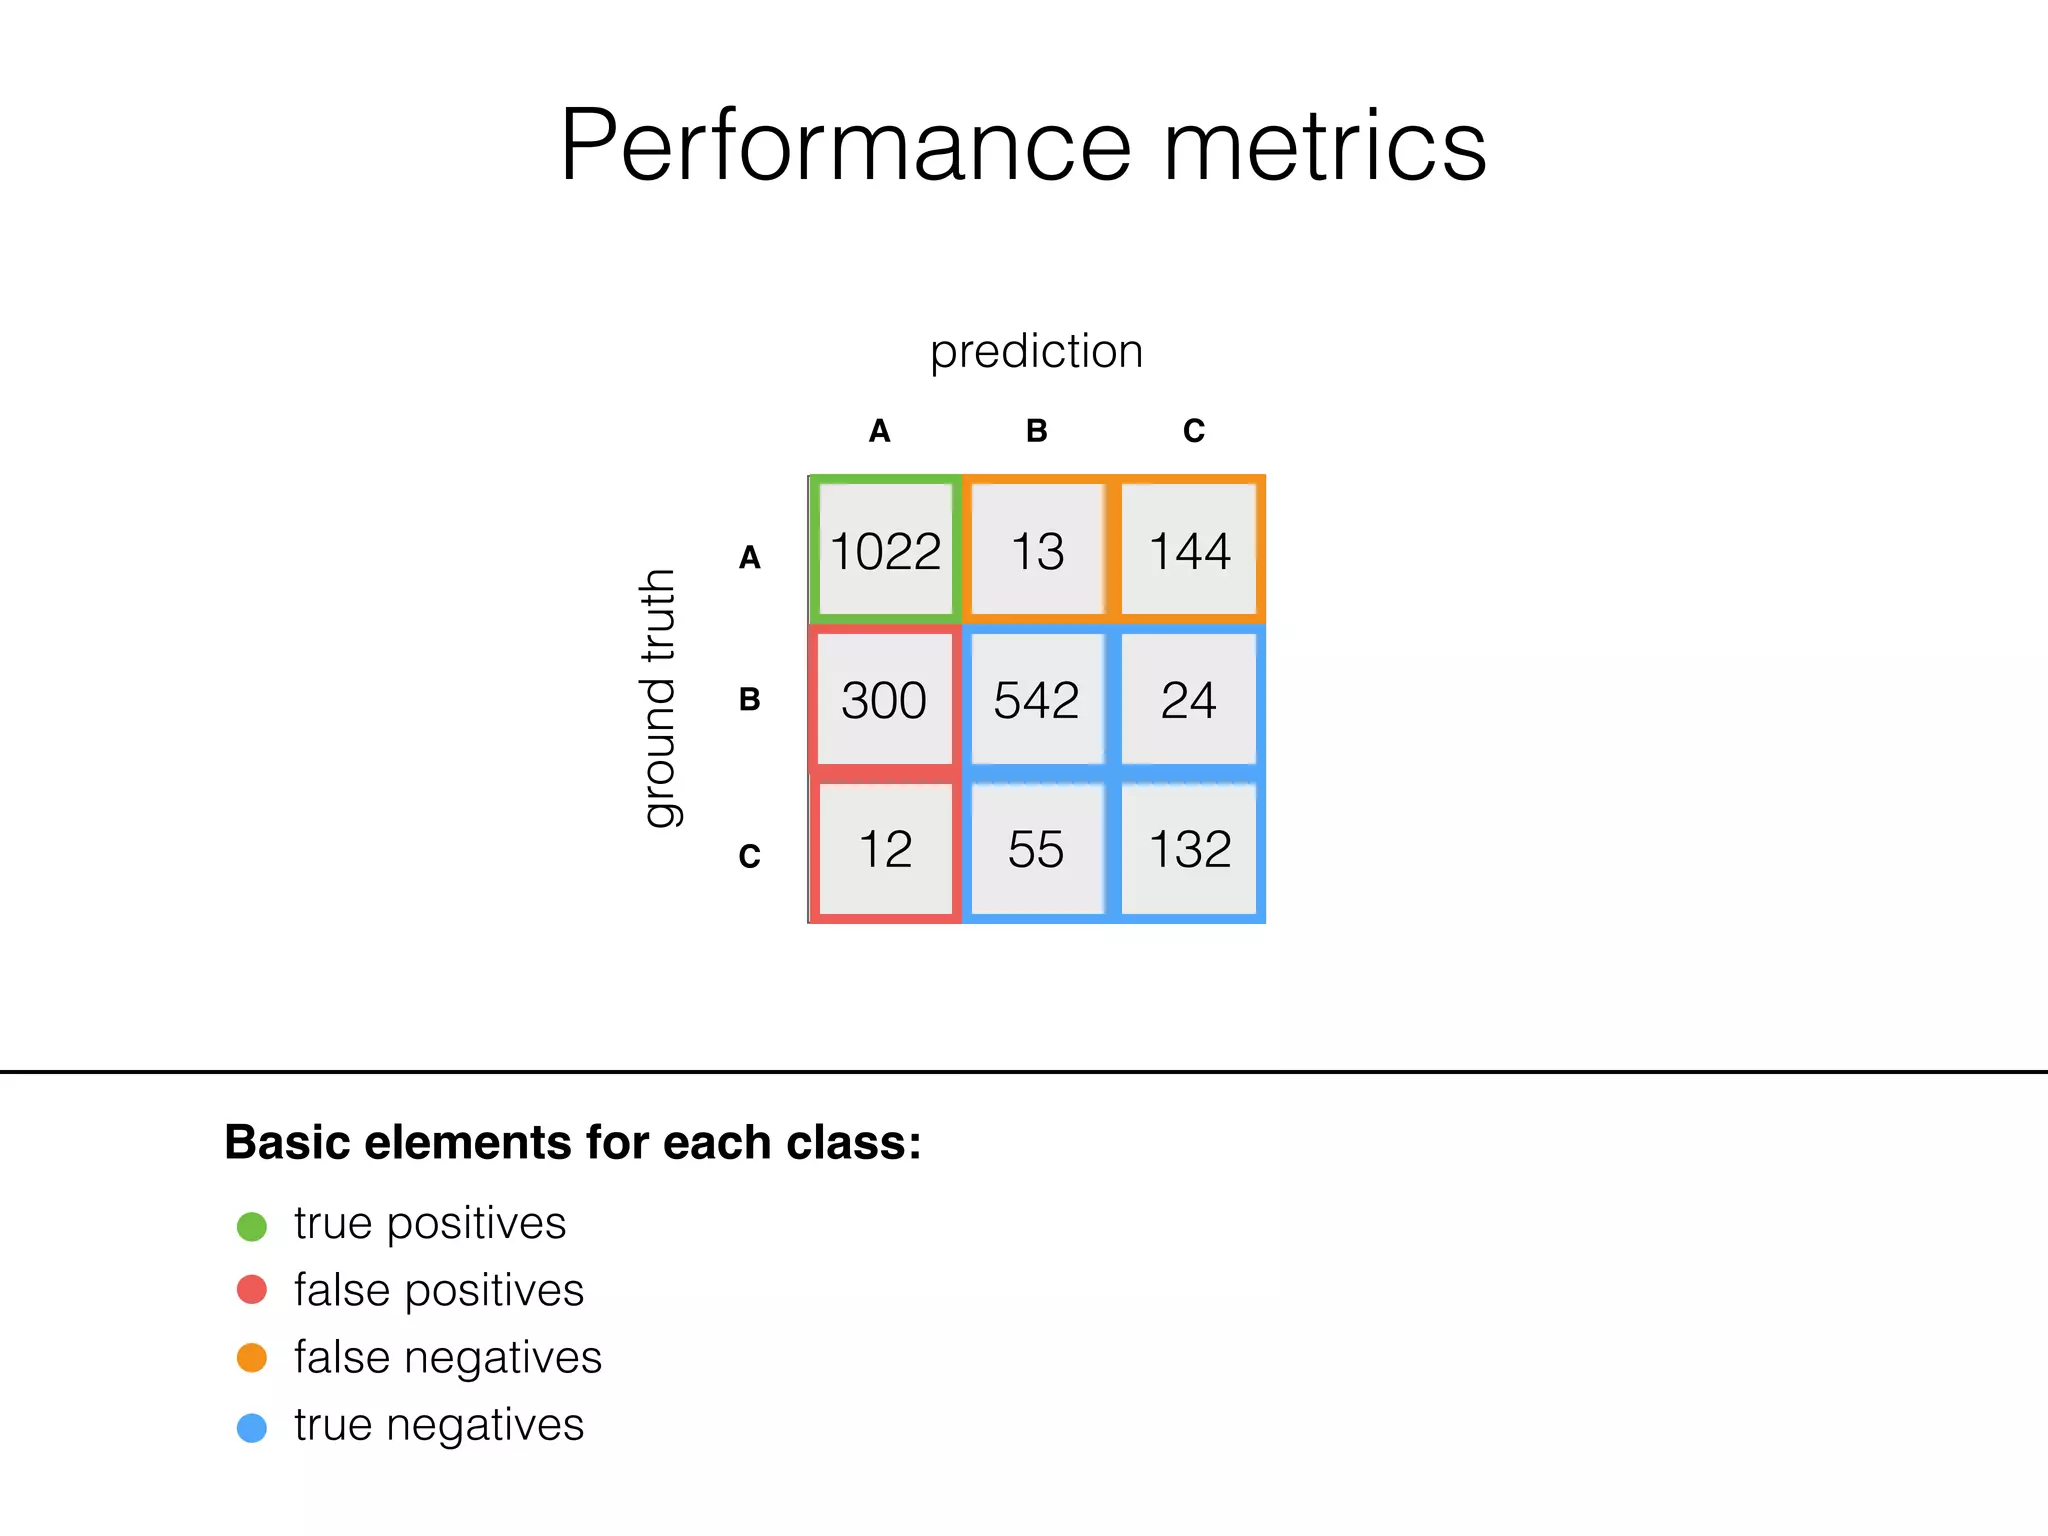
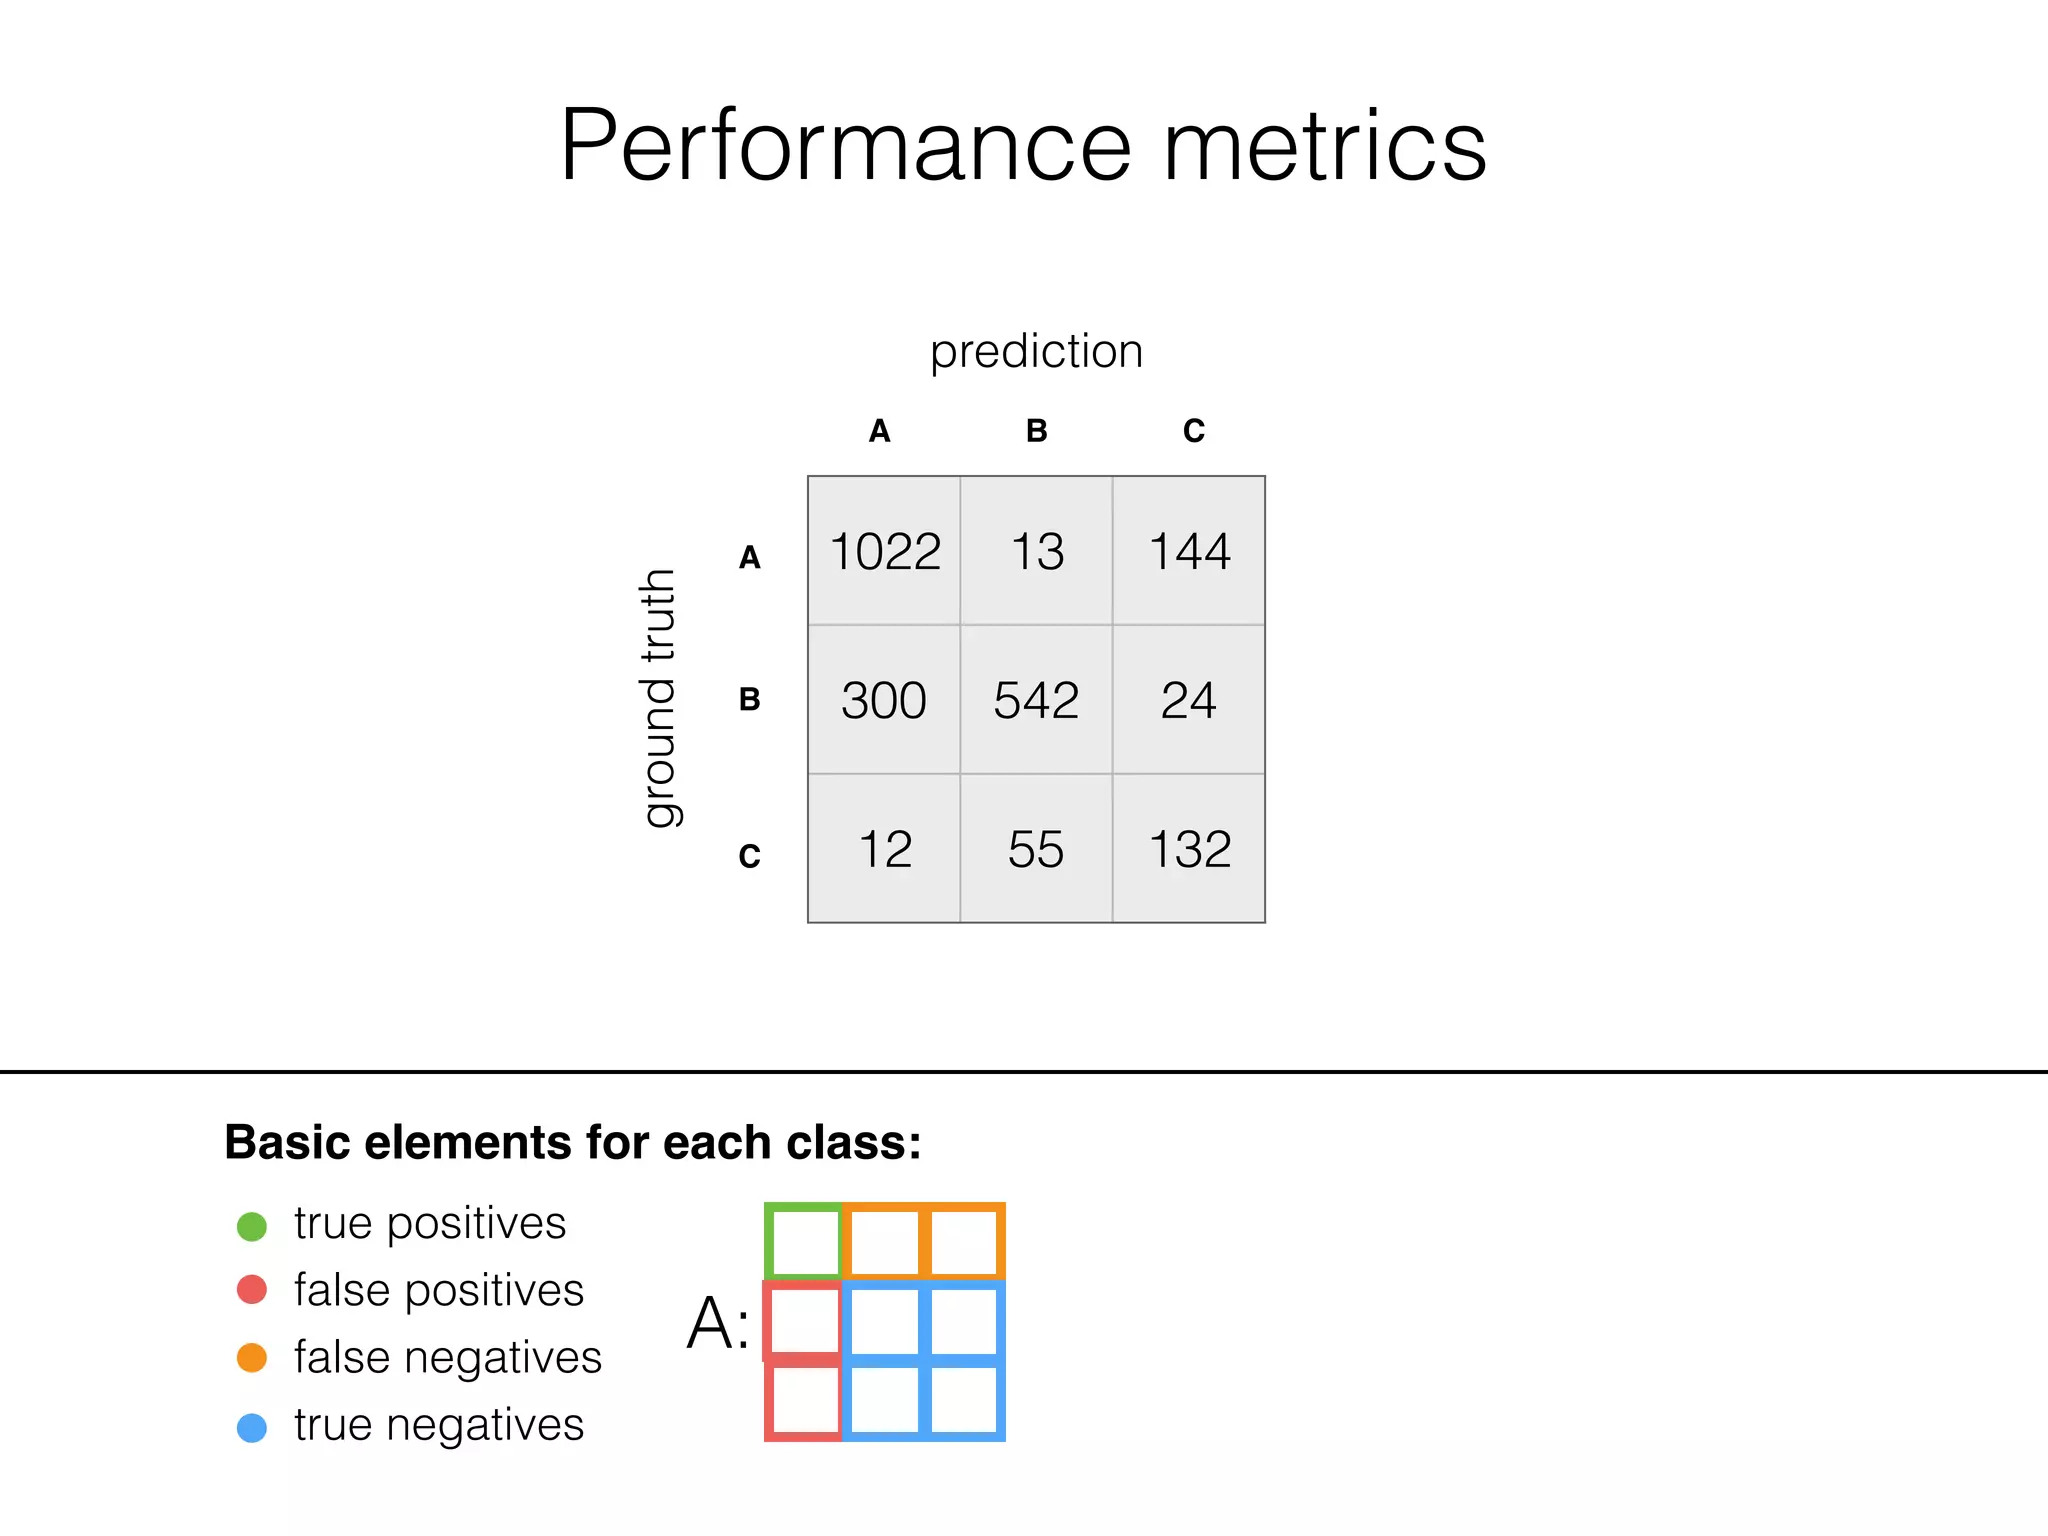
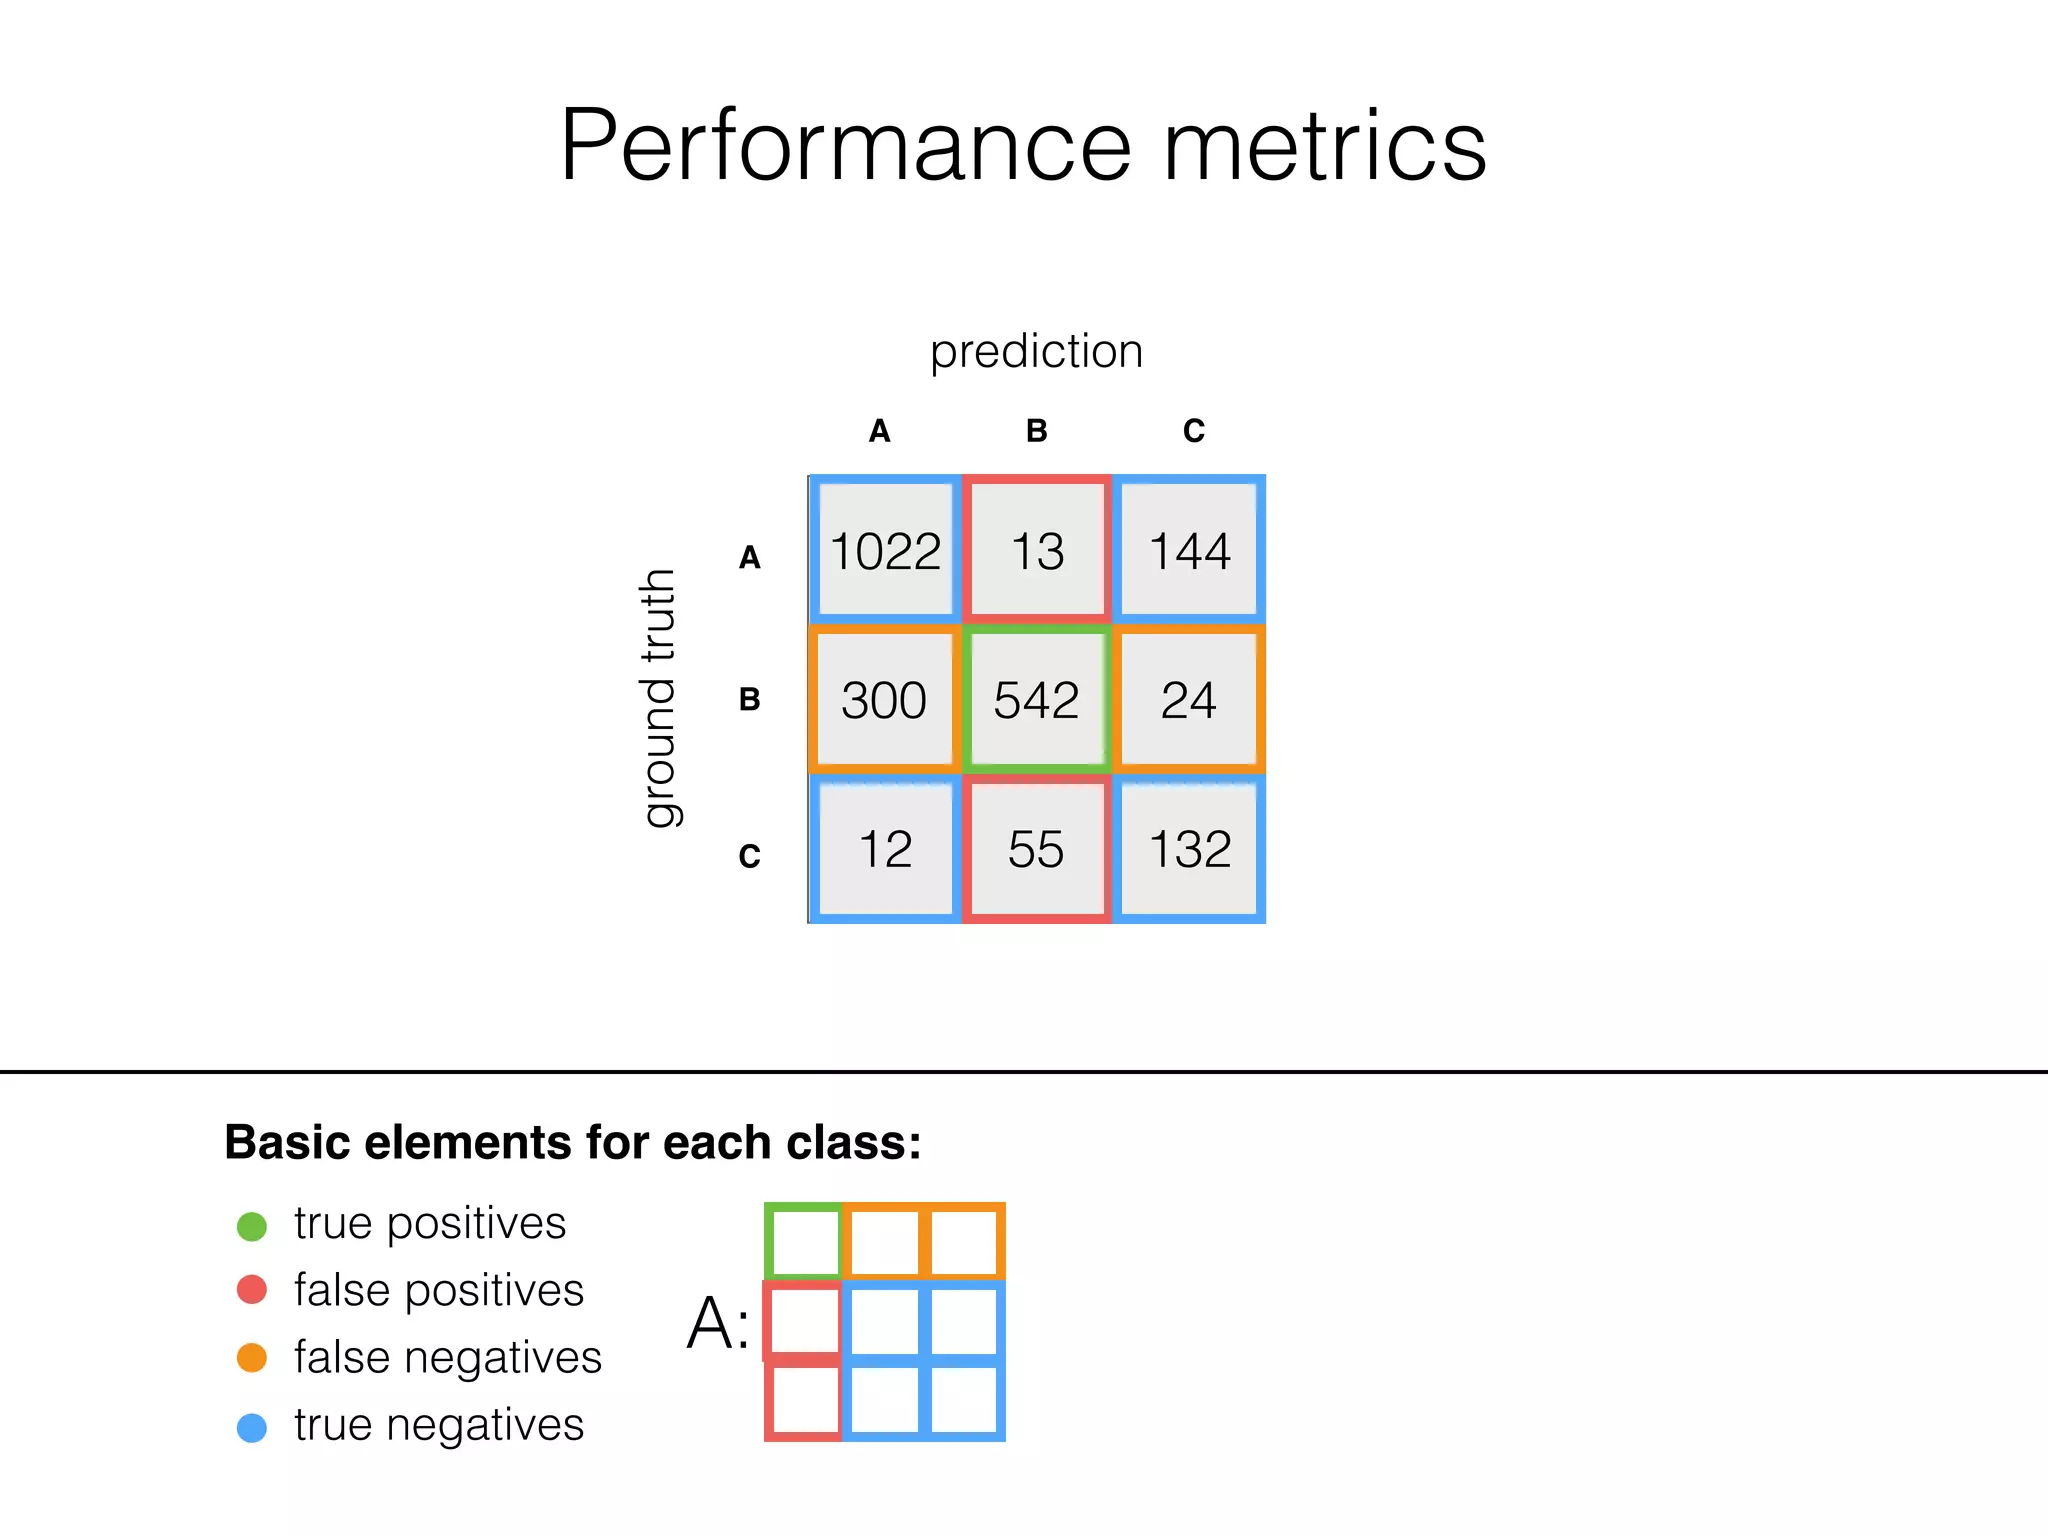
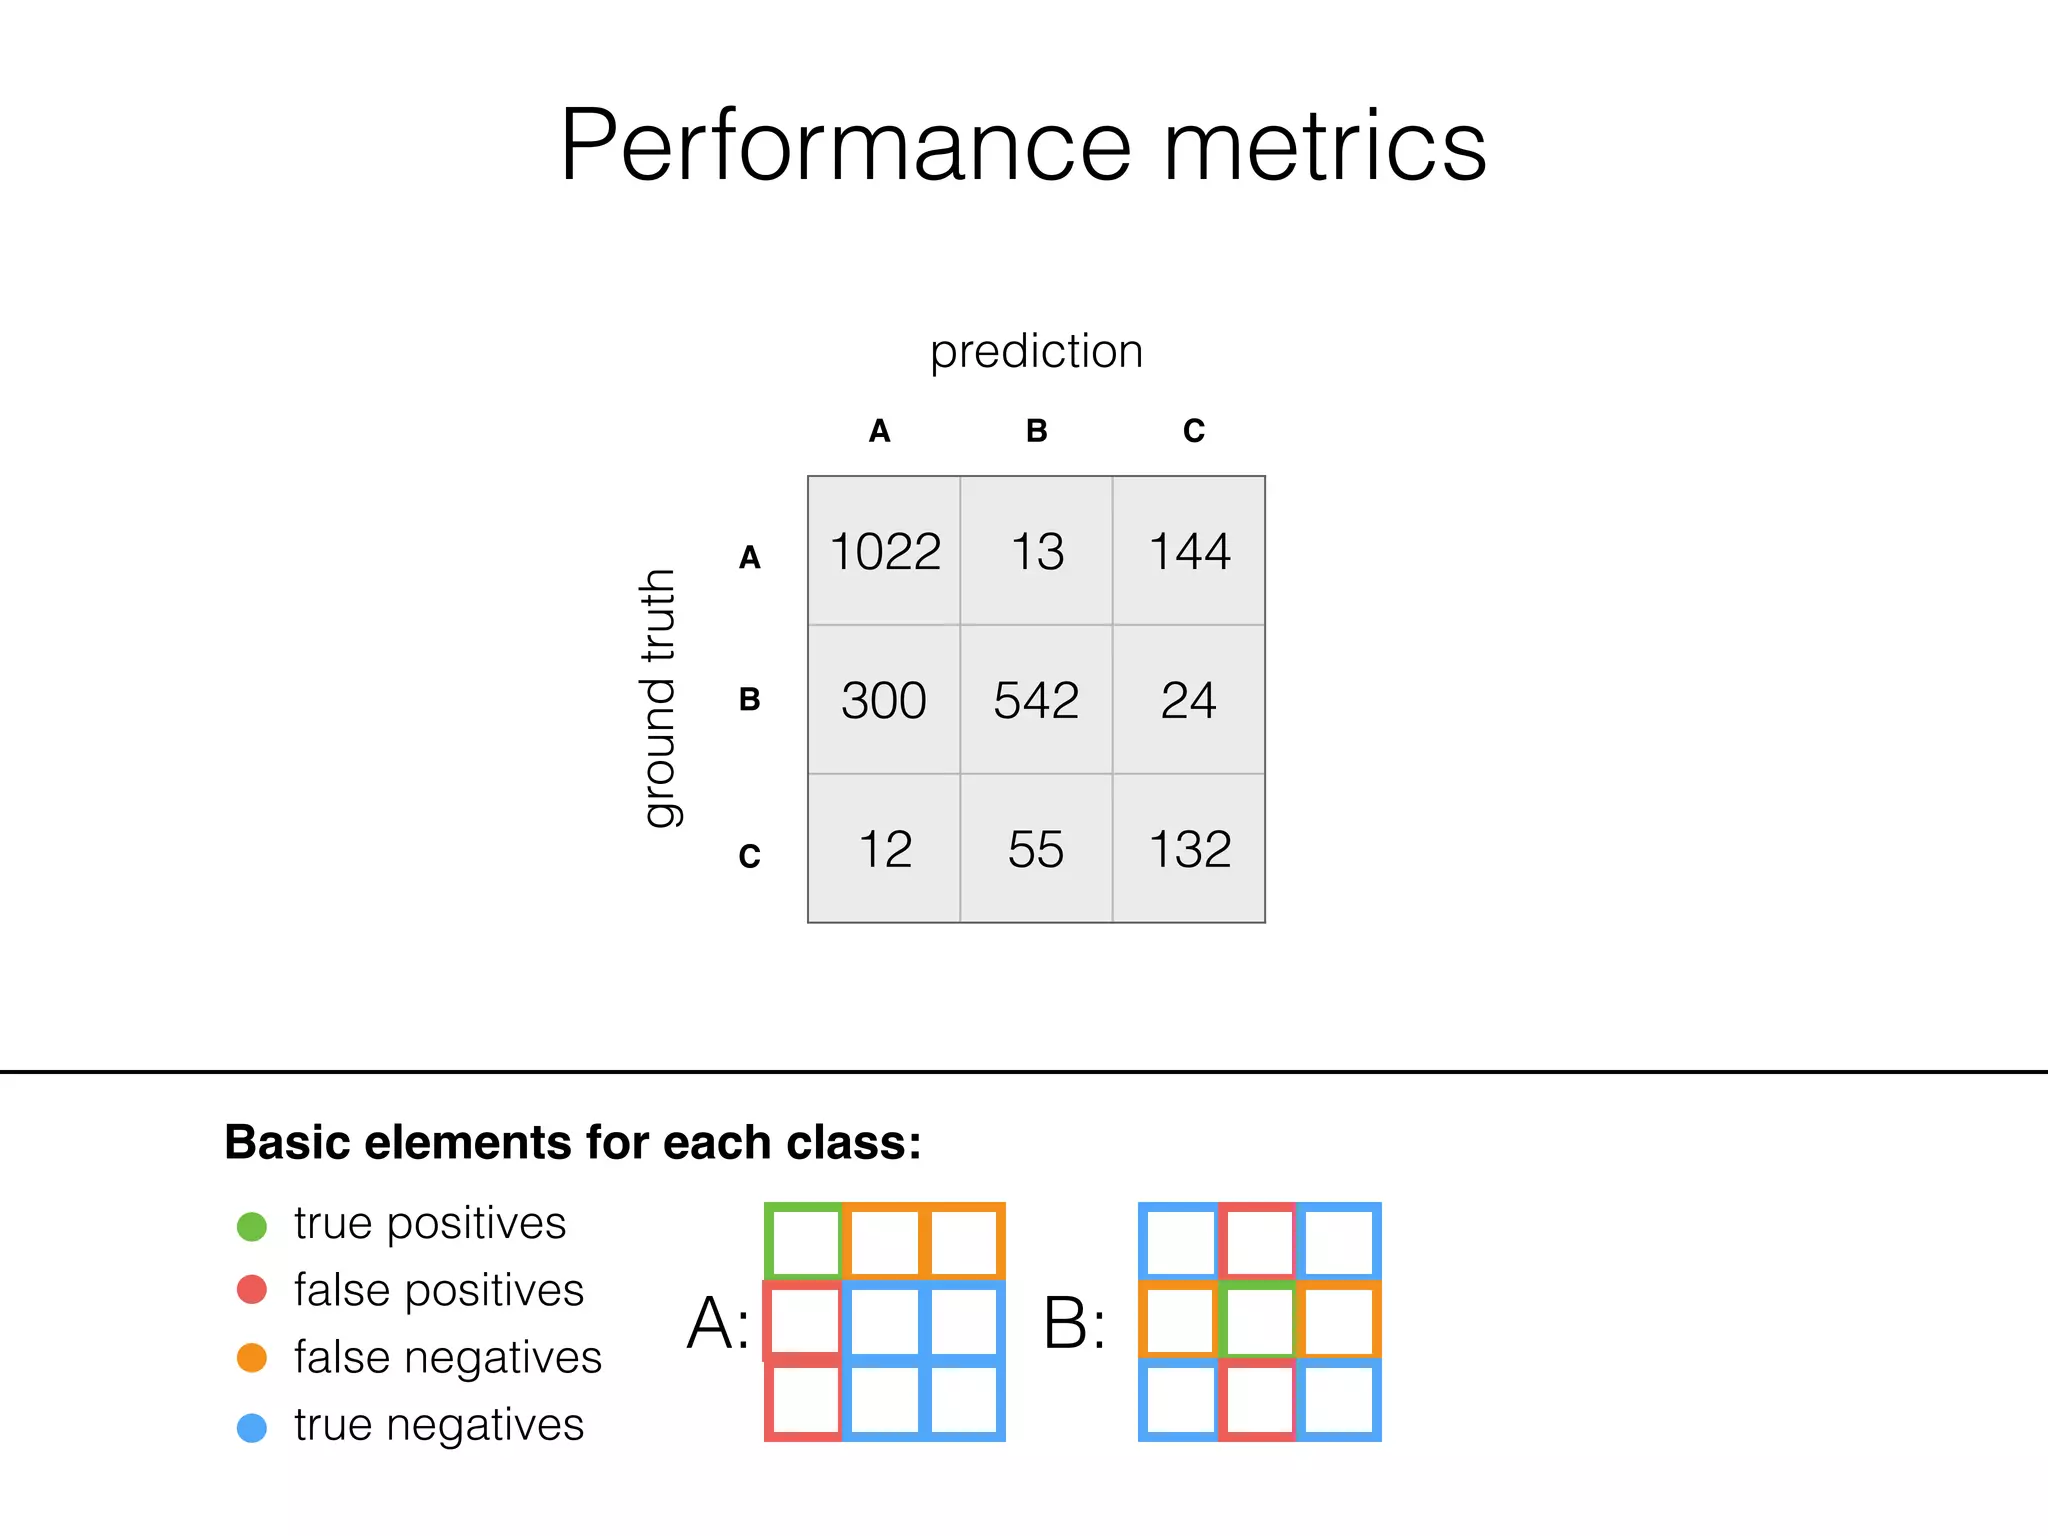
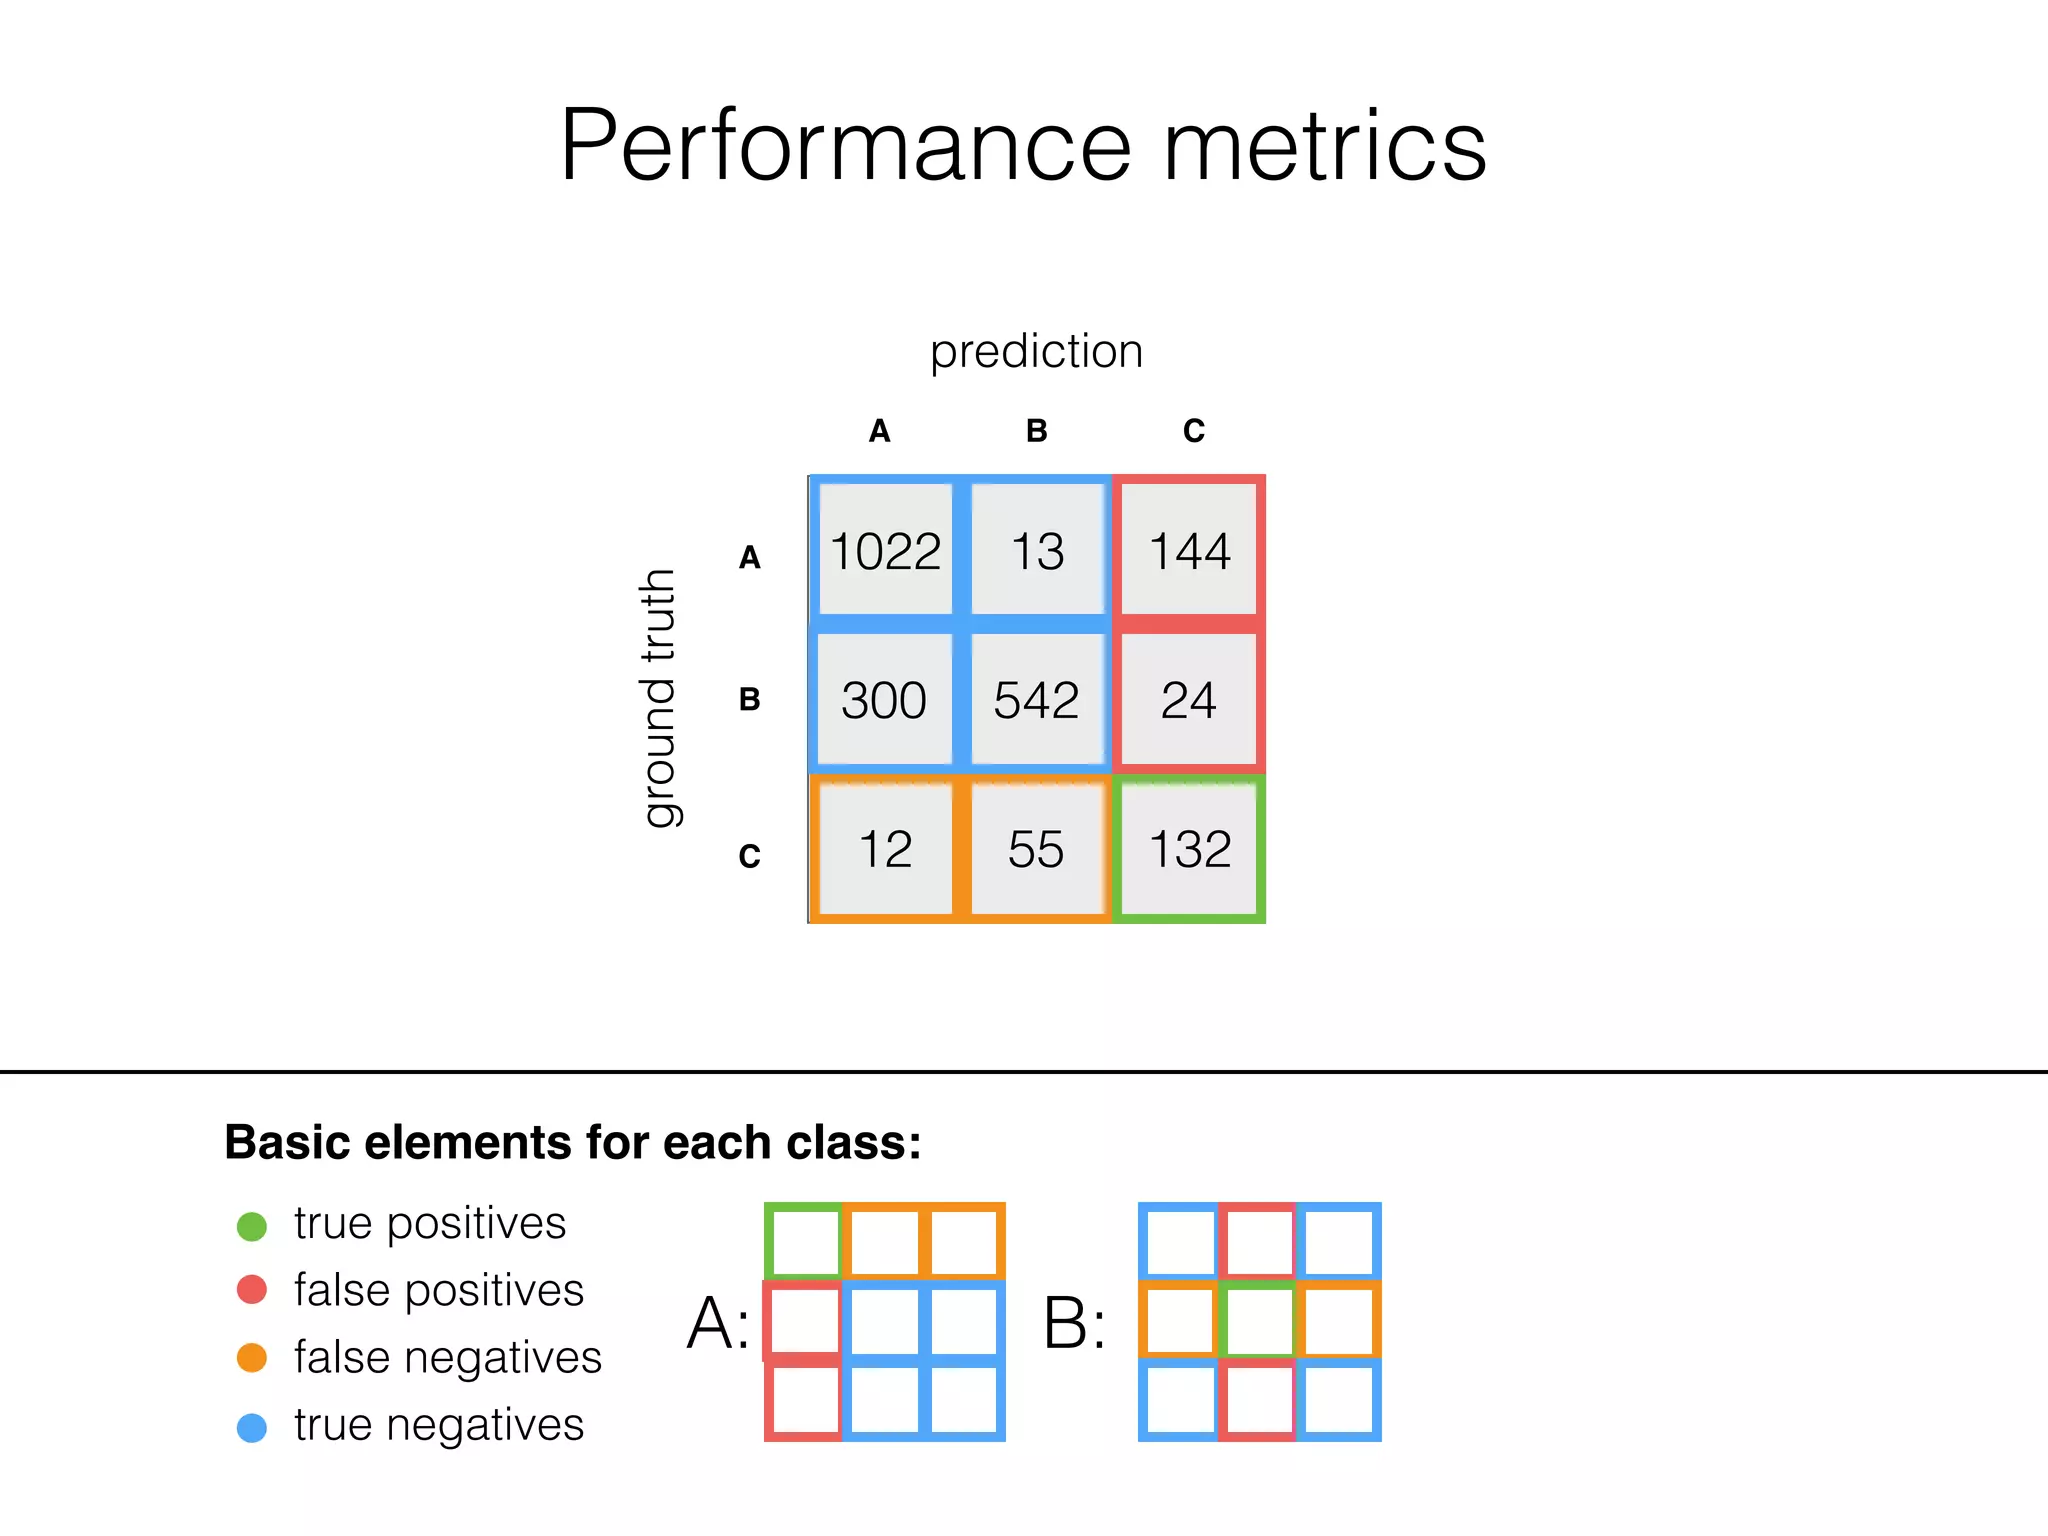
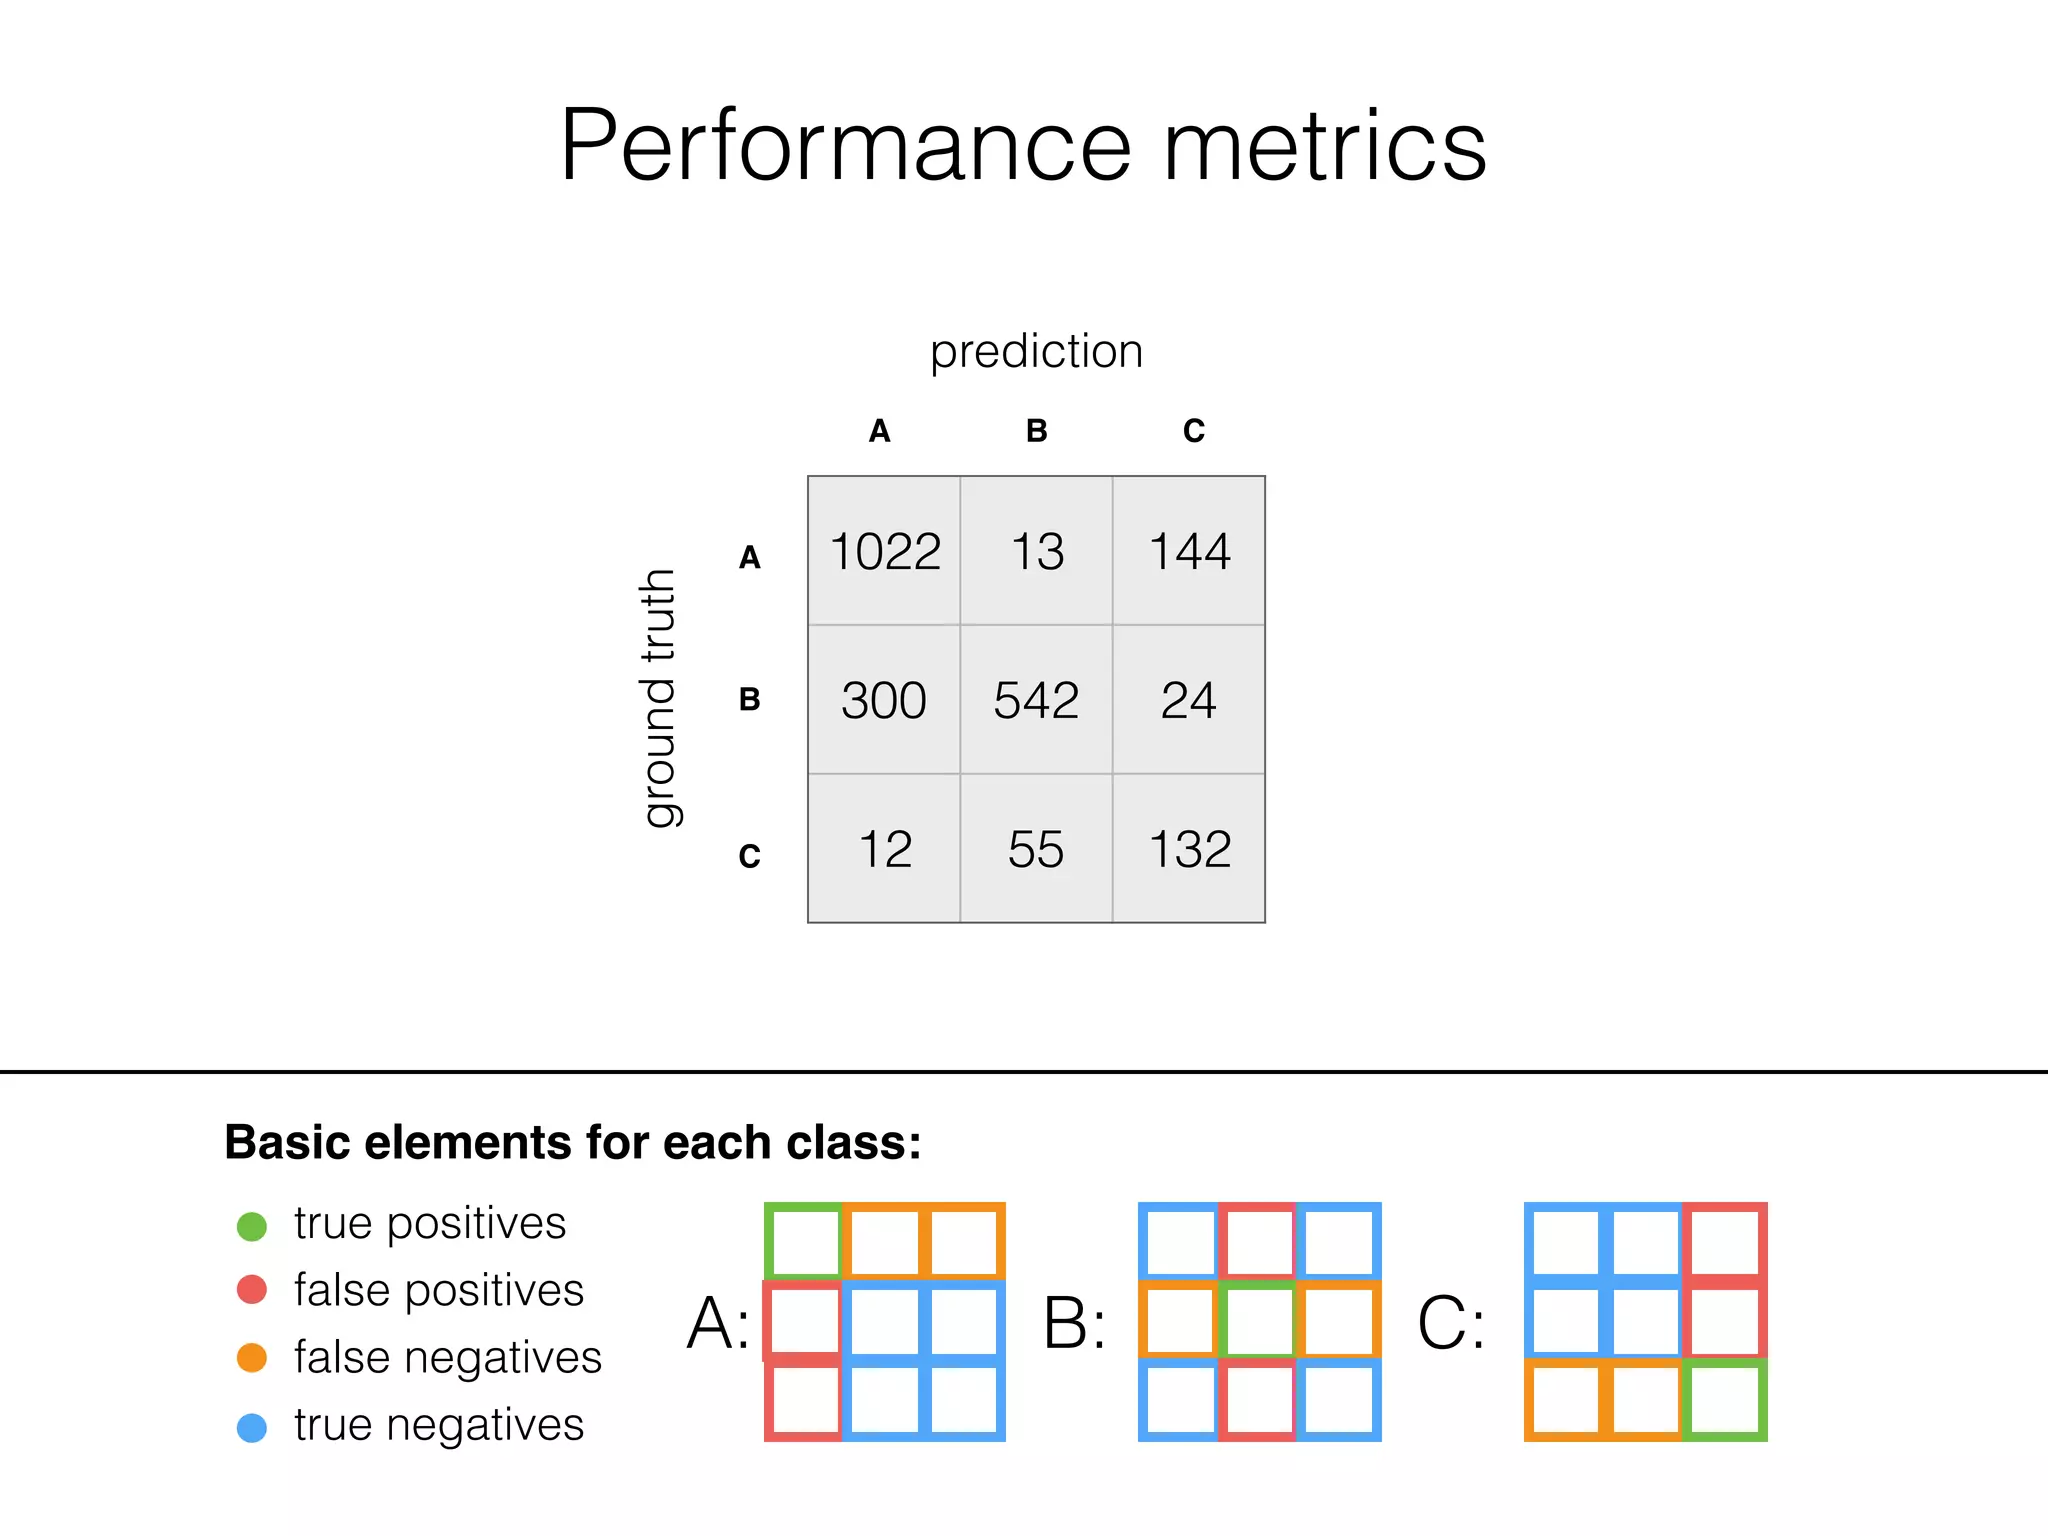
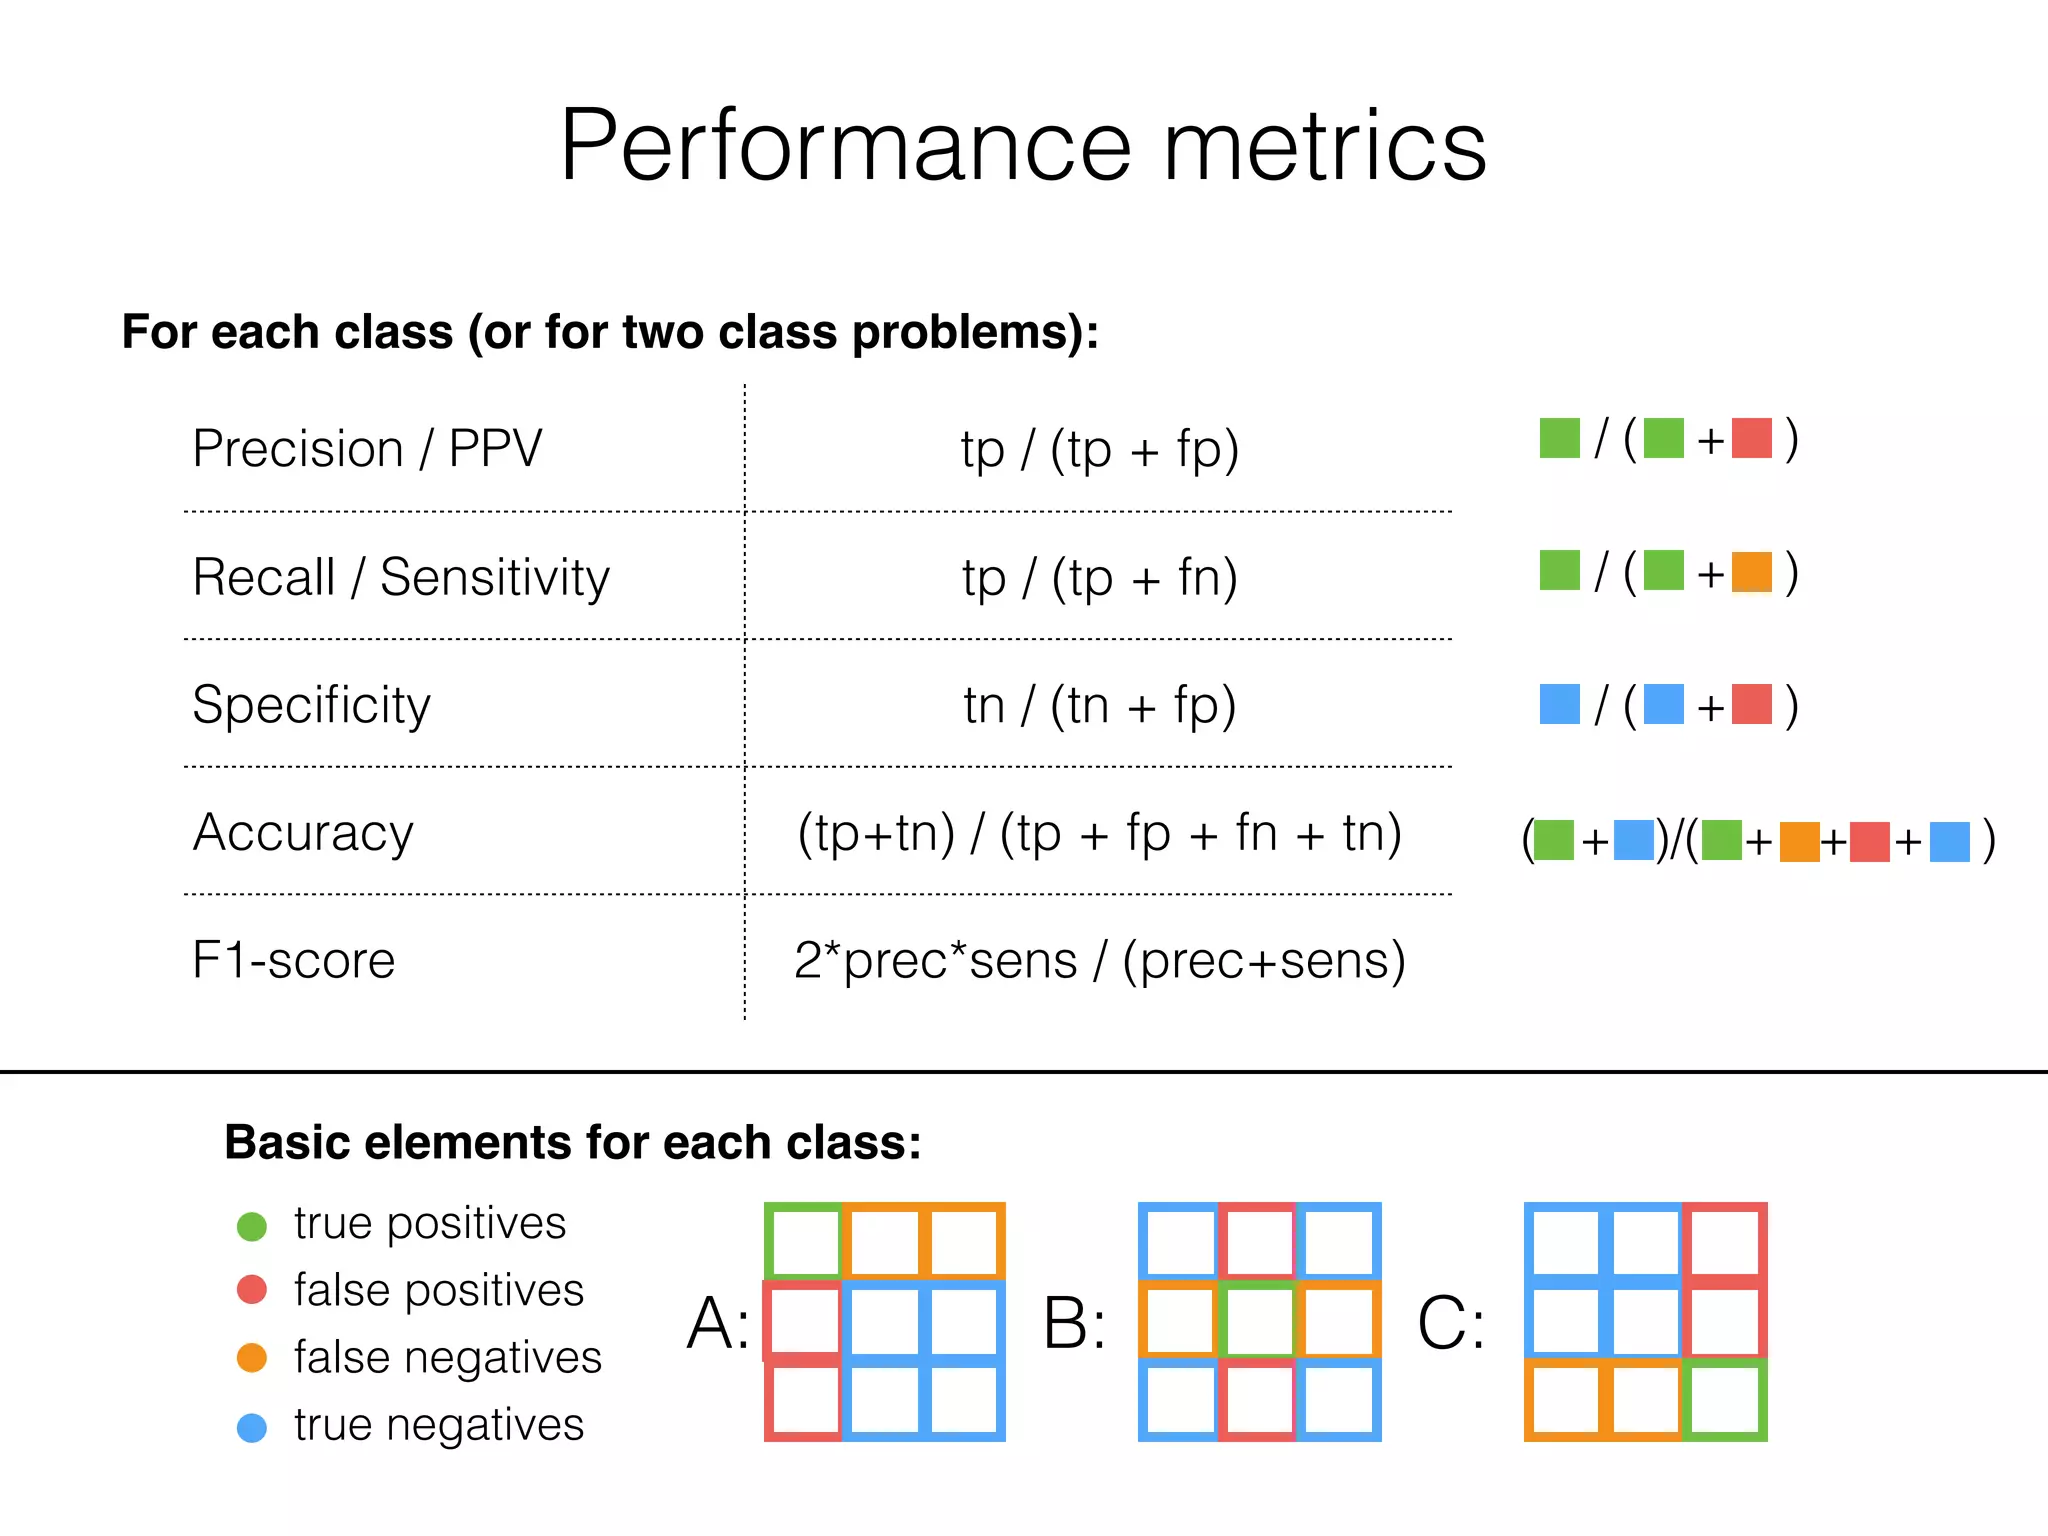
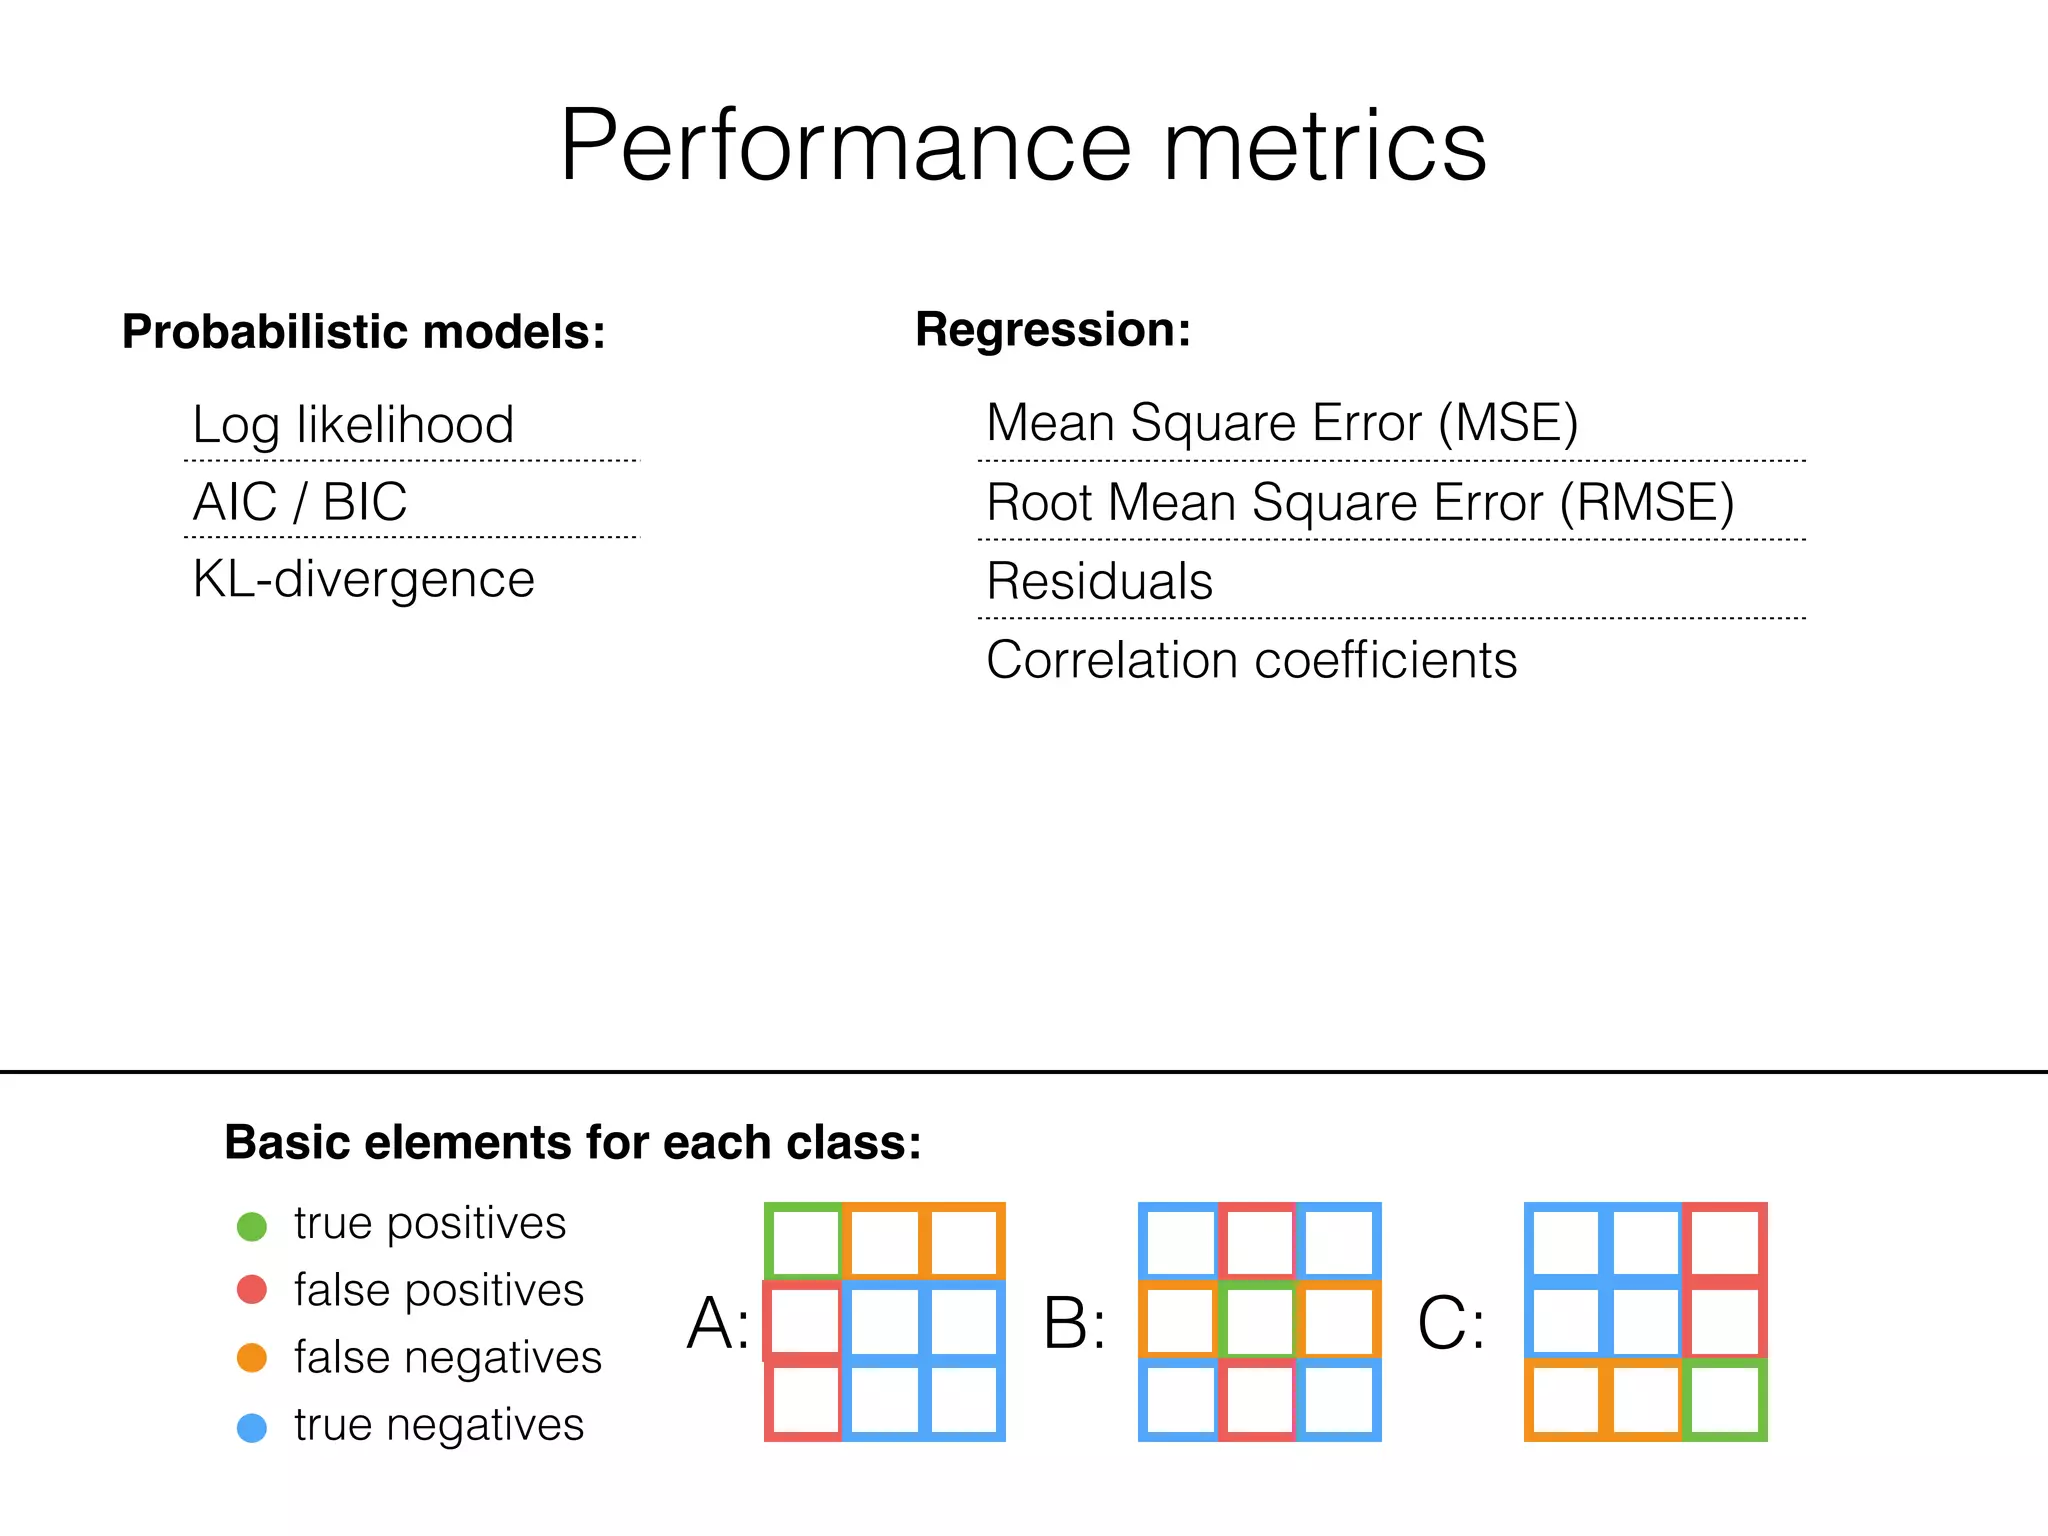
Basic elements for each class:
true positives
false positives
false negatives
true negatives
A: B: C:
Normalised confusion matrices
- Divide each row by its sum to get confusion probabilities
3284
449
311
66
446
1275
1600
319
133
647
2865
285
24
198
715
412
a) Confusion on HOME data-set
prediction
asleep off on dys
annotation(diary)
asleep
off
on
dys
0
0.1
0.2
0.3
0.4
0.5
0.6
0.7
0.8
0.9
1
6
13
155
180
39
101
414
117
3
3
164
b) Confusion on LAB data-set
prediction
asleep off on dys
annotation(clinician)
asleep
off
on
dys
0
0.1
0.2
0.3
0.4
0.5
0.6
0.7
0.8
0.9
1
[Hammerla, Nils Y., et al. "PD Disease State Assessment in Naturalistic Environments using Deep Learning." AAAI 2015]](https://image.slidesharecdn.com/ubicomp2015-tutorial-ml4ubicomp-evaluation-151120125536-lva1-app6892/75/Bridging-the-Gap-Machine-Learning-for-Ubiquitous-Computing-Evaluation-23-2048.jpg)
![Performance metrics
Basic elements for each class:
true positives
false positives
false negatives
true negatives
A: B: C:
Receiver Operator Characteristics (ROC)
- Illustrates trade-off between
True Positive Rate (sensitivity / recall), and
False Positive Rate (1 - specificity)
- Useful if approach has a simple parameter,
like a threshold.
0 0.1 0.2 0.3 0.4
0
0.2
0.4
0.6
0.8
1
false positive rate
truepositiverate
ROC curves for different classifiers
knn
c45
logR
PCA−logR
[Ladha, Cassim, et al. "ClimbAX: skill
assessment for climbing enthusiasts."
Ubicomp 2013]](https://image.slidesharecdn.com/ubicomp2015-tutorial-ml4ubicomp-evaluation-151120125536-lva1-app6892/75/Bridging-the-Gap-Machine-Learning-for-Ubiquitous-Computing-Evaluation-24-2048.jpg)

![Ward et al. (2011)
• Continuous recognition
• Measures like accuracy treat each error the same
• But: The predictions are time-series themselves, and different errors
are possible
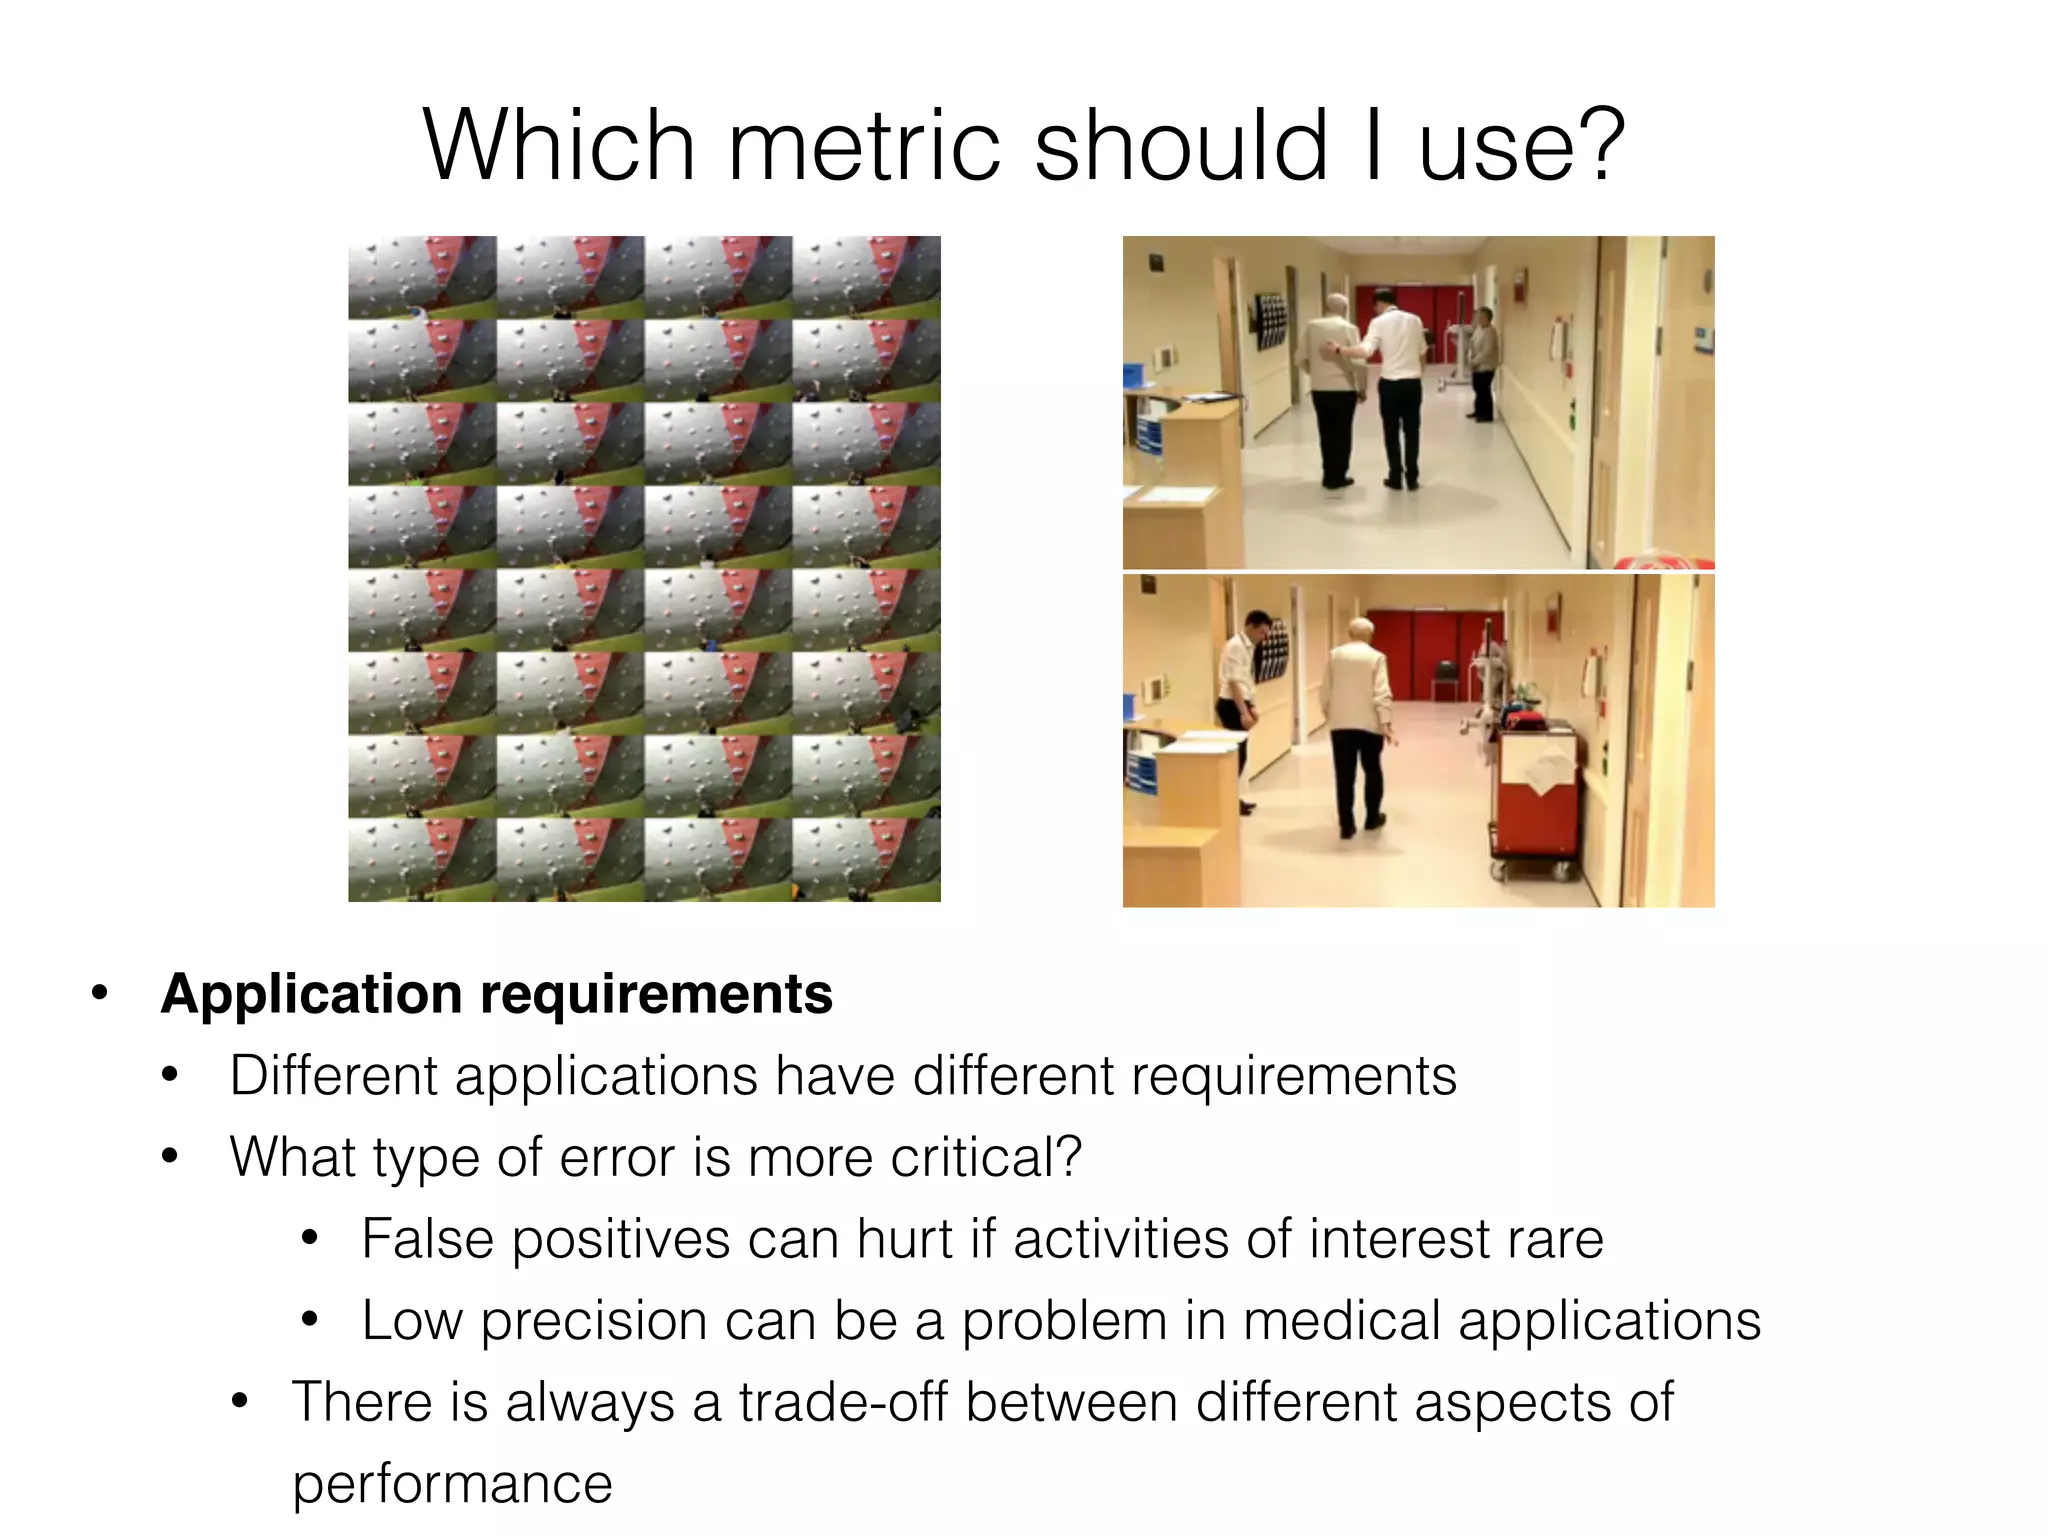
• Which type of error is more acceptable in my application?
[Jamie Ward et al., Performance Metrics for Activity Recognition]](https://image.slidesharecdn.com/ubicomp2015-tutorial-ml4ubicomp-evaluation-151120125536-lva1-app6892/75/Bridging-the-Gap-Machine-Learning-for-Ubiquitous-Computing-Evaluation-33-2048.jpg)
![Ward et al. (2011)
• Continuous recognition
• Similar to bioinformatics:
• Merge, Deletion, Confusion, Fragmentation, Insertion
• Each type of error is scored differently (cost matrix)
• Compound score reflects (adjustable) performance metric
• Systems that show very good performance in regular metrics may
show poor performance in one of these aspects!
[Jamie Ward et al., Performance Metrics for Activity Recognition]](https://image.slidesharecdn.com/ubicomp2015-tutorial-ml4ubicomp-evaluation-151120125536-lva1-app6892/75/Bridging-the-Gap-Machine-Learning-for-Ubiquitous-Computing-Evaluation-34-2048.jpg)