Downloaded 60 times


![Knut Relbe-Moe [MVP, MCT], profile picture](https://cdn.slidesharecdn.com/profile-photo-sharePTkarm-48x48.jpg?cb=1603406013)
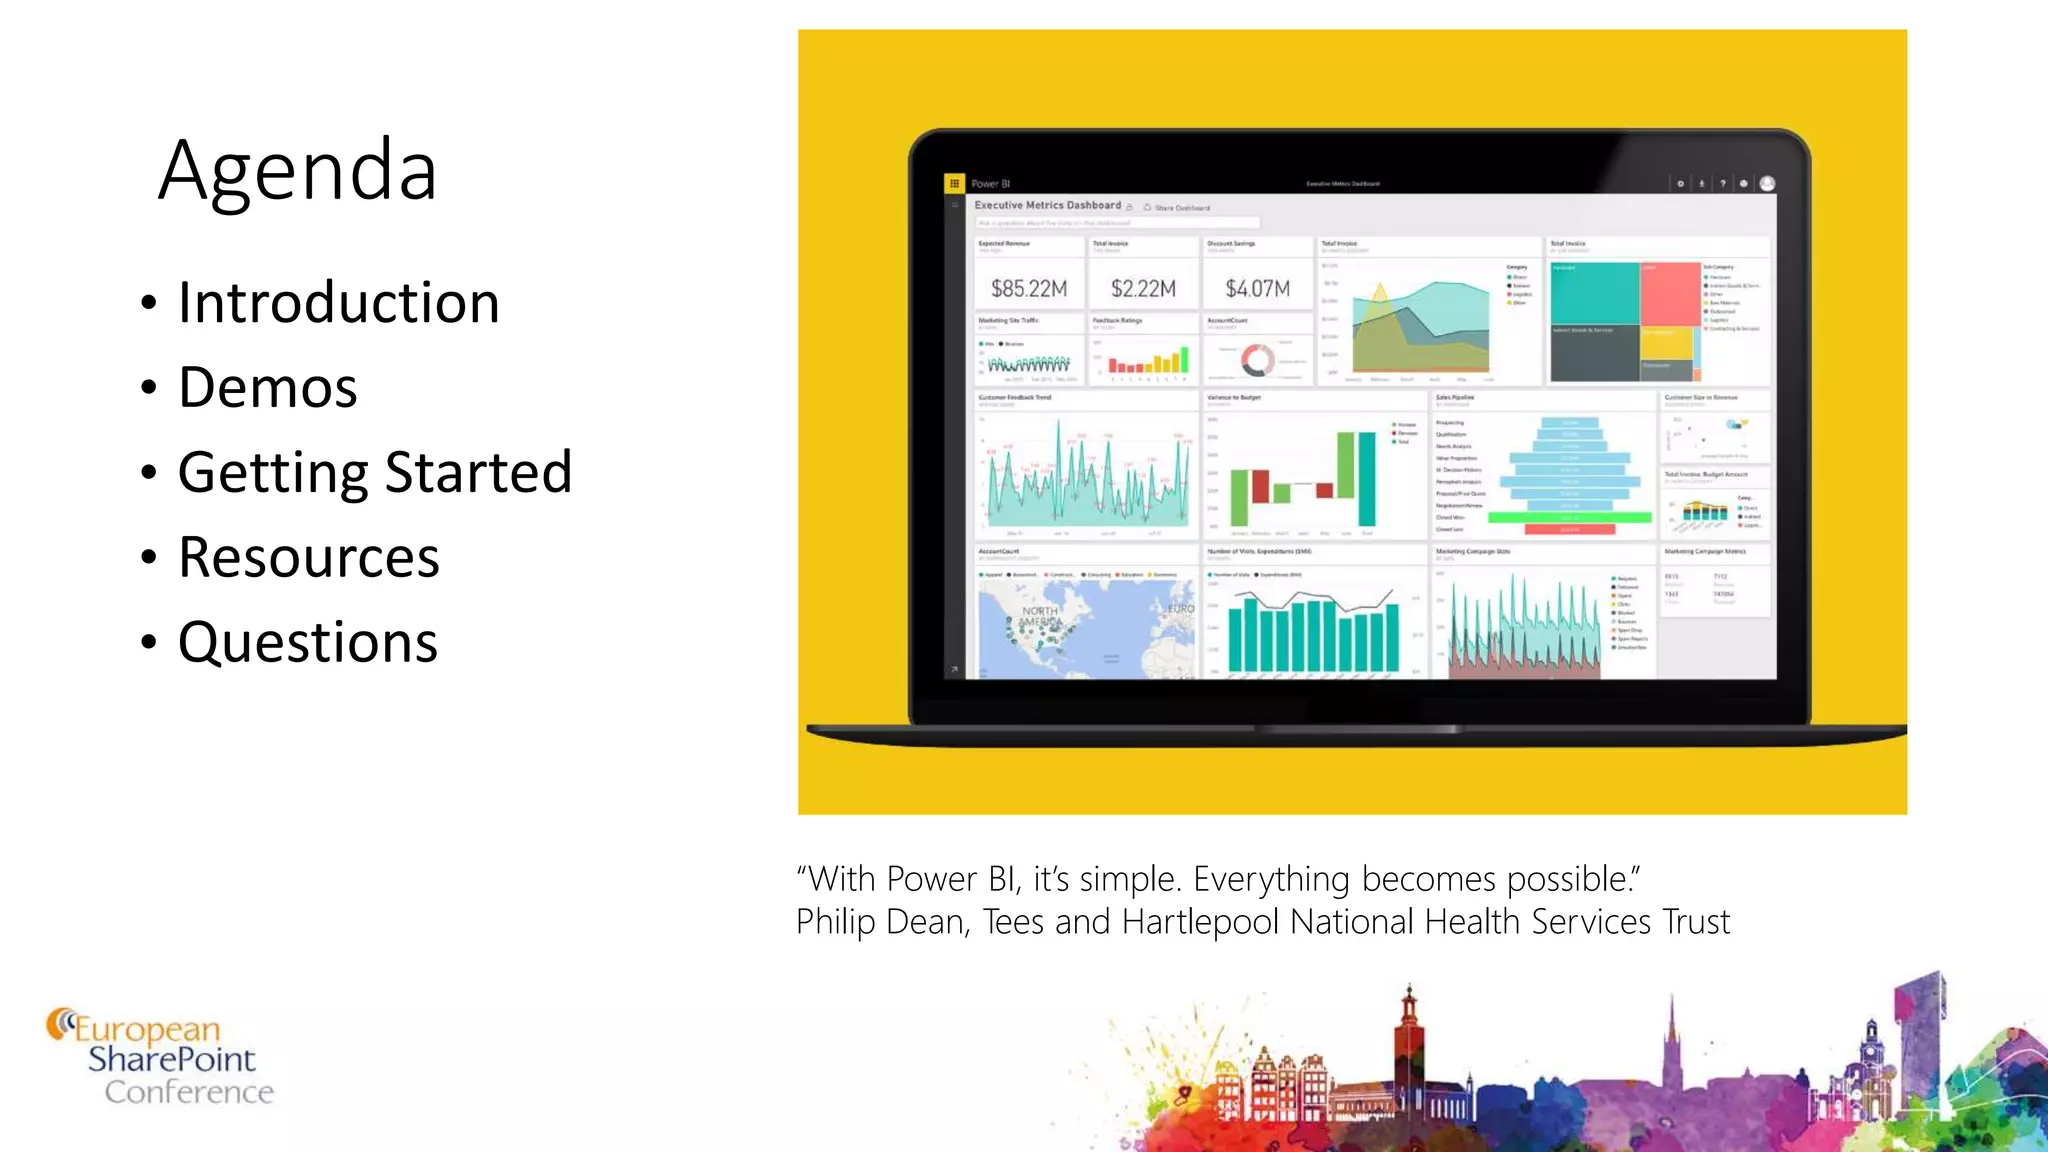
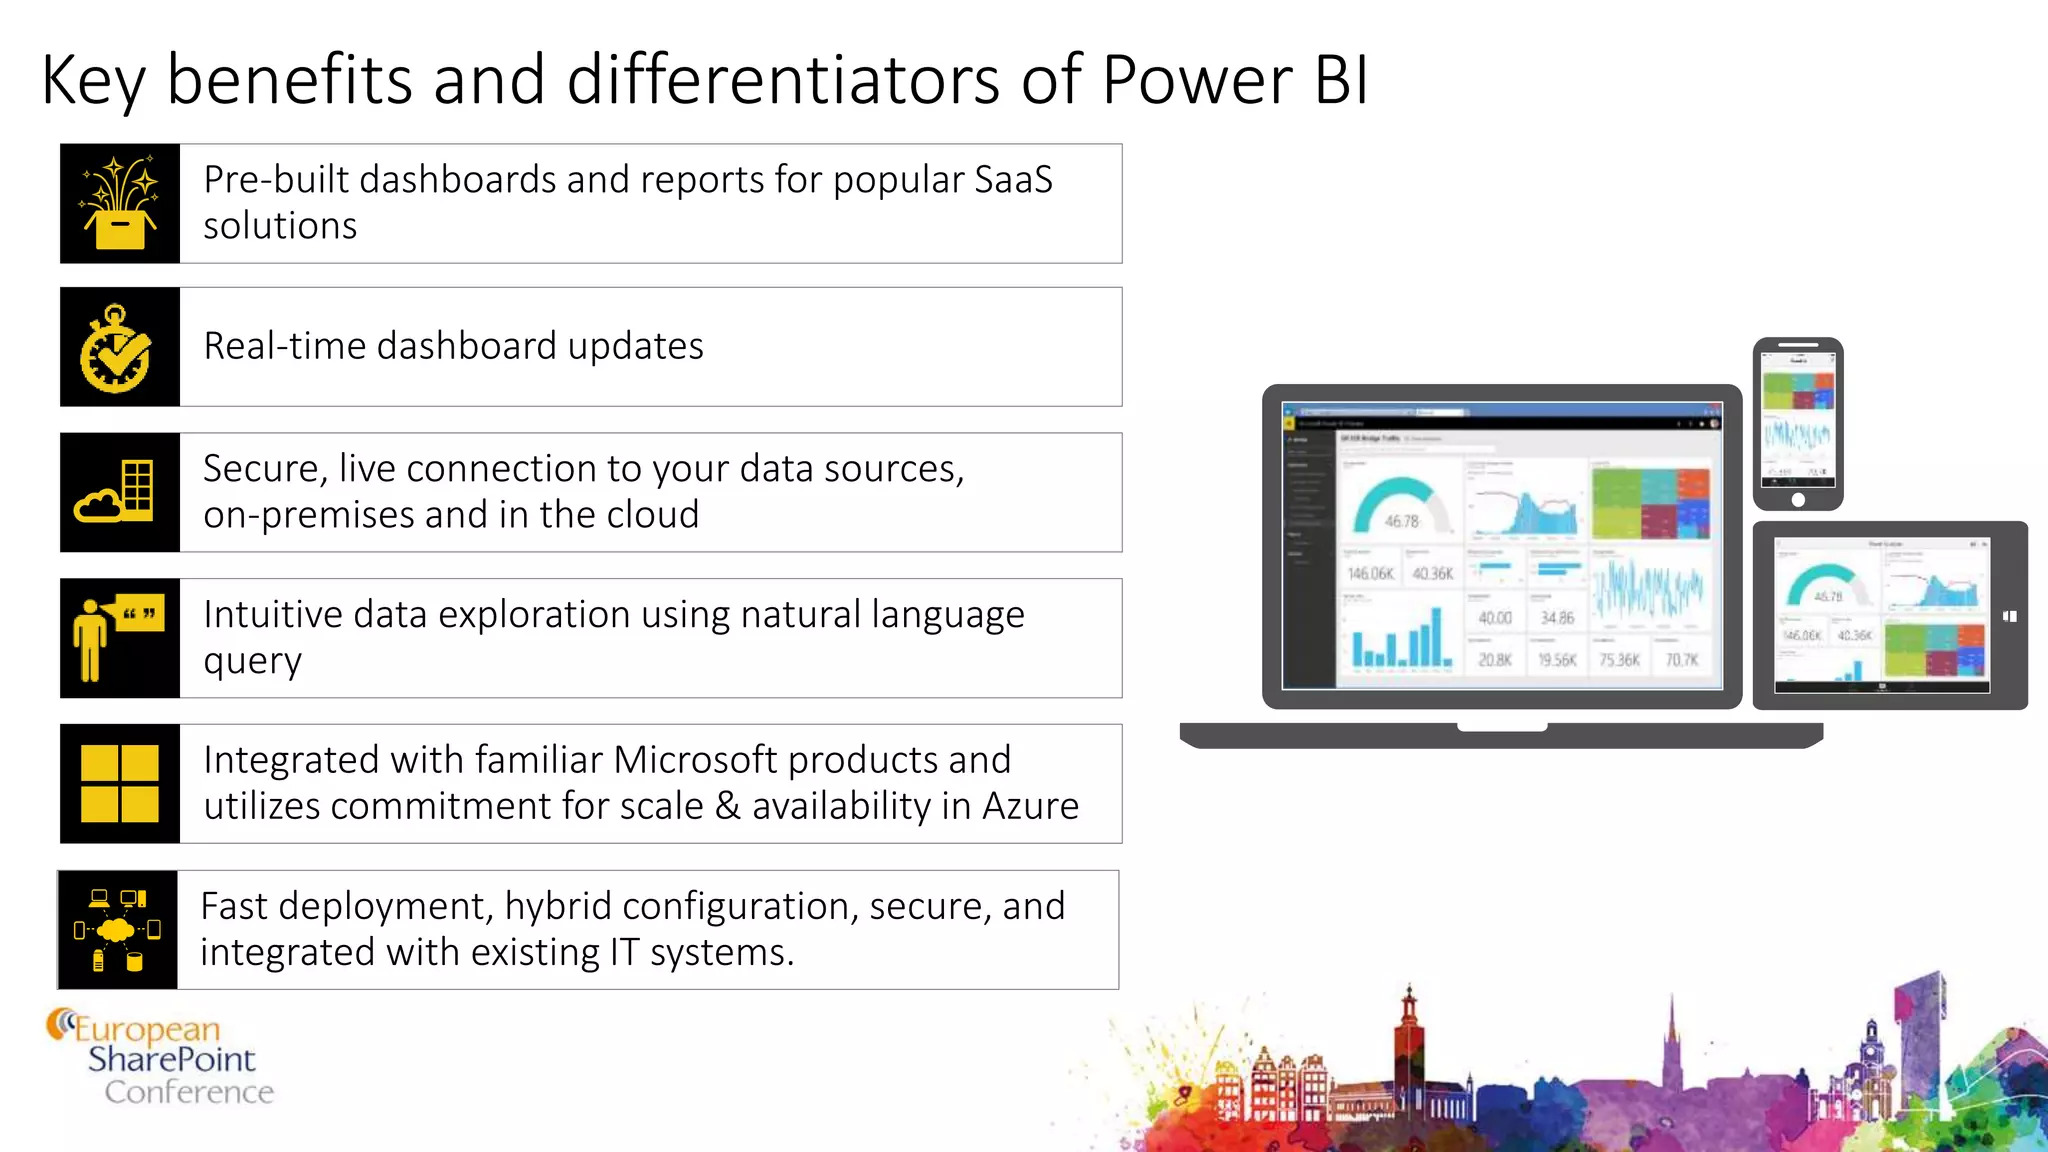
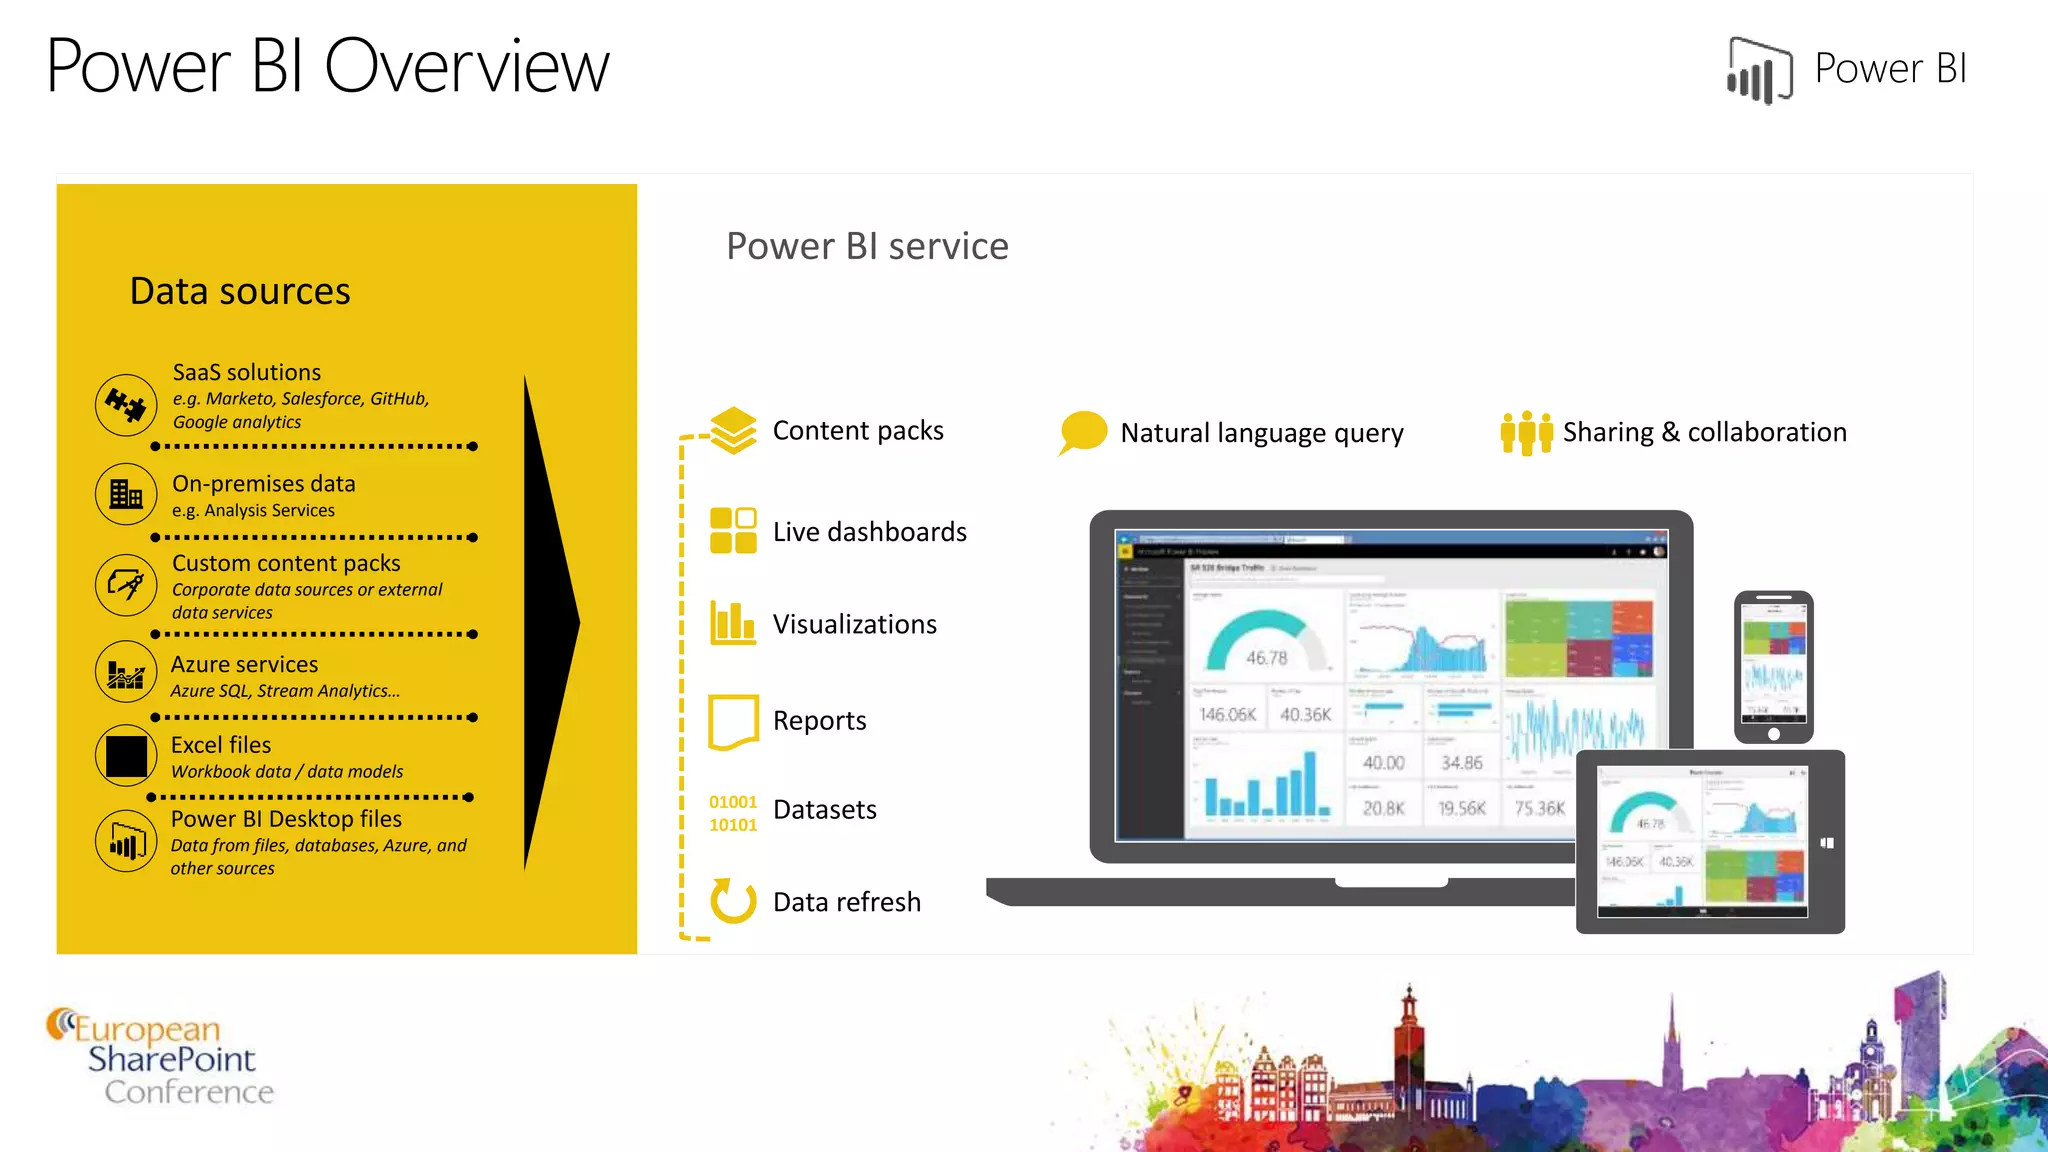
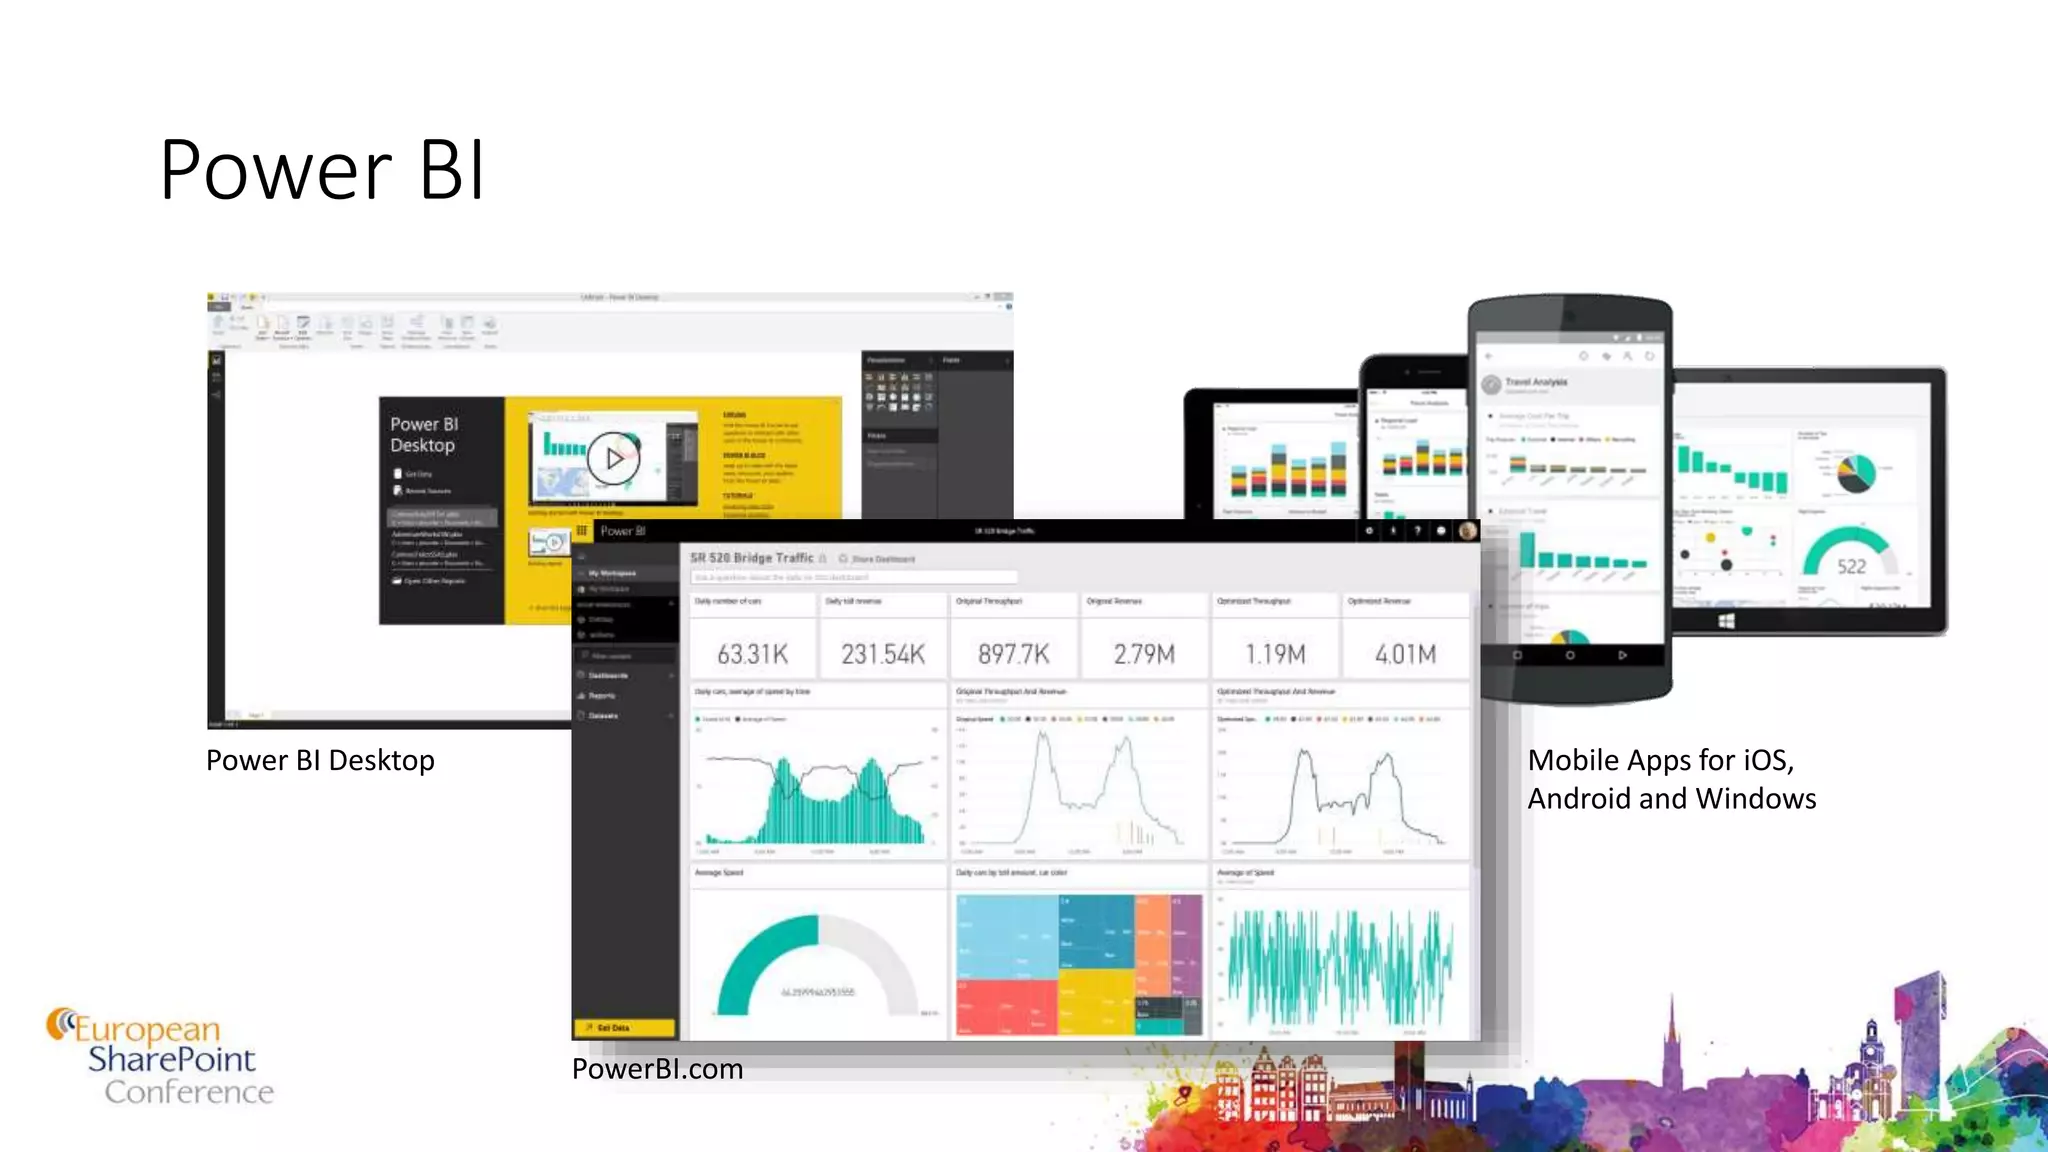
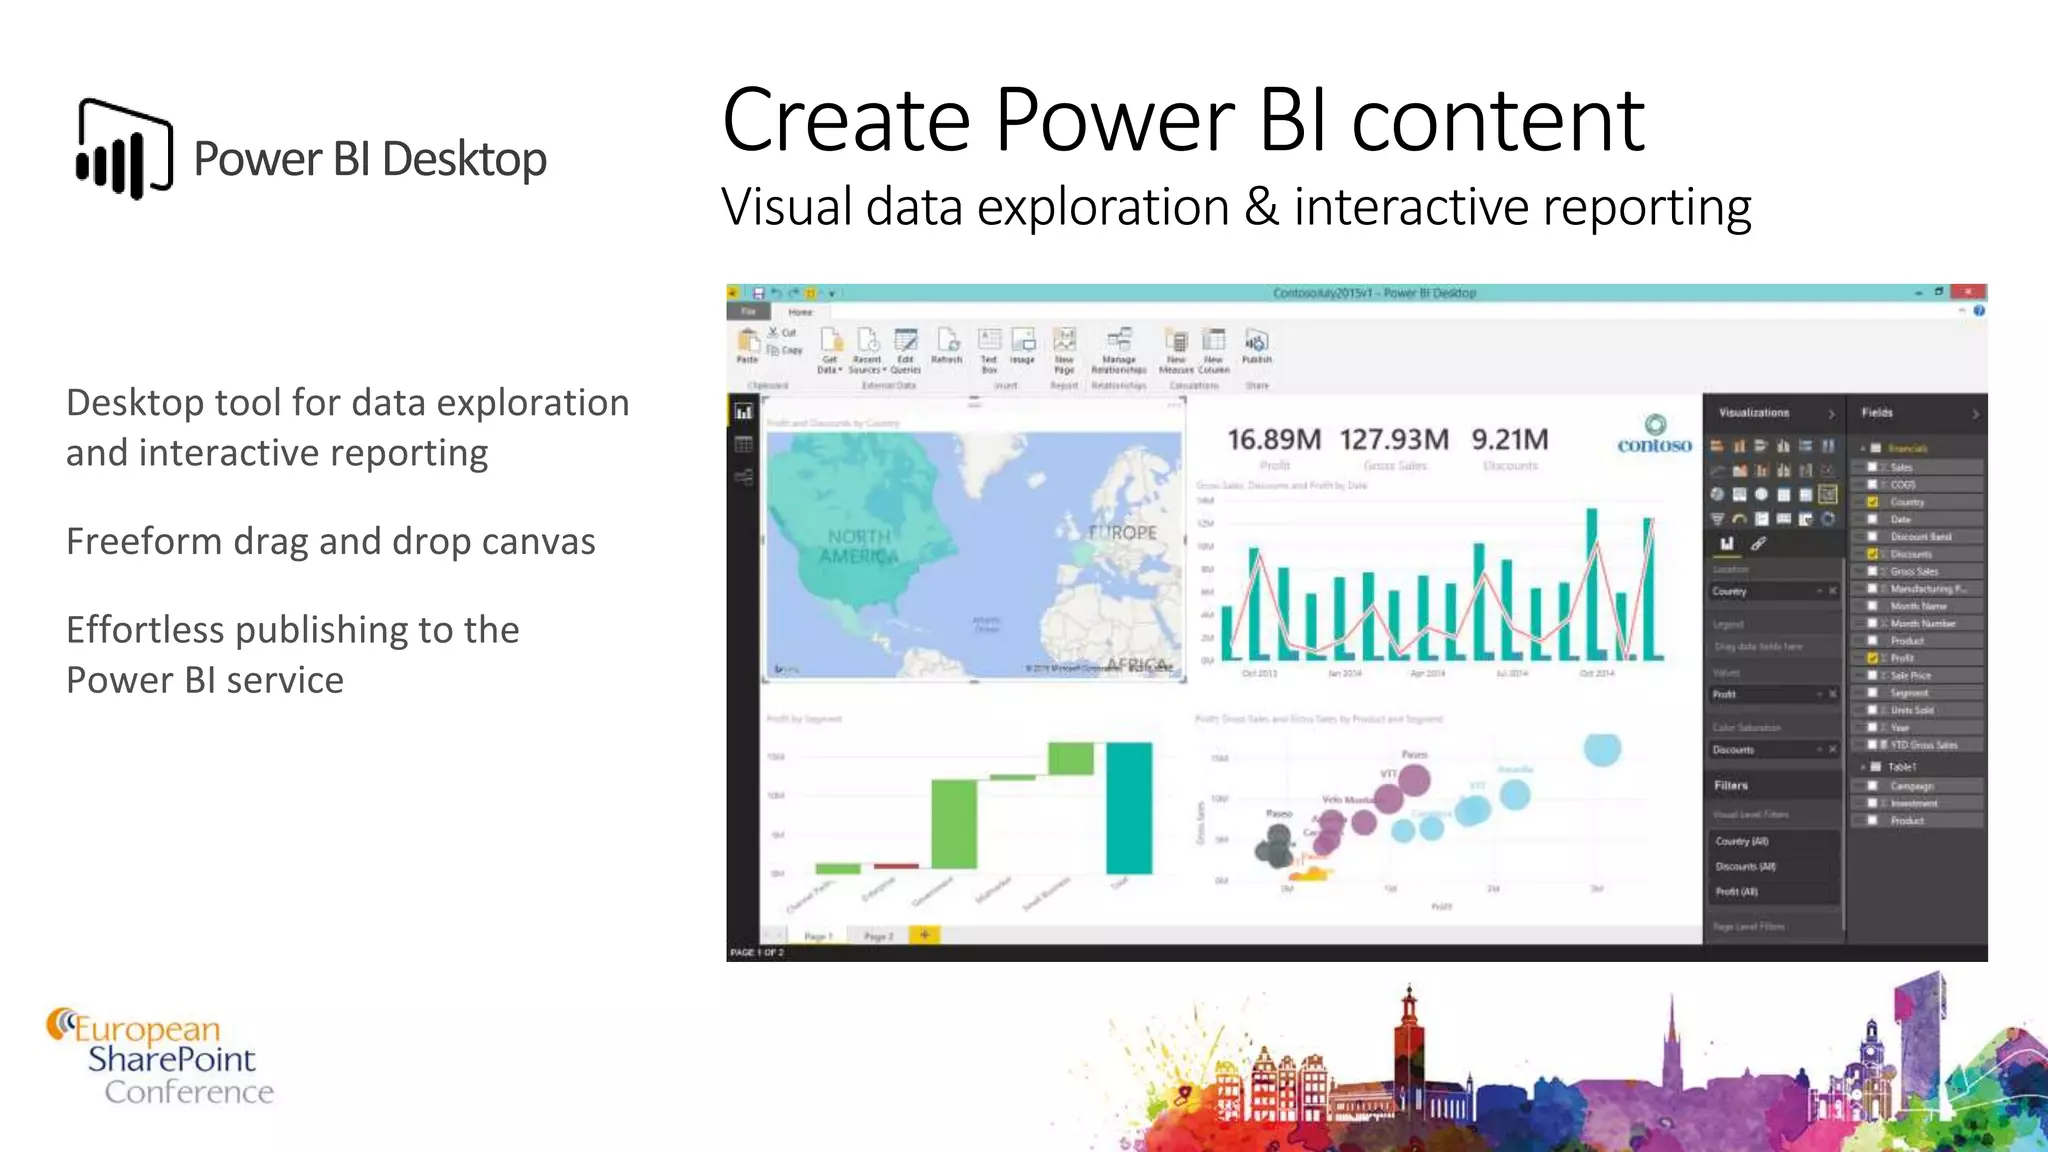
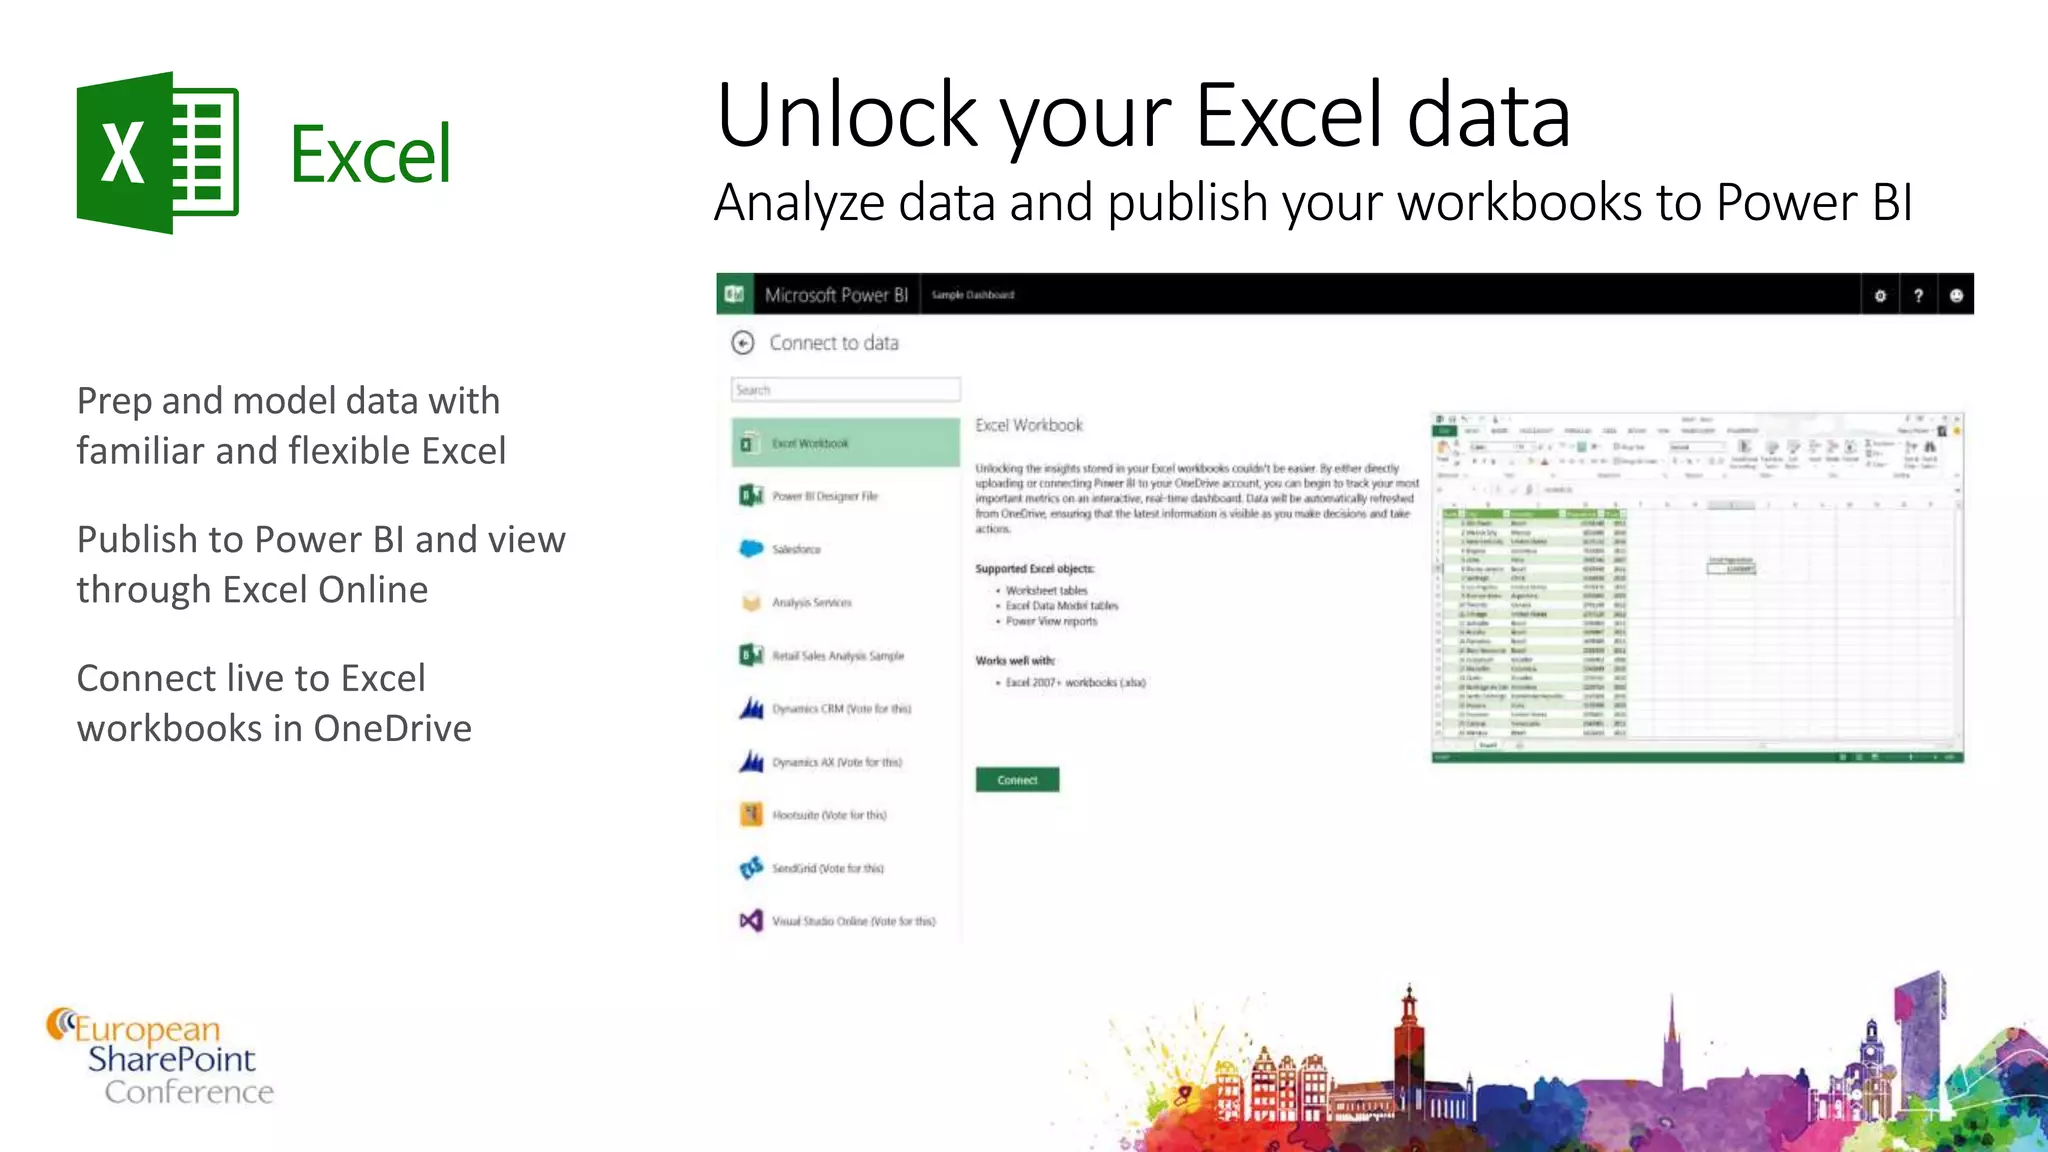
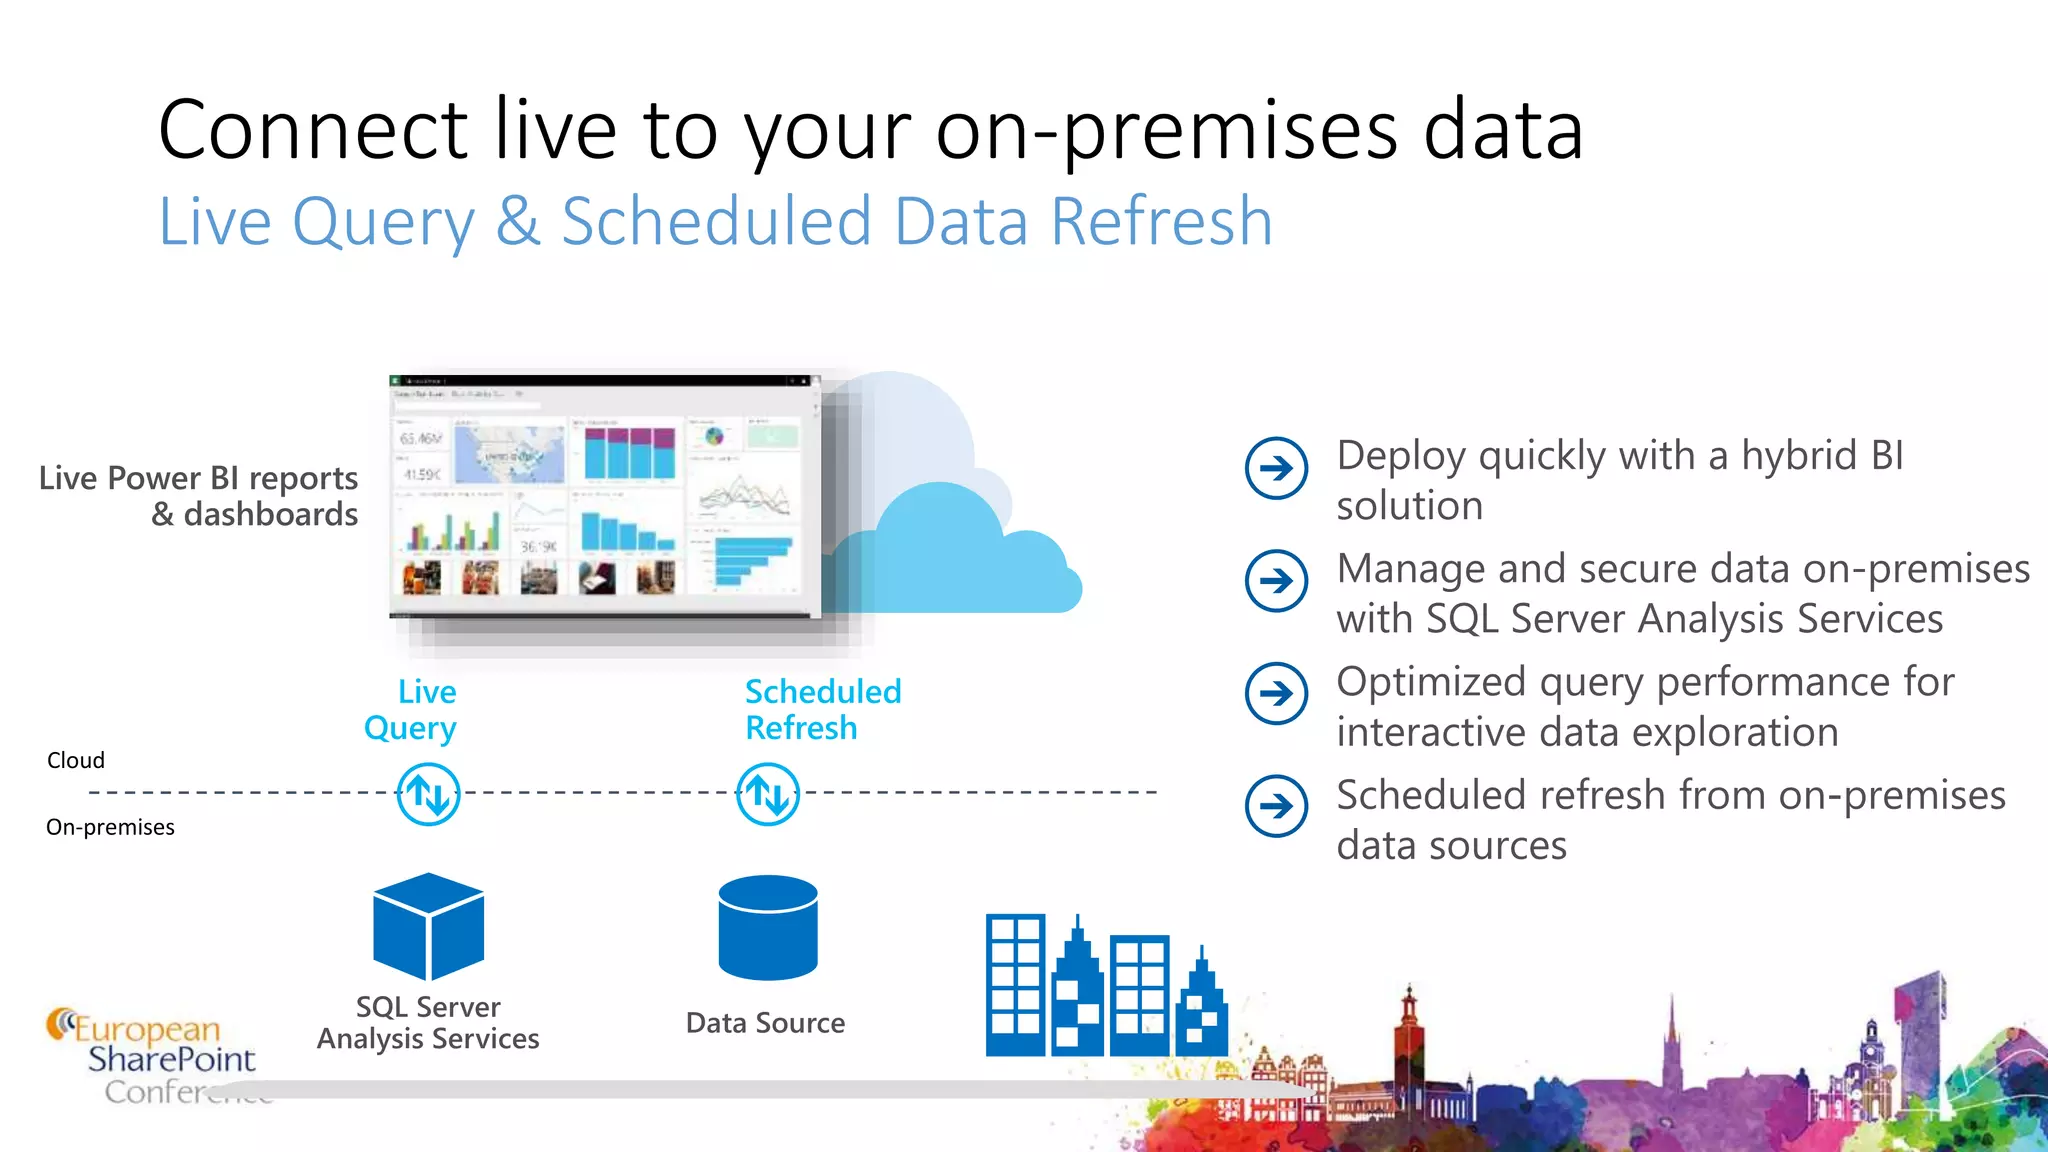
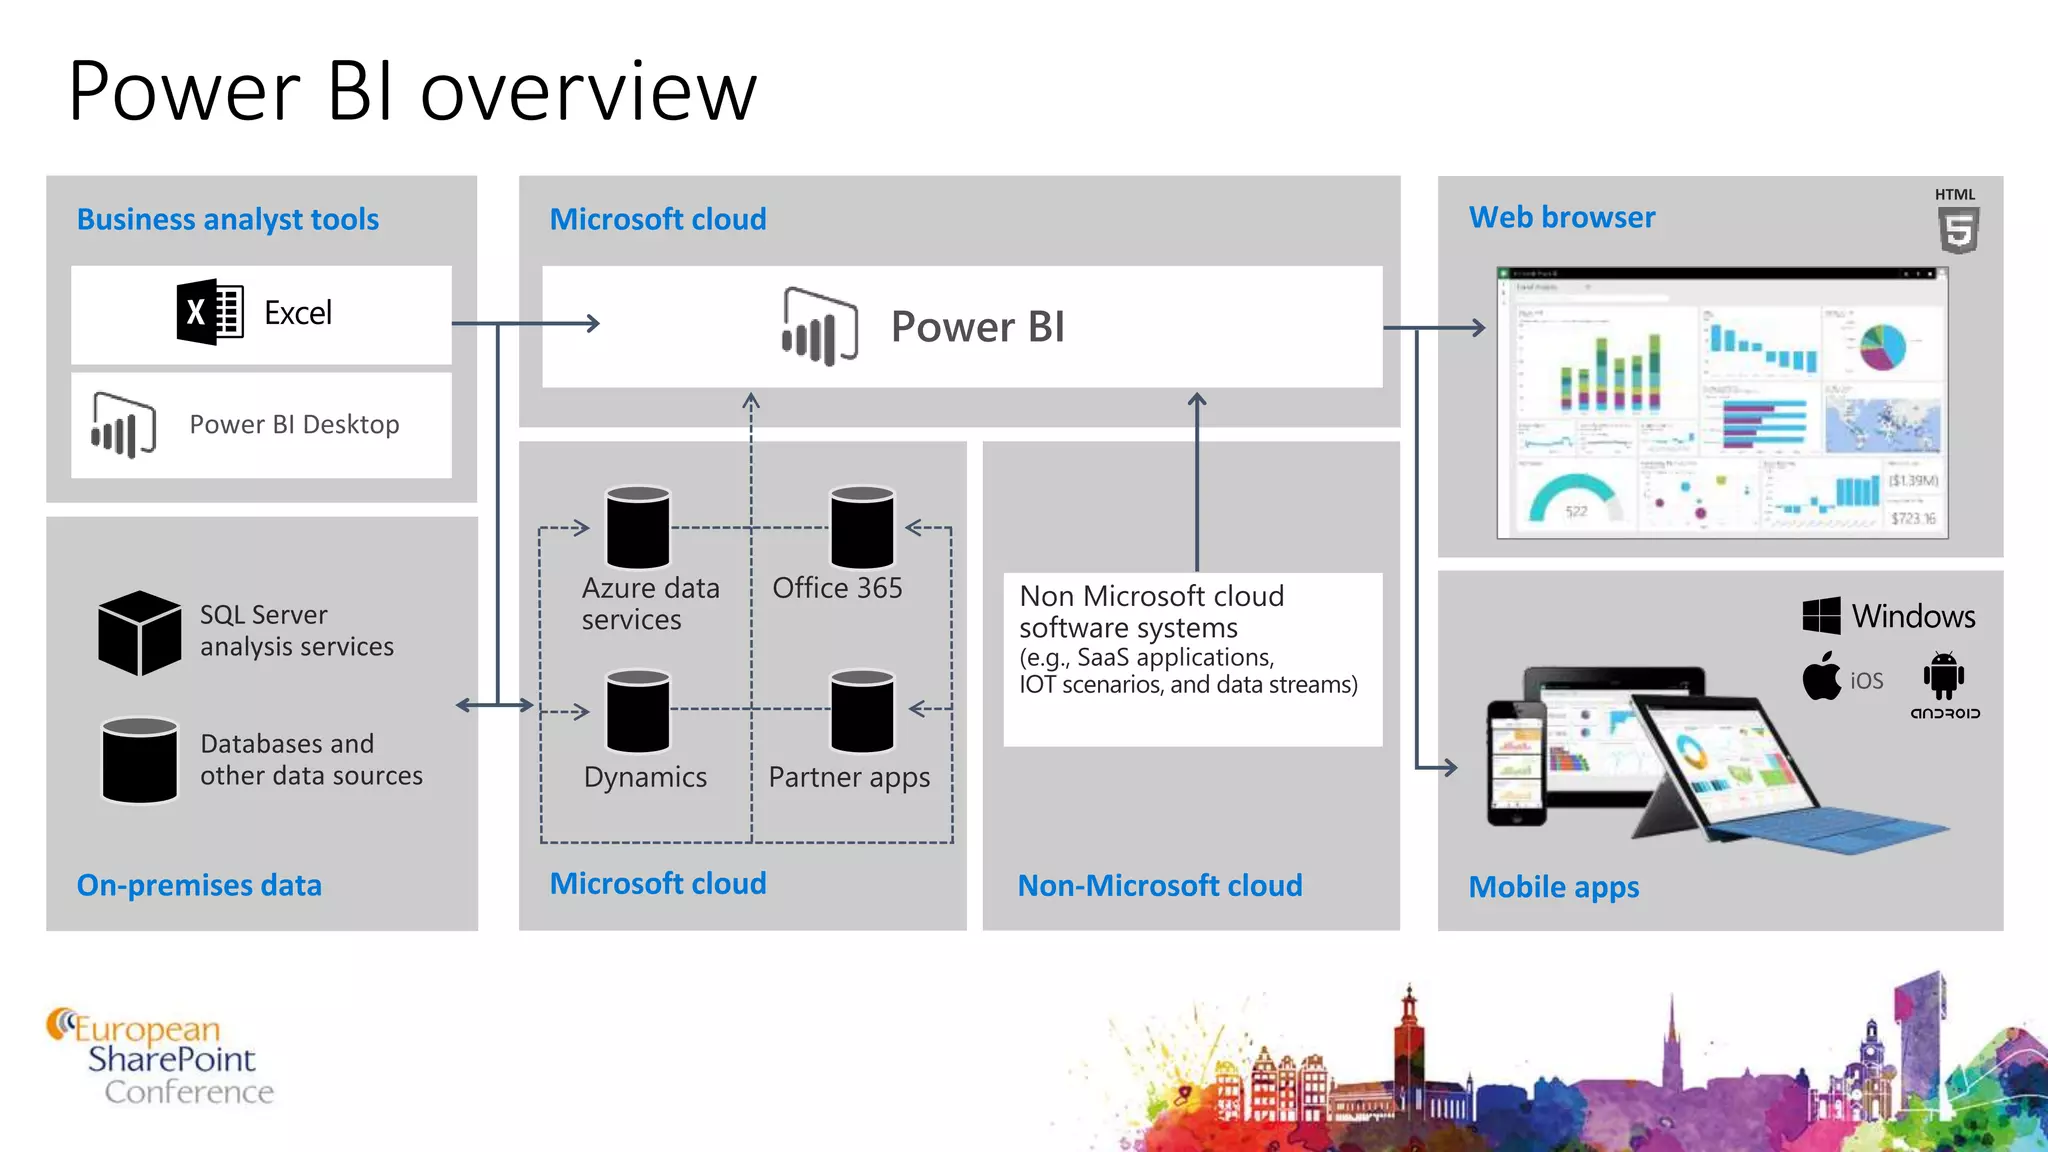
The document discusses the benefits and features of Power BI, a self-service business intelligence tool that enables users to create reports and dashboards without requiring complex infrastructure. It highlights the ease of use, integration with familiar Microsoft products, and rapid deployment, making it suitable for users with varied data sources. Additionally, it outlines key takeaways such as the scalability of PowerPivot and the continuous addition of new features.


