Download to read offline
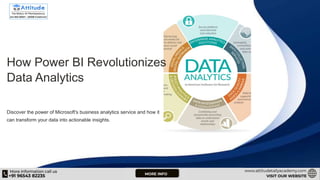

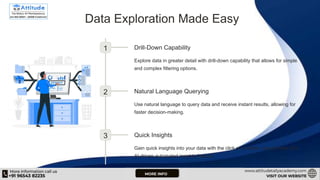

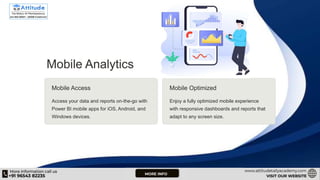

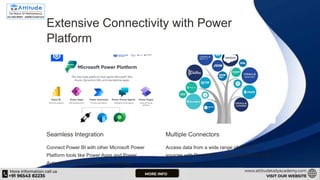
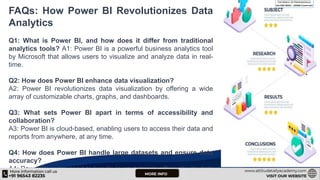


The document discusses how Microsoft Power BI transforms data analytics through features like interactive visualizations, effortless data integration, and advanced data exploration tools. It highlights capabilities such as mobile access, self-service business intelligence, and extensive connectivity with other Microsoft tools, aiming to empower decision-makers with real-time insights. Additionally, the document addresses FAQs that compare Power BI with traditional analytics tools and detail its accessibility and performance with large datasets.