


![Types of Calculations in Power Pivot
21
Calculated Columns
CalculatedFields (Measures)
New Calculationin table which performs calculations on a “row by row” basis (row context)
Example: = ‘Employee’[Fname] & “ “ & ‘Employee’[Lname]
New measure in a table which calculatesan aggregated numeric value (not on "rowby row” basis –filter context)
Example: =TOTALMTD ([SalesUnits], ‘Date’[Datekey])
Created in Power Pivot Modelson the columns
Created in Power PivotModel in the “Calculation area” or in the Power Pivot ribbon menu in excel window
Two type of Calculated Fields
a)Explicit : Defined by the data modeler using DAX
b) Implicit: Uses the “Summarize by” behavior specified in the data model
An Explicit Field canbe further used to define a KPI in the data model](https://image.slidesharecdn.com/powerbioverview-141111052459-conversion-gate02/75/Microsoft-Power-BI-Overview-21-2048.jpg)

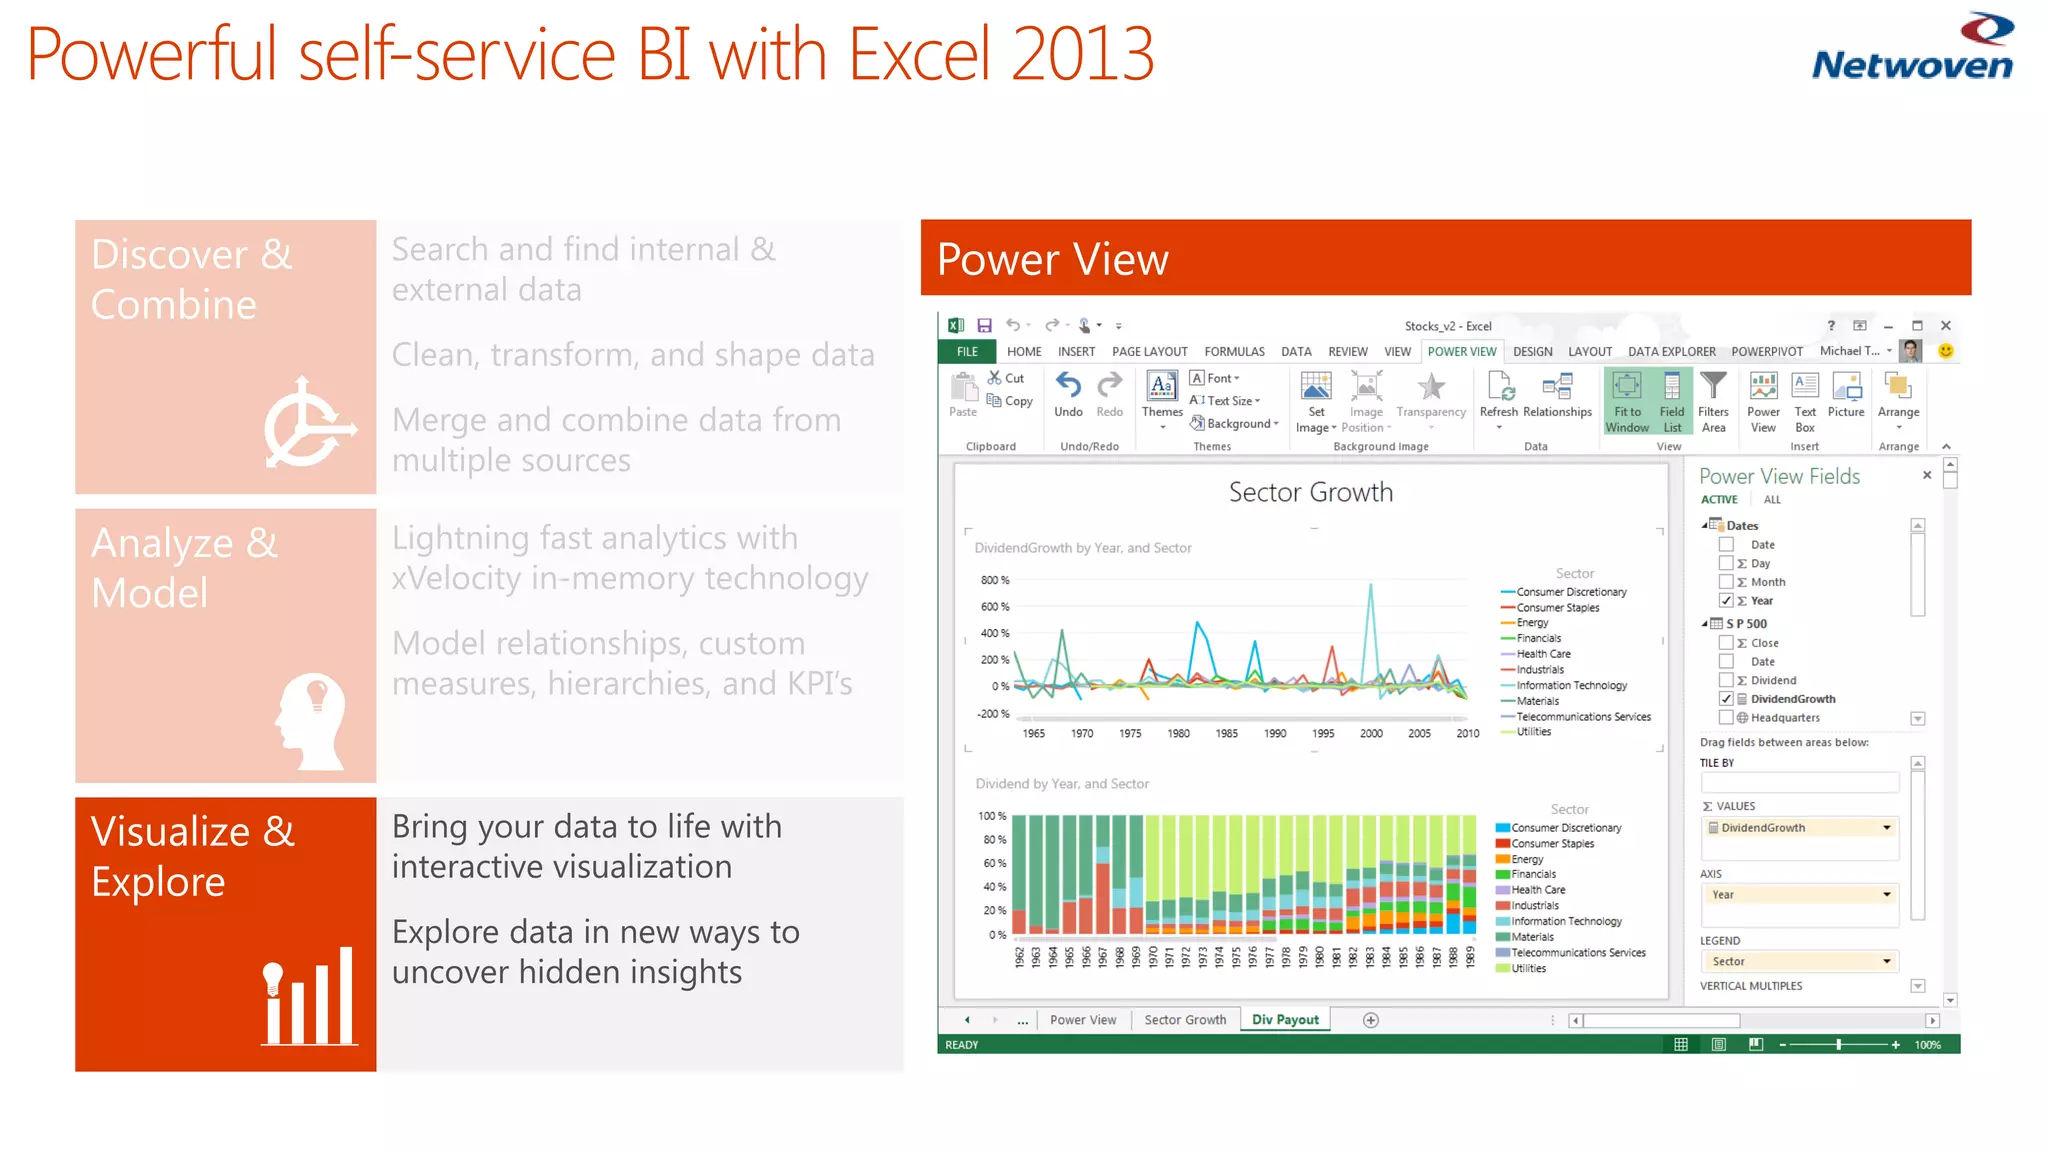


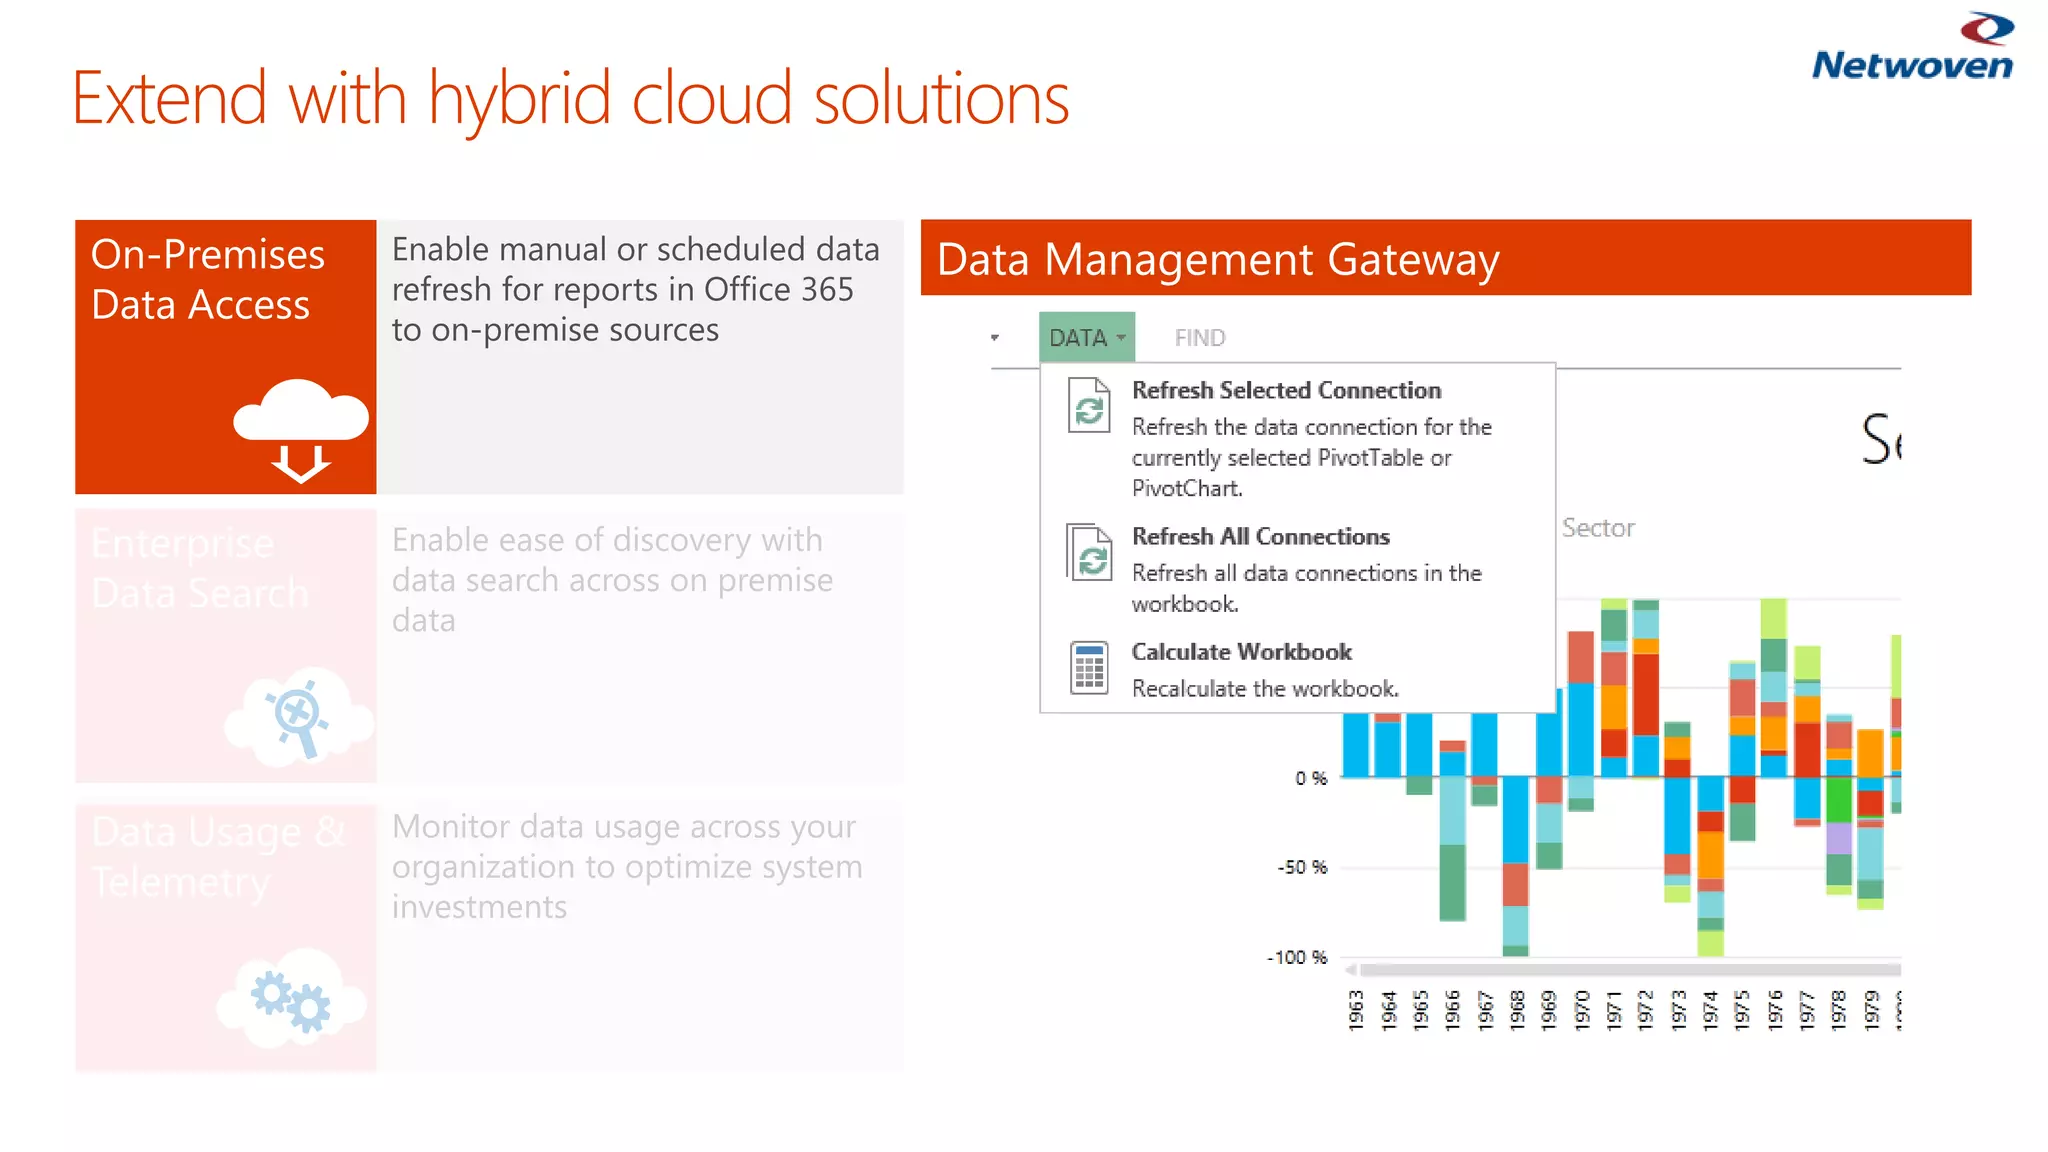
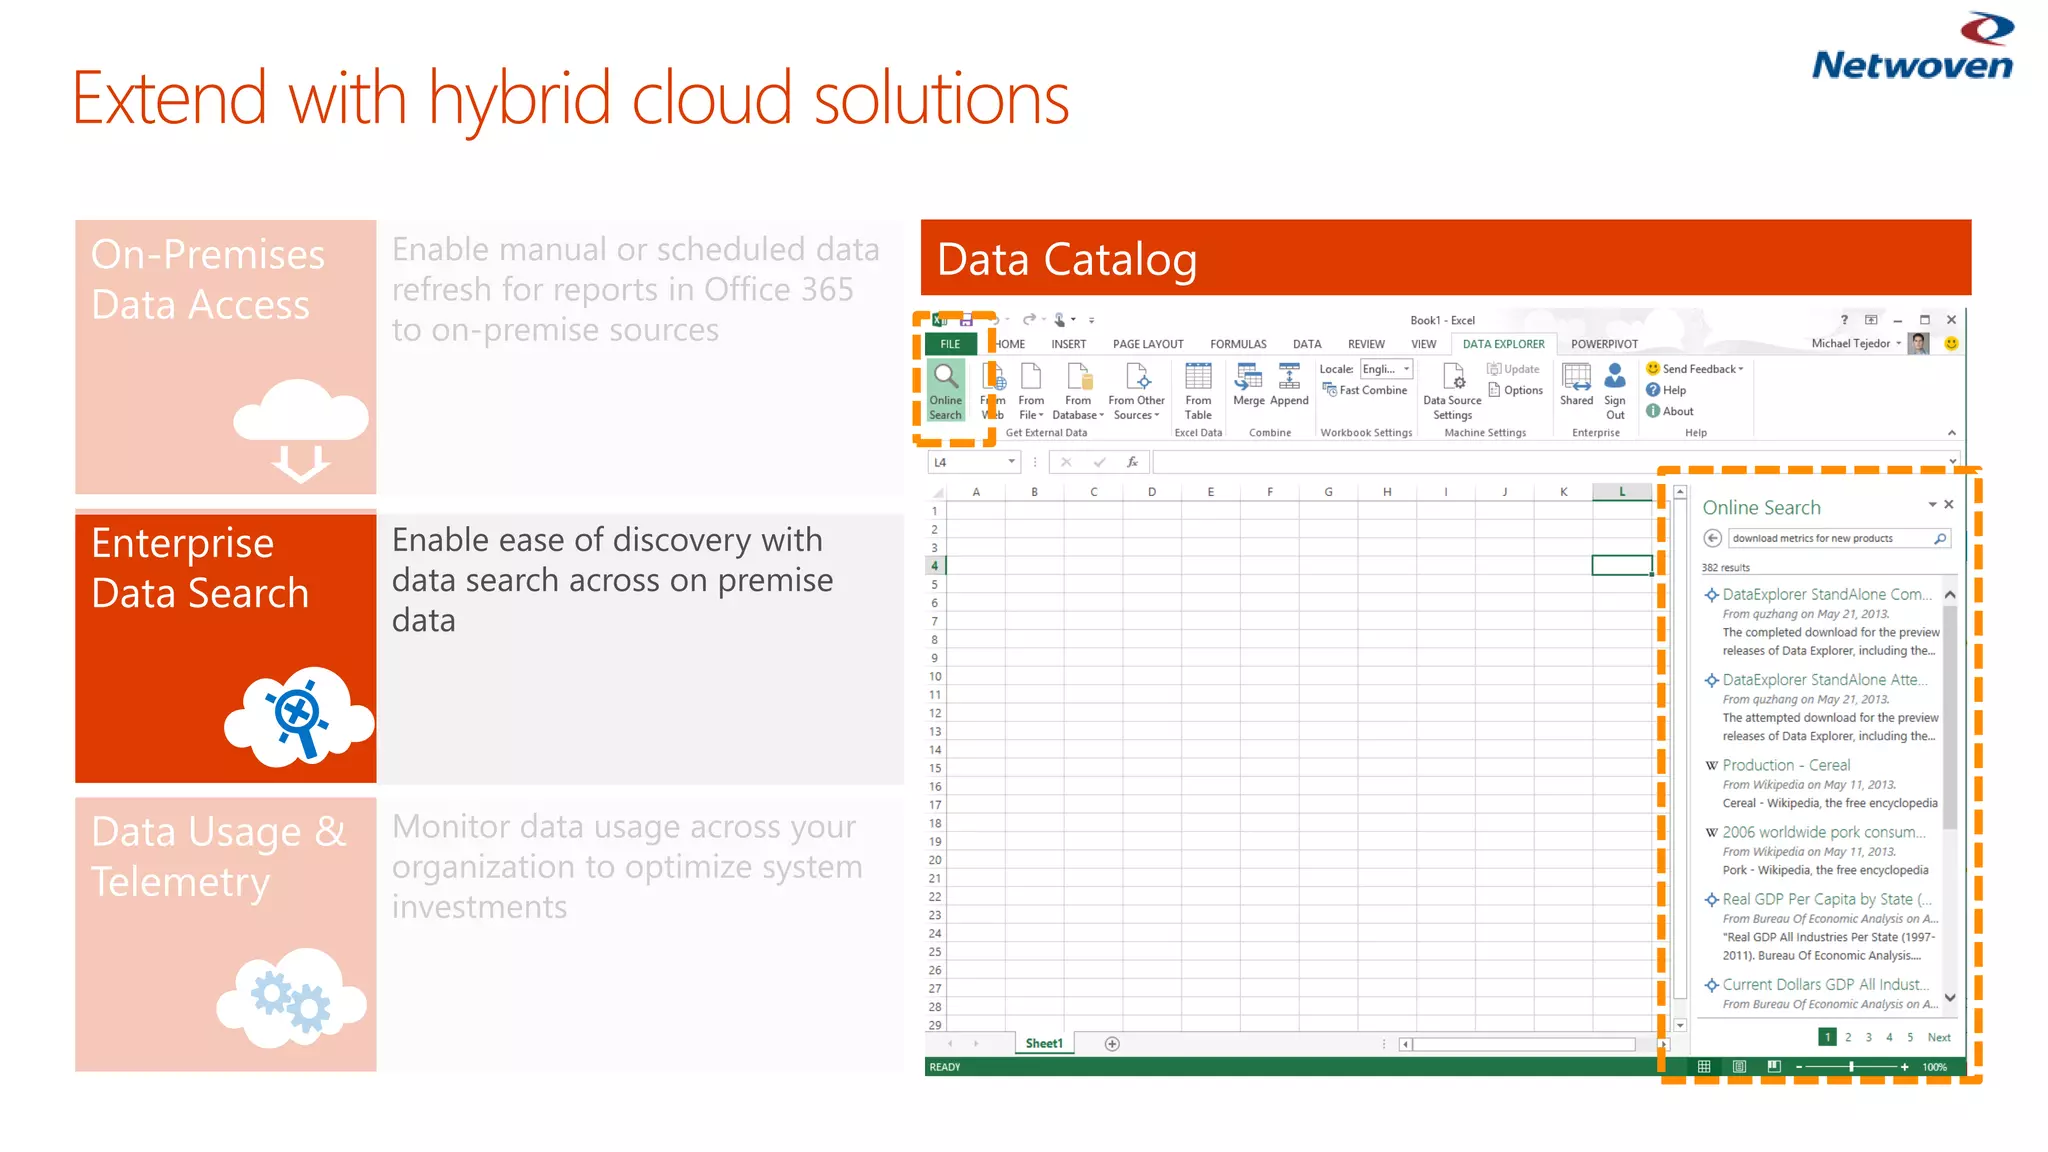
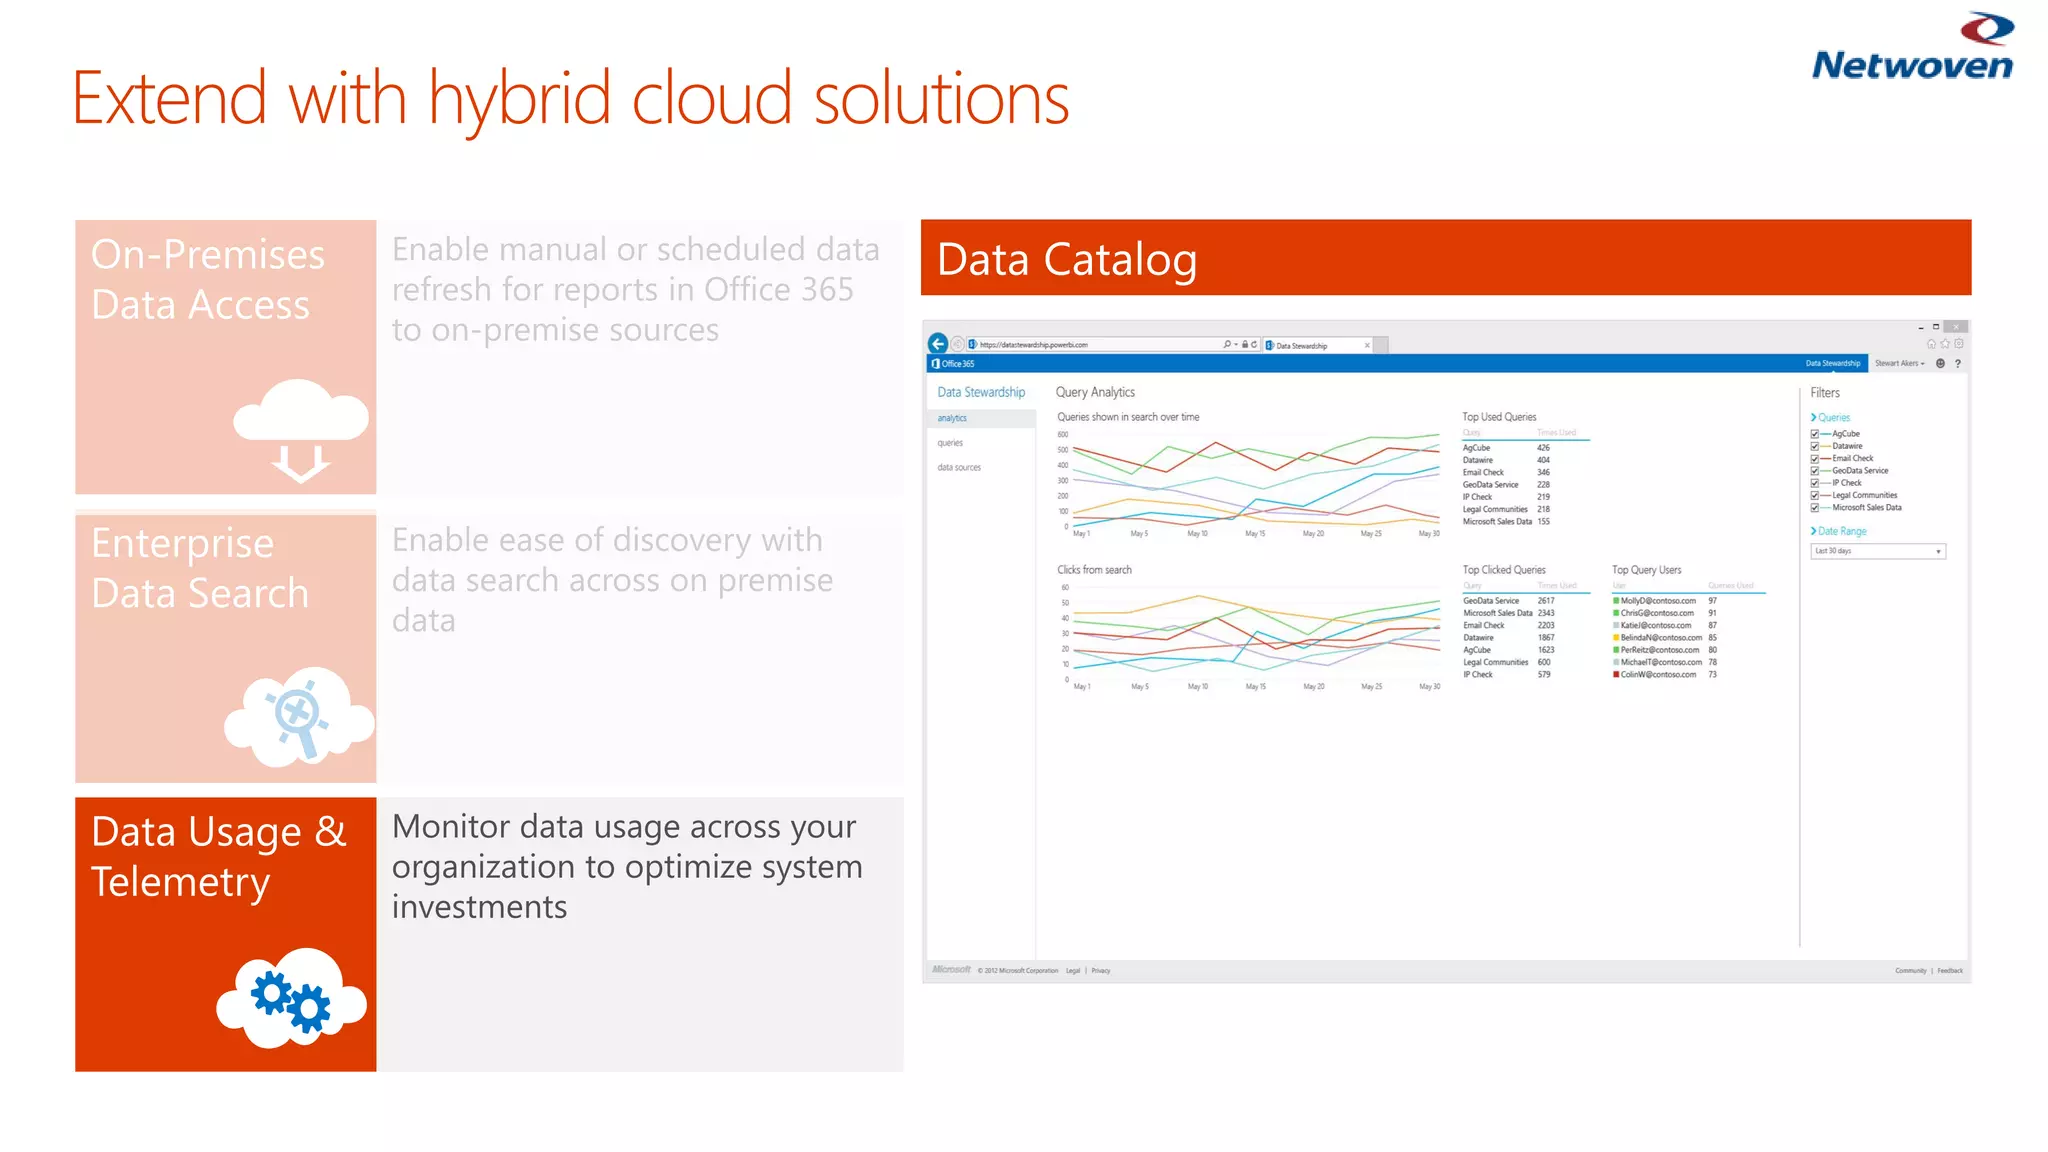


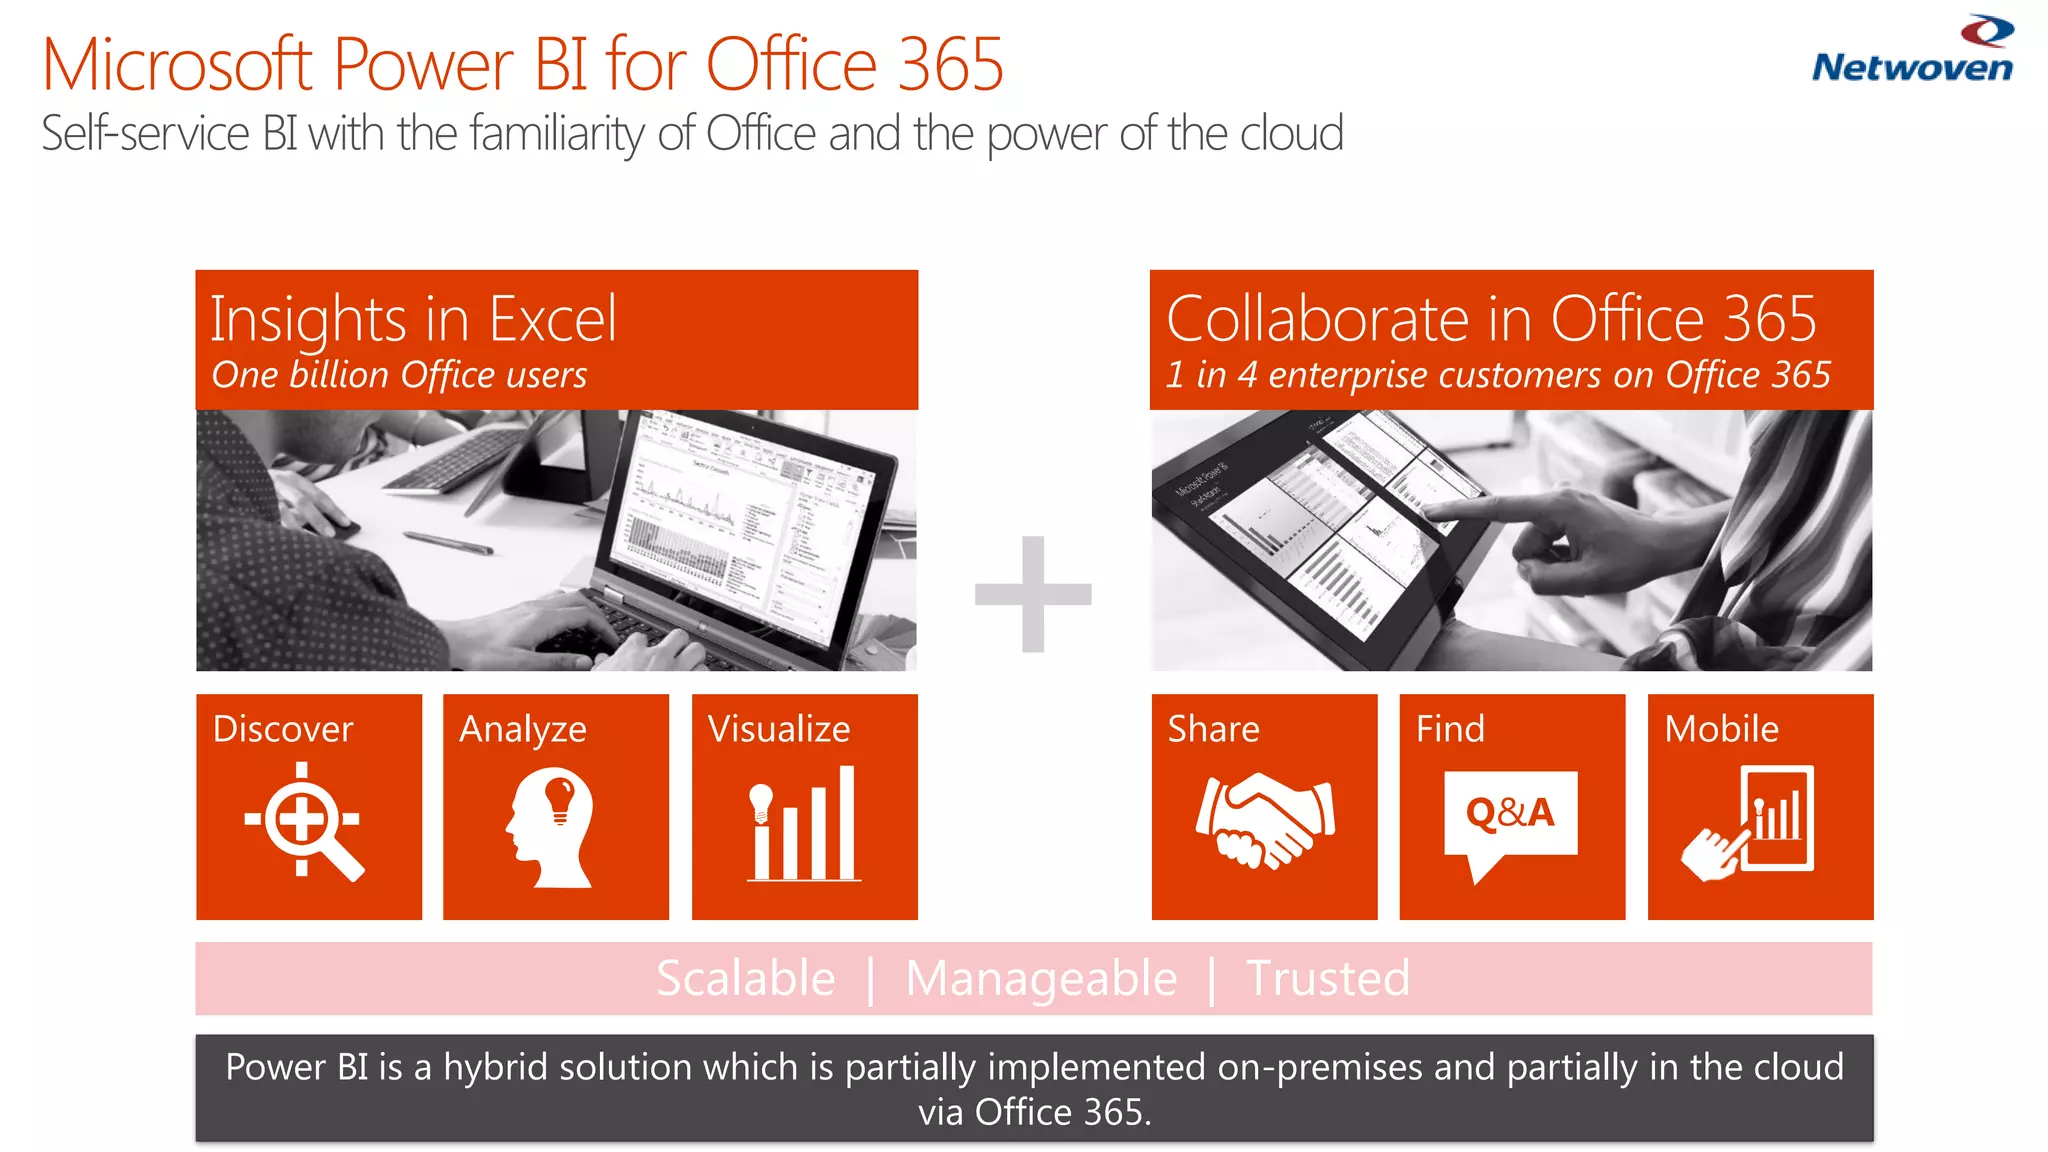
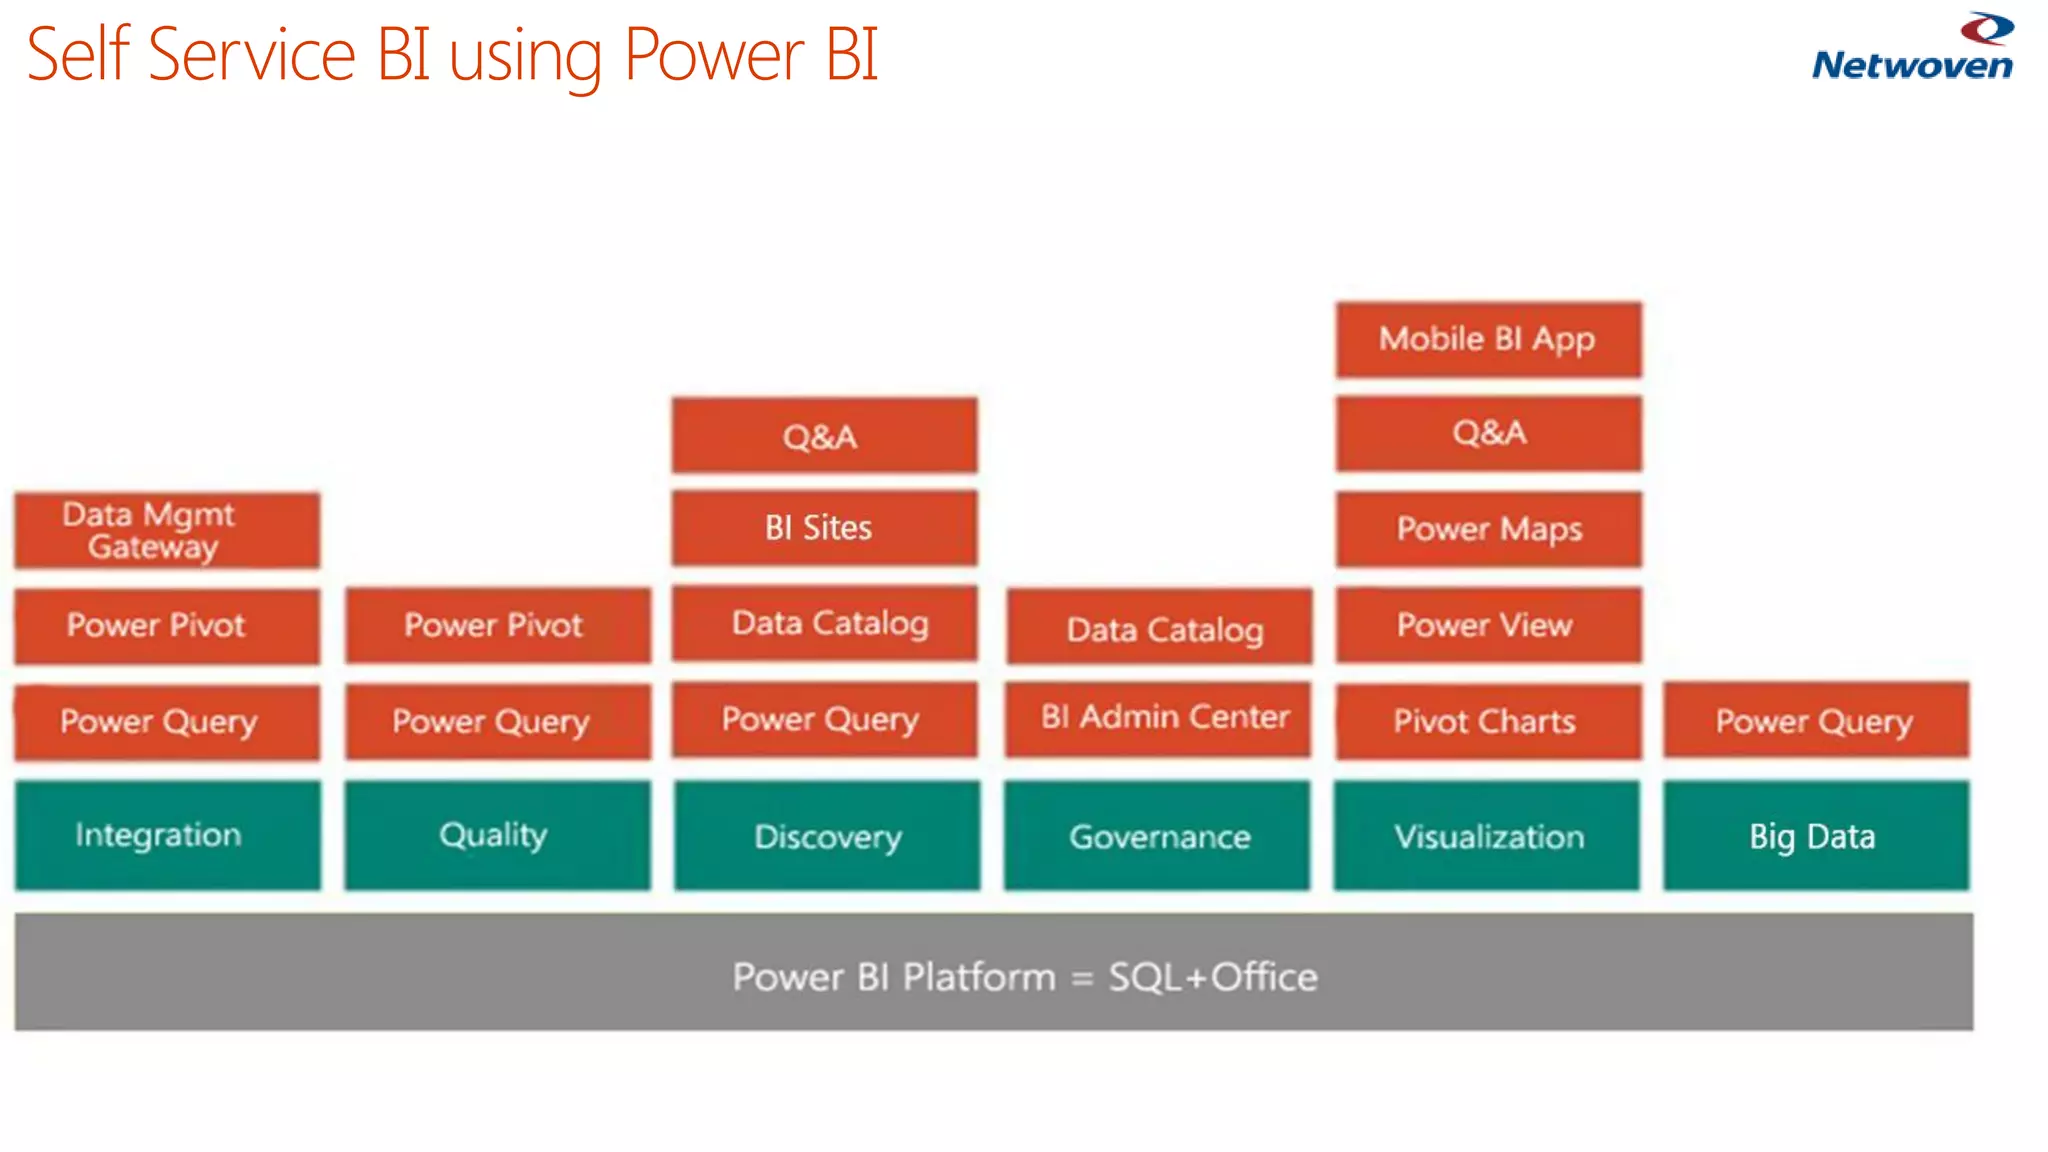
Power BI is a self-service business intelligence tool that allows users to analyze data and create reports and visualizations. It includes components for data discovery, analysis, and visualization both on-premises using Excel and in the cloud using the Power BI service. The tool integrates with Office 365 and allows users to discover, visualize, and share insights from data.


