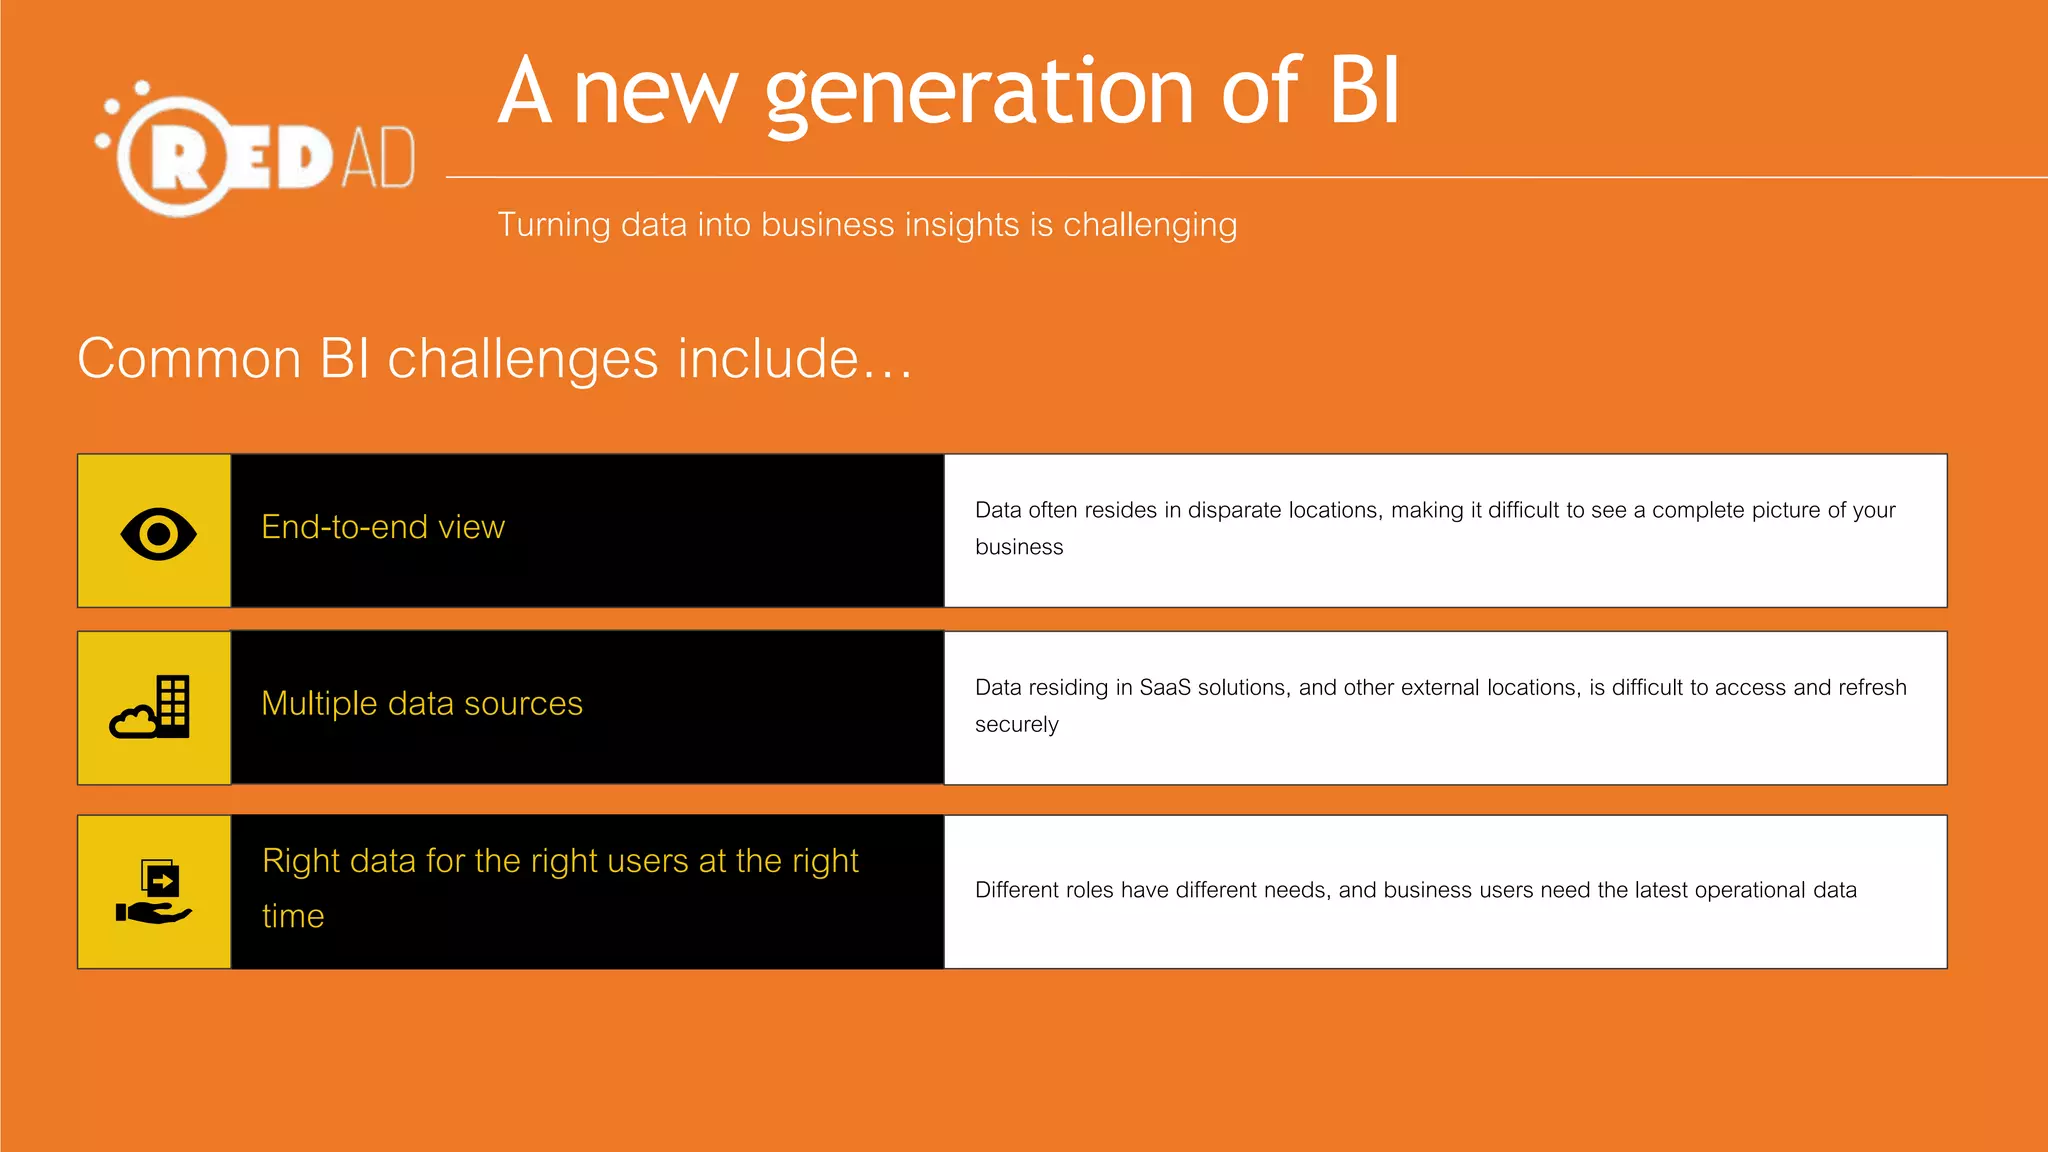
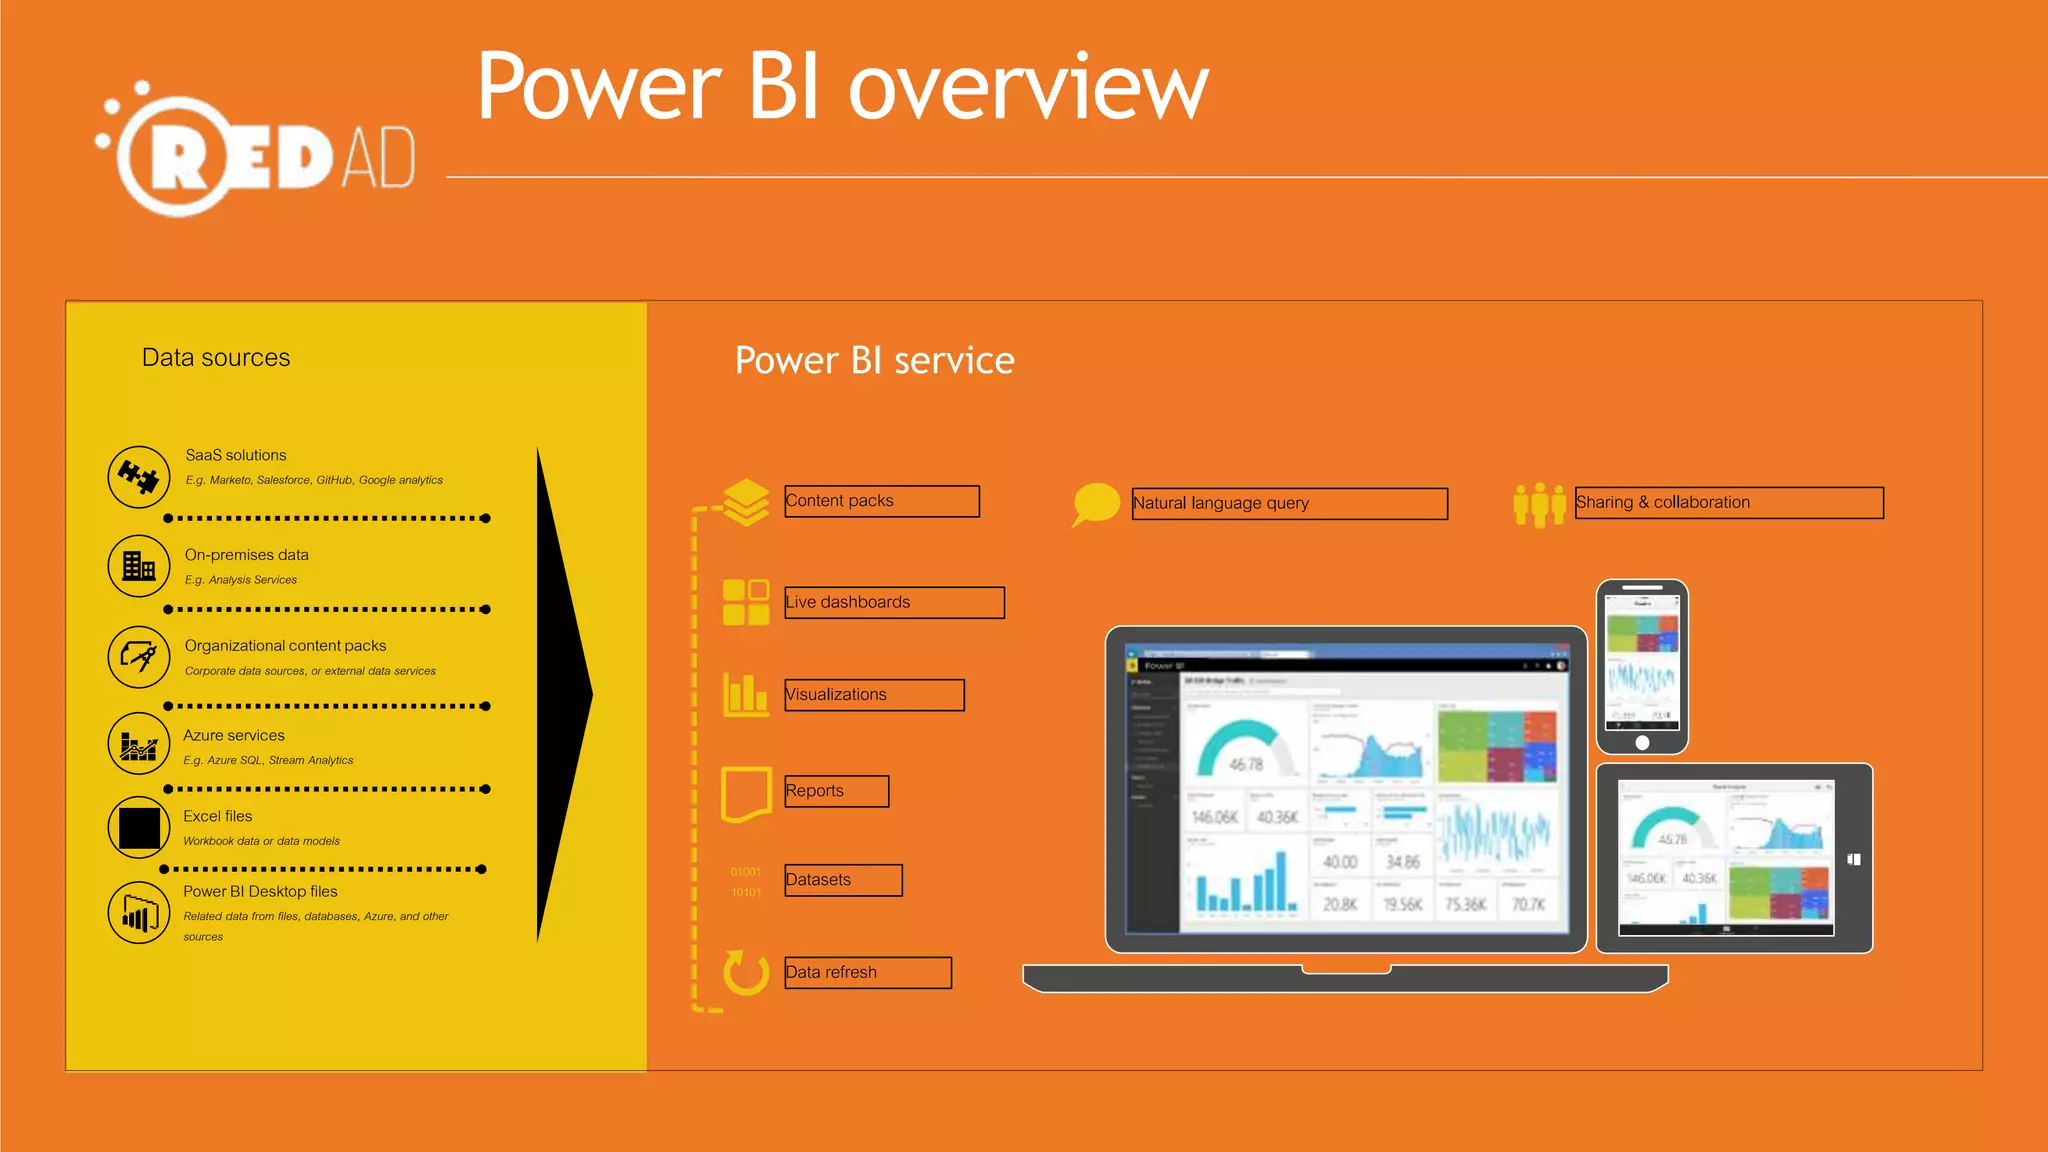
Microsoft Power BI is a business analytics tool that allows users to access, analyze, and visualize data from various sources. It offers self-service BI capabilities that enable end users to explore and gain insights from data. Power BI provides live dashboards, natural language querying, and content packs for popular SaaS solutions. It integrates with Microsoft products and allows sharing and collaboration on reports and dashboards. Signing up for a free Power BI account is quick and only requires a work or school email address.
This slide deck explains in a comprehensive way what Power BI is, how the Power BI architecture looks like and what the usage scenarios are for using Power BI and related tools
BI in the Cloud - Microsoft Power BI Overview and DemoChristopher Foot
RDX Insights Series Presentation focusing on Microsoft Power BI in the cloud. We begin with a high-level overview of the Microsoft BI product suite and discuss the SSIS/SSAS/SSRS tech stack and Power BI. The webinar continues with a deep dive into Power BI and includes instructions on how to use the product to capture, model, analyze and visualize business data. We end the webinar with a Power BI demo highlighting some of its most beneficial and interesting features.
4 slide overview of Microsoft BI & analytics architecture and how it would work with your current environment. See the PointDrive for more information - https://ptdrv.linkedin.com/5fj1ey0
The presentation discusses the different aspects of Power BI like Power BI for O365, Data Discovery, Data Analysis, Data Visualization & Power Maps, Natural Language Search etc.
Its a business analytics solution presented by Netwoven at the Microsoft Power BI workshop held on Oct 30th at SVC Microsoft, Mountain View.
Power BI Overview, Deployment and GovernanceJames Serra
Deploying Power BI in a large enterprise is a complex task, and one that requires a lot of thought and planning. The purpose of this presentation is to help you make your Power BI deployment a success. After a quick Power BI overview, I’ll discuss deployment strategies, common usage scenarios, how to store and refresh data, prototyping options, how to share externally, and then finish with how to administer and secure Power BI. I’ll outline considerations and best practices for achieving an optimal, well-performing, enterprise level Power BI deployment.
ESPC15 Power BI - The New Way to Quickly Build Powerful Dashboards (Level 300)Knut Relbe-Moe [MVP, MCT]
Learn how to use the new Power BI Designer to create powerful reports and dashboards, and how to use the new features of Power BI; Power BI dashboards; Connect live to on-premises Analysis Services models, live connectors to for instance Dynamics or SalesForce, and how to use the Power BI Designer to utilize this. Power BI Designer is a standalone Windows Desktop application that can be downloaded from the Power BI site. This application combines Power Query, Power Pivot Data Model and Power View into a seamless experience that will allow customers to build their Power BI elements in an offline fashion and then upload to the Power BI Service.
In this session you will:
- Learn about Power BI Designer
- Learn how to set up Power BI dashboards
- Learn about Power Query, Power Pivot and Power View
BI: new of the buzz words that everyone is talking about but what is it? How can it be used to make a impact in my organization? How do I get started? In this session, we will talk about it and show you a live example in Office 365's SharePoint Online.
Objectives/Outcomes: In this session, participants will learn:
1. What is BI
2. What is Microsoft's Power BI
3. Case Studies
4. How can I get it
Microsoft Power BI helps you stay up to date with the information that matters to you. With Power BI, dashboards help you keep a finger on the pulse of your business. Your dashboards display tiles that you can click to open reports for exploring further. Connect to multiple data sets to bring all of the relevant data together in one place.
Microsoft Power Stack 2019 [Power BI, Excel, Azure & Friends]Olivier Travers
Making sense of Microsoft's renewed push in the business intelligence sector with:
- Power BI including Power BI Report Server, Premium, Embedded, APIs...
- Excel
- Flow, PowerApps. SharePoint, Teams
- SQL Server
- Azure IaaS / PaaS / SaaS
[Latest update: mid-2019] I have put an inordinate amount of research time to keep this presentation up to date since its original publication in February 2017. The latest version is available upon request for a reasonable fee and for my consulting clients, don't hesitate to contact me to discuss your project.
Olivier Travers
olivier@needlestacker.com
45 mins presentation @ the MVP Cloud RoadShow on April 11, 2015
In preview and recently available in Canada, Power BI. Insights are hiding in your company's data - see the impact of bringing them into focus with Power BI. Let Power BI organize your data. See it all in one place and make better decisions. The metrics you need to run your business on a dashboard. Make confident decisions knowing everyone is on the same page.
A simplified version of my presentation:
- PowerBI solution architecture
- Key steps to visualize data in PowerBI
- PowerBI Demo
- R in PowerBI
- Custom Visuals
- PowerBI Report Server
- Azure services and Power BI
Best practices to deliver data analytics to the business with power biSatya Shyam K Jayanty
Get your data to life with Power BI visualization and insights!
With the changing landscape of Power BI features it is essential to get hold of configuration and deployment practices within your data platform that will ensure you are on-par with compliance & security practices. In this session we will overview from the basics leading into advanced tricks on this landscape:
How to deploy Power BI?
How to implement configuration parameters and package BI features as a part of Office 365 roll out in your organisation?
What are newest features and enhancements on this Power BI landscape?
How to manage on-premise vs on-cloud connectivity?
How can you help and support the Power BI community as well?
Having said that within the objectives of this session, cloud computing is another aspect of this technology made is possible to get data within few clicks and ticks to the end-user. Let us review how to manage & connect on-premise data to cloud capabilities that can offer full advantage of data catalogue capabilities by keeping data secure as per Information Governance standards. Not just with nuts and bolts, performance is another aspect that every Admin is keeping up, let us look into few settings on how to maximize performance to optimize access to data as required. Gain understanding and insight into number of tools that are available for your Business Intelligence needs. There will be a showcase of events to demonstrate where to begin and how to proceed in BI world.
- D BI A Consulting
consulting@dbia.uk
Power BI provides advanced data technology for transforming, storing, and presenting data. This technology can support advanced Excel users and data scientists. This presentation provides basics for Excel 2010 and 2013 users and information about O365 and SharePoint Online supporting shared use cases.
vOffice365 - May 2016 - Overview of Microsoft's Power BI - Sean WallbridgeRegroove
"Power BI Overview - May 2016" Presentation by Sean Wallbridge, Principal Consultant with itgroove and SharePoint Server MVP. Delivered at SharePoint Users Group in Victoria, British Columbia, Canada on May 19, 2016.
"Power BI" is the new hip buzzword in the Office 365 community. You may have seen it pop up in your Office 365 Task Switcher. Want to learn more? Join Sean for an overview of how this business analytics tool is helping organizations bring their data to life.
His presentation covers a brief history of Microsoft's Business Intelligence and an overview of the Power BI Components followed and a live demo of the tool.
Power BI Single Page Applications Boise Code Camp 2017Stuart
Have lots of data? Need a dashboard powered by Microsoft Azure? Love Javascript? Learn how to use Javascript to integrate data-rich user experiences in PowerBI with your existing web applications. Featured for Boise Code Camp 2017.
Power BI for Big Data and the New Look of Big Data SolutionsJames Serra
New features in Power BI give it enterprise tools, but that does not mean it automatically creates an enterprise solution. In this talk we will cover these new features (composite models, aggregations tables, dataflow) as well as Azure Data Lake Store Gen2, and describe the use cases and products of an individual, departmental, and enterprise big data solution. We will also talk about why a data warehouse and cubes still should be part of an enterprise solution, and how a data lake should be organized.
Power BI has in its DNA the goal of enabling everybody to experience their data any way, anywhere—in seconds and at global scale.
Power BI offers a set of capabilities that are uniquely enabled by its global and cloud nature:
The ability to harness data from Excel spreadsheets, on-premises data sources through the data gateway, big data, streaming data, and cloud services. It doesn’t matter what type of data you want or where it lives, Power BI allows you to connect to hundreds of data sources.
Out-of-the box SaaS content packs that deliver a curated experience with pre-built dashboards to get you up and running quickly. We have hundreds of ISVs building content packs to cater to the needs of millions of Power BI users.
Unmatched, unique ways for users to experience their data with speed and agility:
Live dashboards that maintain a real-time pulse on the business and provide critical insights.
Natural language query that enables users to simply and intuitively ask questions of their data, including through Cortana.
Custom visuals that bring data to life and surface intelligence hidden in the sea of data, with our community leveraging the Power BI visualization stack to create new ways to visualize data in a way that makes more sense. (Now available in the Office store.)
Integration of Power BI with the Microsoft stack. Power BI is part of larger ecosystem that integrates with services like Microsoft Teams, Office 365, and Dynamics 365. These services are aware of Power BI, are wired to Power BI, and enable you to use Power BI in the context of your work.
Anywhere access to insights. Whether in the office or on-the-go, Power BI provides anywhere access to insights with dashboards accessible via the desktop, on the web, or across mobile devices. Inside Excel, embedded—we have hundreds of ISVs embedding Power BI in their offerings.
Power BI Create lightning fast dashboard with power bi & Its Components Vishal Pawar
Every data has meaning, but we had limitation to use data through big long running process Extraction, Transformation and Representation, but now Power BI solves your problem to kick start having Data extraction in Power Query, Data Modelling and Transformation in Power Pivot and reach data representation using power view and power map on demand any nearby device on your fingertips, You will learn all latest and greatest features of Power BI.
BI: new of the buzz words that everyone is talking about but what is it? How can it be used to make a impact in my organization? How do I get started? This session was delivered for SharePoint Saturday Reston.
Microsoft Power BI | Brief Introduction | PPTSophia Smith
What is Power BI?
Microsoft Power BI is one of the most powerful data visualization software. It empowers the organizations with their tools and help the users to transform their raw data into valuable information. Let's have a look on How Power BI helps to your business.
Business intelligence dashboards and data visualizations serve as a launching point for better business decision making. Learn how you can leverage Power BI to easily build reports and dashboards with interactive visualizations.
Microsoft Power BI is a popular business intelligence tool. Businesses use it all over the world for data visualisation and analysis. Microsoft Power BI tools enable better decision-making to avoid losses.
Groupby -Power bi dashboard in hour by vishal pawar-Presentation Vishal Pawar
Power BI Dashboard in an hour with Various Slides.
Target Audience:
Useful for Develops and DBA those who want to know what is Power BI and How we can utilize various features.
Also session will be useful for anyone who wants learn Power BI from basic.
Abstract:
In this session, We will walk through various features of Power BI, How Power BI can transform your company’s data into rich visuals and Easy yet powerful Analytics solutions for your whole organization.
At end of session with following Power BI Dashboard example
sp_Blitz in Dashboard
SQL Server Info Dashboard
Twitter Dashboard
World Dashboard
Most important takeaways from session –
You will be learning basics of Power BI with the additional perk of analyzing sp_Blitz in Power BI.
Various features of Power BI making you from ZERO to HERO
After this session, you will be able to analyze data into Power BI
Power BI has become a product with a ton of exciting features. This presentation will give an overview of some of them, including Power BI Desktop, Power BI service, what’s new, integration with other services, Power BI premium, and administration.
24HOP - Português - Resource Governor no SQL Server 2014Marcos Freccia
Webcast para o 24 Horas de PASS 2014 realizados entre os dias 07 e 08 de Outubro. Nesse webcast foram apresentados os novos recursos do Resource Governor no SQL Server 2014
Connector Corner: Automate dynamic content and events by pushing a buttonDianaGray10
Here is something new! In our next Connector Corner webinar, we will demonstrate how you can use a single workflow to:
Create a campaign using Mailchimp with merge tags/fields
Send an interactive Slack channel message (using buttons)
Have the message received by managers and peers along with a test email for review
But there’s more:
In a second workflow supporting the same use case, you’ll see:
Your campaign sent to target colleagues for approval
If the “Approve” button is clicked, a Jira/Zendesk ticket is created for the marketing design team
But—if the “Reject” button is pushed, colleagues will be alerted via Slack message
Join us to learn more about this new, human-in-the-loop capability, brought to you by Integration Service connectors.
And...
Speakers:
Akshay Agnihotri, Product Manager
Charlie Greenberg, Host
Builder.ai Founder Sachin Dev Duggal's Strategic Approach to Create an Innova...Ramesh Iyer
In today's fast-changing business world, Companies that adapt and embrace new ideas often need help to keep up with the competition. However, fostering a culture of innovation takes much work. It takes vision, leadership and willingness to take risks in the right proportion. Sachin Dev Duggal, co-founder of Builder.ai, has perfected the art of this balance, creating a company culture where creativity and growth are nurtured at each stage.
GDG Cloud Southlake #33: Boule & Rebala: Effective AppSec in SDLC using Deplo...James Anderson
Effective Application Security in Software Delivery lifecycle using Deployment Firewall and DBOM
The modern software delivery process (or the CI/CD process) includes many tools, distributed teams, open-source code, and cloud platforms. Constant focus on speed to release software to market, along with the traditional slow and manual security checks has caused gaps in continuous security as an important piece in the software supply chain. Today organizations feel more susceptible to external and internal cyber threats due to the vast attack surface in their applications supply chain and the lack of end-to-end governance and risk management.
The software team must secure its software delivery process to avoid vulnerability and security breaches. This needs to be achieved with existing tool chains and without extensive rework of the delivery processes. This talk will present strategies and techniques for providing visibility into the true risk of the existing vulnerabilities, preventing the introduction of security issues in the software, resolving vulnerabilities in production environments quickly, and capturing the deployment bill of materials (DBOM).
Speakers:
Bob Boule
Robert Boule is a technology enthusiast with PASSION for technology and making things work along with a knack for helping others understand how things work. He comes with around 20 years of solution engineering experience in application security, software continuous delivery, and SaaS platforms. He is known for his dynamic presentations in CI/CD and application security integrated in software delivery lifecycle.
Gopinath Rebala
Gopinath Rebala is the CTO of OpsMx, where he has overall responsibility for the machine learning and data processing architectures for Secure Software Delivery. Gopi also has a strong connection with our customers, leading design and architecture for strategic implementations. Gopi is a frequent speaker and well-known leader in continuous delivery and integrating security into software delivery.
JMeter webinar - integration with InfluxDB and GrafanaRTTS
Watch this recorded webinar about real-time monitoring of application performance. See how to integrate Apache JMeter, the open-source leader in performance testing, with InfluxDB, the open-source time-series database, and Grafana, the open-source analytics and visualization application.
In this webinar, we will review the benefits of leveraging InfluxDB and Grafana when executing load tests and demonstrate how these tools are used to visualize performance metrics.
Length: 30 minutes
Session Overview
-------------------------------------------
During this webinar, we will cover the following topics while demonstrating the integrations of JMeter, InfluxDB and Grafana:
- What out-of-the-box solutions are available for real-time monitoring JMeter tests?
- What are the benefits of integrating InfluxDB and Grafana into the load testing stack?
- Which features are provided by Grafana?
- Demonstration of InfluxDB and Grafana using a practice web application
To view the webinar recording, go to:
https://www.rttsweb.com/jmeter-integration-webinar
DevOps and Testing slides at DASA ConnectKari Kakkonen
My and Rik Marselis slides at 30.5.2024 DASA Connect conference. We discuss about what is testing, then what is agile testing and finally what is Testing in DevOps. Finally we had lovely workshop with the participants trying to find out different ways to think about quality and testing in different parts of the DevOps infinity loop.
GraphRAG is All You need? LLM & Knowledge GraphGuy Korland
Guy Korland, CEO and Co-founder of FalkorDB, will review two articles on the integration of language models with knowledge graphs.
1. Unifying Large Language Models and Knowledge Graphs: A Roadmap.
https://arxiv.org/abs/2306.08302
2. Microsoft Research's GraphRAG paper and a review paper on various uses of knowledge graphs:
https://www.microsoft.com/en-us/research/blog/graphrag-unlocking-llm-discovery-on-narrative-private-data/
Key Trends Shaping the Future of Infrastructure.pdfCheryl Hung
Keynote at DIGIT West Expo, Glasgow on 29 May 2024.
Cheryl Hung, ochery.com
Sr Director, Infrastructure Ecosystem, Arm.
The key trends across hardware, cloud and open-source; exploring how these areas are likely to mature and develop over the short and long-term, and then considering how organisations can position themselves to adapt and thrive.
Elevating Tactical DDD Patterns Through Object CalisthenicsDorra BARTAGUIZ
After immersing yourself in the blue book and its red counterpart, attending DDD-focused conferences, and applying tactical patterns, you're left with a crucial question: How do I ensure my design is effective? Tactical patterns within Domain-Driven Design (DDD) serve as guiding principles for creating clear and manageable domain models. However, achieving success with these patterns requires additional guidance. Interestingly, we've observed that a set of constraints initially designed for training purposes remarkably aligns with effective pattern implementation, offering a more ‘mechanical’ approach. Let's explore together how Object Calisthenics can elevate the design of your tactical DDD patterns, offering concrete help for those venturing into DDD for the first time!
Software Delivery At the Speed of AI: Inflectra Invests In AI-Powered QualityInflectra
In this insightful webinar, Inflectra explores how artificial intelligence (AI) is transforming software development and testing. Discover how AI-powered tools are revolutionizing every stage of the software development lifecycle (SDLC), from design and prototyping to testing, deployment, and monitoring.
Learn about:
• The Future of Testing: How AI is shifting testing towards verification, analysis, and higher-level skills, while reducing repetitive tasks.
• Test Automation: How AI-powered test case generation, optimization, and self-healing tests are making testing more efficient and effective.
• Visual Testing: Explore the emerging capabilities of AI in visual testing and how it's set to revolutionize UI verification.
• Inflectra's AI Solutions: See demonstrations of Inflectra's cutting-edge AI tools like the ChatGPT plugin and Azure Open AI platform, designed to streamline your testing process.
Whether you're a developer, tester, or QA professional, this webinar will give you valuable insights into how AI is shaping the future of software delivery.
LF Energy Webinar: Electrical Grid Modelling and Simulation Through PowSyBl -...DanBrown980551
Do you want to learn how to model and simulate an electrical network from scratch in under an hour?
Then welcome to this PowSyBl workshop, hosted by Rte, the French Transmission System Operator (TSO)!
During the webinar, you will discover the PowSyBl ecosystem as well as handle and study an electrical network through an interactive Python notebook.
PowSyBl is an open source project hosted by LF Energy, which offers a comprehensive set of features for electrical grid modelling and simulation. Among other advanced features, PowSyBl provides:
- A fully editable and extendable library for grid component modelling;
- Visualization tools to display your network;
- Grid simulation tools, such as power flows, security analyses (with or without remedial actions) and sensitivity analyses;
The framework is mostly written in Java, with a Python binding so that Python developers can access PowSyBl functionalities as well.
What you will learn during the webinar:
- For beginners: discover PowSyBl's functionalities through a quick general presentation and the notebook, without needing any expert coding skills;
- For advanced developers: master the skills to efficiently apply PowSyBl functionalities to your real-world scenarios.
Knowledge engineering: from people to machines and back
Conheça o Power BI
1. Bring your data to life
with Microsoft Power BI
Marcos Freccia
Consultor Sênior em Banco de Dados
SQL Server MVP & Chapter Leader
MCITP DBA & MCITP DEV & MCSE Data Platform
2. 01
Microsoft Power BI overview
A new generation of BI
Introducing Microsoft Power BI
Power BI overview
Signing up for Power BI
3. Everyone
3rd wave
End user BI
A new generation of BI
Today, BI extends to everyone
Analyst to end user
2nd wave
Self-service BI
IT to end user
1st wave
Technical BI
4. A new generation of BI
Turning data into business insights is challenging
Common BI challenges include…
Multiple data sources Data residing in SaaS solutions, and other external locations, is difficult to access and refresh
securely
End-to-end view Data often resides in disparate locations, making it difficult to see a complete picture of your
business
Right data for the right users at the right
time
Different roles have different needs, and business users need the latest operational data
5. Introducing Microsoft Power BI
Experience your data. Any data, any way, anywhere.
Power BI is a cloud-based business analytics service that enables:
Fast and easy access to data
A live 360º view of the business
Data discovery and exploration
Insights from any device
Collaboration across the organization
Anyone to visualize and analyze data
Power BI
6. Introducing Microsoft Power BI
Key benefits and differentiators
Pre-built content packs, consisting of dashboards and reports, for popular SaaS
solutions
Integration with familiar Microsoft products, and commitment for scale and availability in
Azure
Intuitive data exploration by using natural language query
Real-time dashboard updates
Fast deployment, hybrid configuration, secure, and integrated with existing IT systems
Secure, live connection to your data sources,
on-premises and in the cloud
7. Power BI overview
Data sources Power BI service
SaaS solutions
E.g. Marketo, Salesforce, GitHub, Google analytics
On-premises data
E.g. Analysis Services
Organizationalcontentpacks
Corporate data sources, or external data services
Azure services
E.g. Azure SQL, Stream Analytics
Excel files
Workbook data or data models
Power BI Desktop files
Related data from files, databases, Azure, and other
sources
Data refresh
Visualizations
Live dashboards
Content packs Sharing & collaborationNatural language query
Reports
Datasets01001
10101
8. Power BI overview
Power BI REST APIPower BI Desktop
Prepare Explore ShareReport
SaaS solutions
E.g. Marketo, Salesforce, GitHub, Google analytics
On-premises data
E.g. Analysis Services
Organizational content packs
Corporate data sources, or external data services
Azure services
E.g. Azure SQL, Stream Analytics
Excel files
Workbook data and data models
Power BI Desktop files
Related data from files, databases, Azure, and other
sources
Data refresh
Visualizations
Live dashboards
Content packs Sharing & collaborationNatural language query
Reports
Datasets01001
10101
9. Signing up for Power BI
Sign up can be achieved for free, and within seconds
Power BI works only with an organizational account, associated with a work or school email
address
Encourage customers to trial Power BI for free, and to
realize the benefits of Power BI Pro features
Editor's Notes
Welcome to this presentation!
Introduce the module title and topics.
Key message:
Business intelligence, or BI, has come a long way.
During the first two waves of business intelligence, IT professionals and business analysts were the keepers of BI. They made BI accessible and consumable for end users.
While this approach still applies to complex business intelligence needs, today there is a new wave.
This third wave of BI makes BI available to every kind of user.
Talking points:
Today we’re going to discuss Power BI, which is a third-wave solution. Power BI enables EVERYONE to collect, analyze, visualize and publish data.
This third wave has the potential to expand the reach of analytics to more users than ever before. Existing analytics platforms and tools can be extended, instead of being replaced, by full-featured solutions like Power BI. Power BI directly connects to existing on-premises data, such as Analysis Services tabular models that were created by business analysts in collaboration with IT. Microsoft Excel and the new Power BI Desktop work hand-in-hand with Power BI, publishing reports and models created by business analysts and getting them more easily in the hands of the business users who can gain insight and take action.
Power BI addresses three common business intelligence challenges that an organization may face:
Getting an end-to-end view off what is happening — because data is often in disparate locations, it can be difficult for business users to see a complete picture of your business
Managing multiple data sources — Data residing in SaaS solutions and other external locations can be difficult to manage programmatically, or access and refresh securely
Making the right data available to the right users at the right time
Mobile business users need the latest operational data at their fingertips, no matter where they are or what device they’re using
Different roles have different needs and access levels, so a one-size-fits all solution doesn’t work
Key message:
Power BI is a business analytics service. With Power BI you can now see all of your data through a single pane of glass. Live Power BI dashboards and reports show visualizations and KPIs from data residing both on-premises and in the cloud, providing a consolidated view across your business regardless of where your data lives.
Talking points:
This is Power BI in a nutshell and the overall benefits to your business. We will look at what this means for the IT Pro and the key benefits for IT on the next slide
Key message:
There are several capabilities that differentiate Power BI from other offerings in the market.
Talking points:
Power BI is a cloud-based analytics service that provides faster time to insight. It is used for visualizing, exploring and extracting insights from data. It brings together data from diverse sources to deliver rich, comprehensive views of business operations.
What that means is, with Power BI, you can see all of your data through a single pane of glass, and create an analytics environment in minutes to monitor data and share reports. Live dashboards and reports show visualizations and KPIs from data that reside both on-premises and in the cloud, providing a consolidated view across your business regardless of where your data lives.
There are several capabilities that are unique to Power BI – these include:
Pre-built dashboards and reports for popular SaaS solutions such as Marketo, Salesforce, GitHub, ZenDesk, Dynamics CRM, and many others
Dashboards and visualizations that support real-time updates
Secure, live connection to on-premises data sources to drive insight across the entire range of organizational information (Analysis Services, Azure SQL Database, SQL Database Auditing, Azure SQL Data Warehouse)
Automated scheduled refresh to keep your Power BI data in sync with on premises data sources
Native mobile applications for keeping users connected on the go
Easy integration with other Microsoft offerings, from Excel to Azure services
Intuitive data exploration, which enables users to ask questions of their data in plain English
To summarize, Power BI is a SaaS offering that enables anyone to easily connect to their data, create live operational dashboards and explore data via interactive visualizations
Let’s walk through an overview of how Power BI works.
1. The Power BI service, sometimes referred to as powerbi.com, is what allows you to:
Create beautiful visualizations to tell compelling data stories
Build rich, live dashboards that turn BI into business insights
Create reports & datasets from which you can create visualizations and dashboards
Enjoy the benefits of up-to-date data with real-time, automatic and scheduled refreshes
Share dashboards easily with other people in your organization
Ask questions of data in plain English with Natural Language Query
Stay connected to your data all the time with mobile applications
2. Power BI connects to a variety of data sources. These range across both cloud and on-premises sources, and include:
A variety of popular SaaS solutions, such as Marketo, Salesforce, GitHub, Dynamics CRM, Zendesk, and several others
On-premises databases – Power BI offers live connectivity to SQL Server Analysis Services, which we’ll cover in more detail later. And using a gateway solution, Power BI can connect to other database solutions.
Custom data sources – Power BI can connect to any data source you need it to thanks to its extensibility via REST APIs. This includes both proprietary corporate data sources, as well as external data services. For example, if you are a SaaS solution provider, you can work with Microsoft to connect your solution to Power BI.
Other Azure services – Power BI integrates tightly with SQL Azure and Stream Analytics, and will be integrating closely with more Azure services over time
Power BI Desktop and Excel files – Excel workbooks can be directly connected to Power BI.com, or may be used with Power BI Desktop. Power BI Desktop is a companion application to the Power BI service – it is a desktop tool that supports data analysis and reporting. Like Excel files, Power BI Desktop files may be uploaded to the Power BI service.
This slide can be used to categorize the Power BI features into different roles.
During this course, different topics will be relevant to different roles – so it is good to define these early on.
Key message:
Get started quickly with the Power BI service (powerbi.com) for faster decision-making by displaying all of your data in one place
Talking points:
As discussed earlier, you can get started quickly with pre-built content packs for popular SaaS solutions
The primary capability of Power BI is that it empowers you to create and customize live dashboards – dashboards that include visualizations from multiple data sources
That is, dashboards can show different types of data from a variety of sources, and can use a range of unique visualizations
If applicable, you can track status in real-time thanks to support for real-time data sources
You have full control over your dashboards – pin any visualization from any report to any dashboard
Click through visualizations to access their underlying reports to discover more data and new insights
Como implantar o Power BI na minha empresa?
A redbelt está presenteando x clientes com uma consultoria (4 horas) para ajudar a desenhar possíveis cenários de implementação do Power BI.
Nossos especialistas irão até a sua empresa, entender um pouco mais do seu a dia a dia, entendendo as dores que as áreas de negócios tem. Ao final, será entregue um documento com os cenários de possíveis implementações.
O Projeto
A RED BELT através de sua divisão de negócios RED AD implementou um ambiente de Business Intelligence utlizando SharePoint OnLine para a construtora Pacaembu.
Situação de Negócio
Formado pela Haus Construtora e pela Pacaembu Construtora, que somam mais de 20 anos de experiência no segmento de baixa renda, o Grupo Pacaembu atua na construção de empreendimentos residenciais destinados às classes C e D contempladas no programa “Minha Casa Minha Vida”, do Governo Federal. Buscando maior agilidade na tomada de decisão o Grupo Pacaembu buscou por tecnologia de ponta para agregar em seu dia a dia.
A Solução
A RED AD implementou uma solução de Business Intelligence (BI) utilizando o ambiente Cloud da Microsoft (Azure), a fim de ampliar e agilizar a tomada de decisão da organização. Com a solução o Grupo Pacaembu possui relatórios gerenciais customizados e exclusivos, que permitem analisar os dados do seu ERP com uma visão que o próprio ERP não disponbiliza. Os cubos criados pela redbelt, possibilita que o usuário crie inúmeras combinações de informações (visões), facilitando a compreensão dos resultados. Com esta solução, foi possível reverter o tempo que os usuários “perdiam” criando relatórios no Excel concilando varios relatórios do ERP.
Tecnologias:
Microsoft Integration Services (SSIS)
Microsoft Analysis Services (SSAS)
Windows Azure
SharePoint OnLine
Office 365
Power BI
Benefícios:
Criação de novas visões (indicadores)
Tomada de decisão pro ativa
Agilidade no acesso de dados gerenciais
Dados personalizados