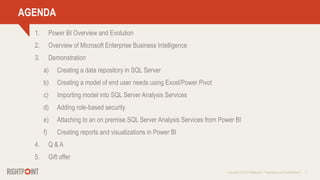
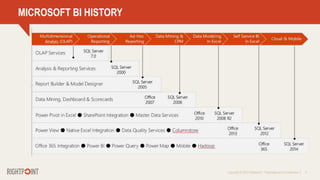
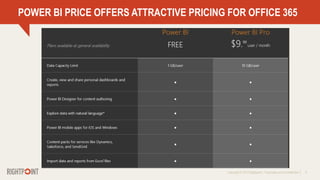
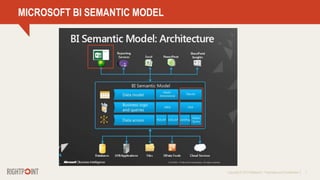
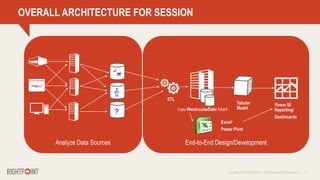
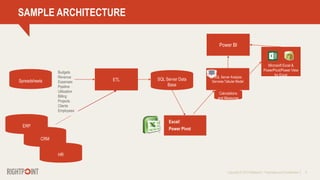
MICROSOFT POWER BI TO SUPPORT ENTERPRISE BUSINESS
INTELLIGENCE
Presented By: Neal Levin, BI Practice Lead Rightpoint
Date: Feb. 24, 2015
Copyright © 2013 Rightpoint | Proprietary and Confidential 2
INTRODUCTION
• BI Practice Lead – Rightpoint (2 years)
• Pre-Sales Technical Architect – Microsoft (7 years)
• Microsoft Practice Lead – KPMG Consulting/BearingPoint
Copyright © 2013 Rightpoint | Proprietary and Confidential 3
AGENDA
1. Power BI Overview and Evolution
2. Overview of Microsoft Enterprise Business Intelligence
3. Demonstration
a) Creating a data repository in SQL Server
b) Creating a model of end user needs using Excel/Power Pivot
c) Importing model into SQL Server Analysis Services
d) Adding role-based security
e) Attaching to an on premise SQL Server Analysis Services from Power BI
f) Creating reports and visualizations in Power BI
4. Q & A
5. Gift offer
Copyright © 2013 Rightpoint | Proprietary and Confidential 4
MICROSOFT BI HISTORY
Copyright © 2013 Rightpoint | Proprietary and Confidential 5
POWER BI PRICE OFFERS ATTRACTIVE PRICING FOR OFFICE 365
Copyright © 2013 Rightpoint | Proprietary and Confidential 6
POWER BI PRICE OFFERS ATTRACTIVE PRICING FOR OFFICE 365
Copyright © 2013 Rightpoint | Proprietary and Confidential 7
MICROSOFT BI SEMANTIC MODEL
Copyright © 2013 Rightpoint | Proprietary and Confidential 8
OVERALL ARCHITECTURE FOR SESSION
Data Warehouse/Data Mart
ETL
Copyright © 2013 Rightpoint | Proprietary and Confidential 9
CRM
SAMPLE ARCHITECTURE
Spreadsheets ETL SQL Server Data
Base
SQL Server Analysis
Services Tabular Model
Calculations
and Measures
ERP
Budgets
Revenue
Expenses
Pipeline
Utilization
Billing
Projects
Clients
Employees
Power BI
HR
Copyright © 2013 Rightpoint | Proprietary and Confidential 10
INITIAL DATA MODEL FOR DEMONSTRATION
Revenue and
Expenses
Practice
Category
Job
Client
Employee
Practice
Subcategory
Hours
Date
Dimension Fact
Role
Budget
Job Type
Industry Office
Copyright © 2013 Rightpoint | Proprietary and Confidential 11
SAG FH AA JAC TOL
VALUE OF A DIMENSIONAL MODEL
Practice Catgory
Department
Office
Assurance
Tax Revenue
Consulting
Wealth
Compliance
Advisory
ENV COMM UTIL IND INST
Date
DEMONSTRATION
Copyright © 2013 Rightpoint | Proprietary and Confidential 13
REQUIREMENTS FOR CONNECTING POWER BI ANALYSIS SERVICES
• Power BI Analysis Services Connector installed on the Analysis Services server
• Office 365 tenant must have DirSync enabled via Azure Active Directory so
Power BI can pass the user by way of EffectiveUser
Copyright © 2013 Rightpoint | Proprietary and Confidential 16
WHAT DID WE SEE IN THIS SESSION?
• Ability to rapidly prototype end user needs using Excel/Power Pivot/Power View
• Migrate Power Pivot model to SQL Server Analysis Services
• Attach Power BI to on premise SQL Server Analysis Services
• Create exciting visualization/dashboards in the cloud and share with colleagues
Copyright © 2013 Rightpoint | Proprietary and Confidential 17
WHAT DID WE NOT SEE IN THIS SESSION
• Creation of SQL Server Integration Services packages to populate and automate
loading of SQL Server data base
• Integration of SharePoint with SQL Server Analysis Services for on premise
creation of dashboards/visualizations/reports
• SQL Server Reporting Services
• Power Query
Q & A
Copyright © 2013 Rightpoint | Proprietary and Confidential 19
$100 MICROSOFT GIFT CARD
The first 5 attendees to sign up will
receive a $100 Microsoft Gift Card
SIGN UP FOR A BI LUNCH & LEARN
Copyright © 2013 Rightpoint | Proprietary and Confidential 20
Want to learn more about Business Intelligence?
Neal Levin
Business Intelligence Practice Lead
P: 312.999.5429
nlevin@rightpoint.com

Leveraging Microsoft Power BI To Support Enterprise Business Intelligence

  • 1.
    MICROSOFT POWER BITO SUPPORT ENTERPRISE BUSINESS INTELLIGENCE Presented By: Neal Levin, BI Practice Lead Rightpoint Date: Feb. 24, 2015
  • 2.
    Copyright © 2013Rightpoint | Proprietary and Confidential 2 INTRODUCTION • BI Practice Lead – Rightpoint (2 years) • Pre-Sales Technical Architect – Microsoft (7 years) • Microsoft Practice Lead – KPMG Consulting/BearingPoint
  • 3.
    Copyright © 2013Rightpoint | Proprietary and Confidential 3 AGENDA 1. Power BI Overview and Evolution 2. Overview of Microsoft Enterprise Business Intelligence 3. Demonstration a) Creating a data repository in SQL Server b) Creating a model of end user needs using Excel/Power Pivot c) Importing model into SQL Server Analysis Services d) Adding role-based security e) Attaching to an on premise SQL Server Analysis Services from Power BI f) Creating reports and visualizations in Power BI 4. Q & A 5. Gift offer
  • 4.
    Copyright © 2013Rightpoint | Proprietary and Confidential 4 MICROSOFT BI HISTORY
  • 5.
    Copyright © 2013Rightpoint | Proprietary and Confidential 5 POWER BI PRICE OFFERS ATTRACTIVE PRICING FOR OFFICE 365
  • 6.
    Copyright © 2013Rightpoint | Proprietary and Confidential 6 POWER BI PRICE OFFERS ATTRACTIVE PRICING FOR OFFICE 365
  • 7.
    Copyright © 2013Rightpoint | Proprietary and Confidential 7 MICROSOFT BI SEMANTIC MODEL
  • 8.
    Copyright © 2013Rightpoint | Proprietary and Confidential 8 OVERALL ARCHITECTURE FOR SESSION Data Warehouse/Data Mart ETL
  • 9.
    Copyright © 2013Rightpoint | Proprietary and Confidential 9 CRM SAMPLE ARCHITECTURE Spreadsheets ETL SQL Server Data Base SQL Server Analysis Services Tabular Model Calculations and Measures ERP Budgets Revenue Expenses Pipeline Utilization Billing Projects Clients Employees Power BI HR
  • 10.
    Copyright © 2013Rightpoint | Proprietary and Confidential 10 INITIAL DATA MODEL FOR DEMONSTRATION Revenue and Expenses Practice Category Job Client Employee Practice Subcategory Hours Date Dimension Fact Role Budget Job Type Industry Office
  • 11.
    Copyright © 2013Rightpoint | Proprietary and Confidential 11 SAG FH AA JAC TOL VALUE OF A DIMENSIONAL MODEL Practice Catgory Department Office Assurance Tax Revenue Consulting Wealth Compliance Advisory ENV COMM UTIL IND INST Date
  • 12.
  • 13.
    Copyright © 2013Rightpoint | Proprietary and Confidential 13 REQUIREMENTS FOR CONNECTING POWER BI ANALYSIS SERVICES • Power BI Analysis Services Connector installed on the Analysis Services server • Office 365 tenant must have DirSync enabled via Azure Active Directory so Power BI can pass the user by way of EffectiveUser
  • 14.
    Copyright © 2013Rightpoint | Proprietary and Confidential 16 WHAT DID WE SEE IN THIS SESSION? • Ability to rapidly prototype end user needs using Excel/Power Pivot/Power View • Migrate Power Pivot model to SQL Server Analysis Services • Attach Power BI to on premise SQL Server Analysis Services • Create exciting visualization/dashboards in the cloud and share with colleagues
  • 15.
    Copyright © 2013Rightpoint | Proprietary and Confidential 17 WHAT DID WE NOT SEE IN THIS SESSION • Creation of SQL Server Integration Services packages to populate and automate loading of SQL Server data base • Integration of SharePoint with SQL Server Analysis Services for on premise creation of dashboards/visualizations/reports • SQL Server Reporting Services • Power Query
  • 16.
  • 17.
    Copyright © 2013Rightpoint | Proprietary and Confidential 19 $100 MICROSOFT GIFT CARD The first 5 attendees to sign up will receive a $100 Microsoft Gift Card SIGN UP FOR A BI LUNCH & LEARN
  • 18.
    Copyright © 2013Rightpoint | Proprietary and Confidential 20 Want to learn more about Business Intelligence? Neal Levin Business Intelligence Practice Lead P: 312.999.5429 nlevin@rightpoint.com

Editor's Notes

  • #2 Welcome to this Microsoft Power BI Webinar focused on Enterprise Business Intelligence.
  • #3 I am Neal Levin, BI Practice Lead for Rightpoint. I have been with Rightpoint for about 2 and ½ years. Prior to joining Rightpoint, I was a Pre-Sales Technical Architect with Microsoft and focused on business intelligence, collaboration and cloud solutions including Office 365. Prior to Microsoft, I was a Microsoft practice lead for KPMG Consulting/BearingPoint with emphasis on business intelligence, ERP and CRM.
  • #4 Our agenda begins with a brief overview of Microsoft Power BI and the evolution of BI capabilities within the Microsoft stack. We then turn our focus to Enterprise Business Intelligence and provide a common architecture for modern enterprise reporting and business intelligence. Following these short introductory slides, we will move into the demonstration portion of our session including: Creating a data repository in SQL Server Creating a model of end user needs using Excel/Power Pivot Importing the model into SQL Server Analysis Services Adding role-based security Attaching to an on premise SQL Server Analysis Services Server from Power BI We should have at least 10 minutes for Q & A at the end of the session.
  • #5 Not many people realize it, but Microsoft has been in the business intelligence space for more than 15 years, beginning with the addition of OLAP services in SQL Server 7.0 back in 1999. Further progress was made with introduction of analysis services and SQL Server Reporting Services. One of the most dramatic advances was the xVelocity in memory engine created as the foundation for Power Pivot in Excel and later deployed as the Tabular Model in SQL Server Analysis Services. Significant improvements in dashboarding and visualization were accomplished with the release of Power View. Finally, business intelligence capabilities were brought to the cloud with the delivery of Power BI for Office 365.
  • #6 Approximately 1 month ago, Microsoft announced some fairly dramatic pricing reductions for Power BI. There is now a free version available to Office 365 users to share and view dashboards and reports up to 1gb. The Pro version pricing for Office 365 E3/E4 customers has been reduced to $9.99 per month with a 10gb limit.
  • #7 The Pro version allows connectivity to on premise data sources along with ability to establish scheduled data refresh, which is a big step forward for hybrid cloud scenarios.
  • #8 This slide depicts what Microsoft likes to call the BI Semantic Model and it highlights what I would consider a best practice in designing and building enterprise business intelligence and reporting solutions. Namely, that is the separation of business logic and data relationships into a separate logical layer and represented physically in SQL Server Analysis Services. I work with many customers who have business logic buried in stored procedures, client side code, excel spreadsheets and macros. Although initially this might have made sense to produce something quickly, it rapidly gets unwieldy and difficult to maintain as the business changes and with the inevitable turnover of the creator of the business logic. By moving the business logic and calculations to the BI Semantic layer, the business logic can easily be shared among Excel users via Power Pivot, SharePoint users via Power Pivot, Power View and SQL Server Reporting Services, and now Power BI in the cloud.
  • #9 I want to touch on the overall architecture depicted in this slide as it forms the basis for our demonstration. We typically encounter customers who desire to extract data from a variety of data sources using Extract, Transform and Loading tools such as SQL Server Integration Services. A relatively new tool that can also be used is Power Query which has been released under related Power BI offerings to enable extraction of data from a variety of on premise and external sources. Although Power Query is a great tool for rapidly grabbing data and populating a Power Pivot model, I prefer to use SQL Server Integration Services when it comes to implementation and deployment of enterprise solutions. We will make use of Excel/Power Pivot in the demonstration along with the Tabular model in SQL Server Analysis Services. The tabular model and Power Pivot are both based on the xVelocity in-memory engine Microsoft created to provide columnar storage, high compression of data in memory, very fast query response, as well as the increasingly popular DAX modeling language, which is relatively easy to learn for experienced Excel users.
  • #10 For our demonstration today, we are going to be using a typical set up data for a fictitious accounting firm. The source data for this firm is contained in spreadsheets as we well as ERP, CRM and HR solutions. Our data includes revenue, expenses, utilization, clients, projects or jobs and employees. We will be highlighting the data as it exists in SQL Server and loading the data to Power Pivot. From there, we create a few calculated columns and fields as well as KPIs. Once we complete our prototyping in Excel, we then load the model to SQL Server Analysis Services to allow connection to Power BI and back to Power Pivot for those users who prefer to work with the data locally.
  • #11 Before working with users in the prototyping component, I always conduct a data modelling exercise to ensure that we represent the data and relationships that will support the required reporting. I am a big proponent of dimensional modelling as it is relatively straight forward and easy to learn. I created the dimension model shown in this slide prior to developing the Power Pivot model. In the model, the blue boxes represent dimensions or look-up tables and the red boxes represent our Fact tables.
  • #12  The value of the dimensional model can be seen in this slide as it allows us to pivot revenue data, for example, by various dimensions represented in our model.
  • #13 Now on to our demonstration.