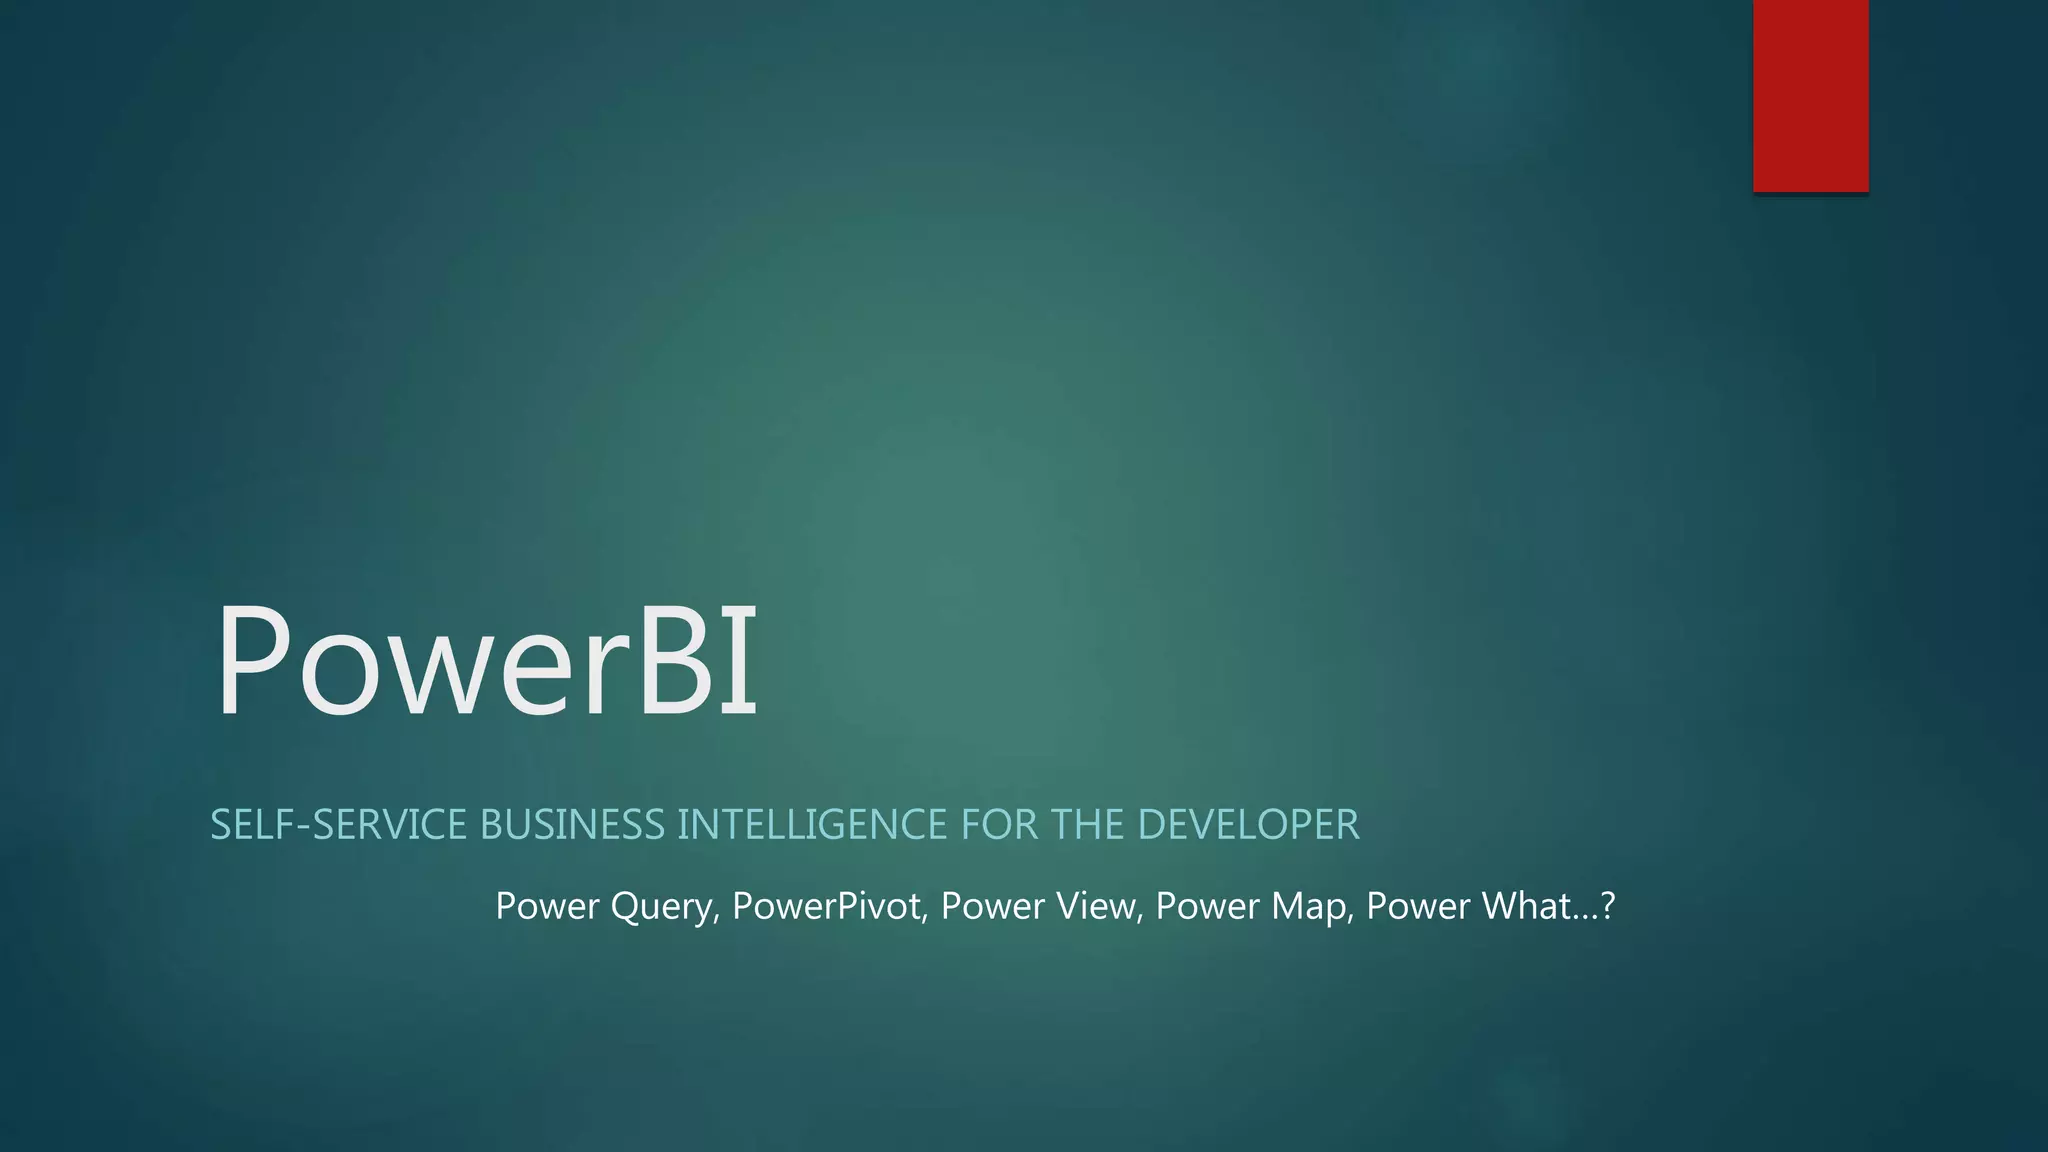
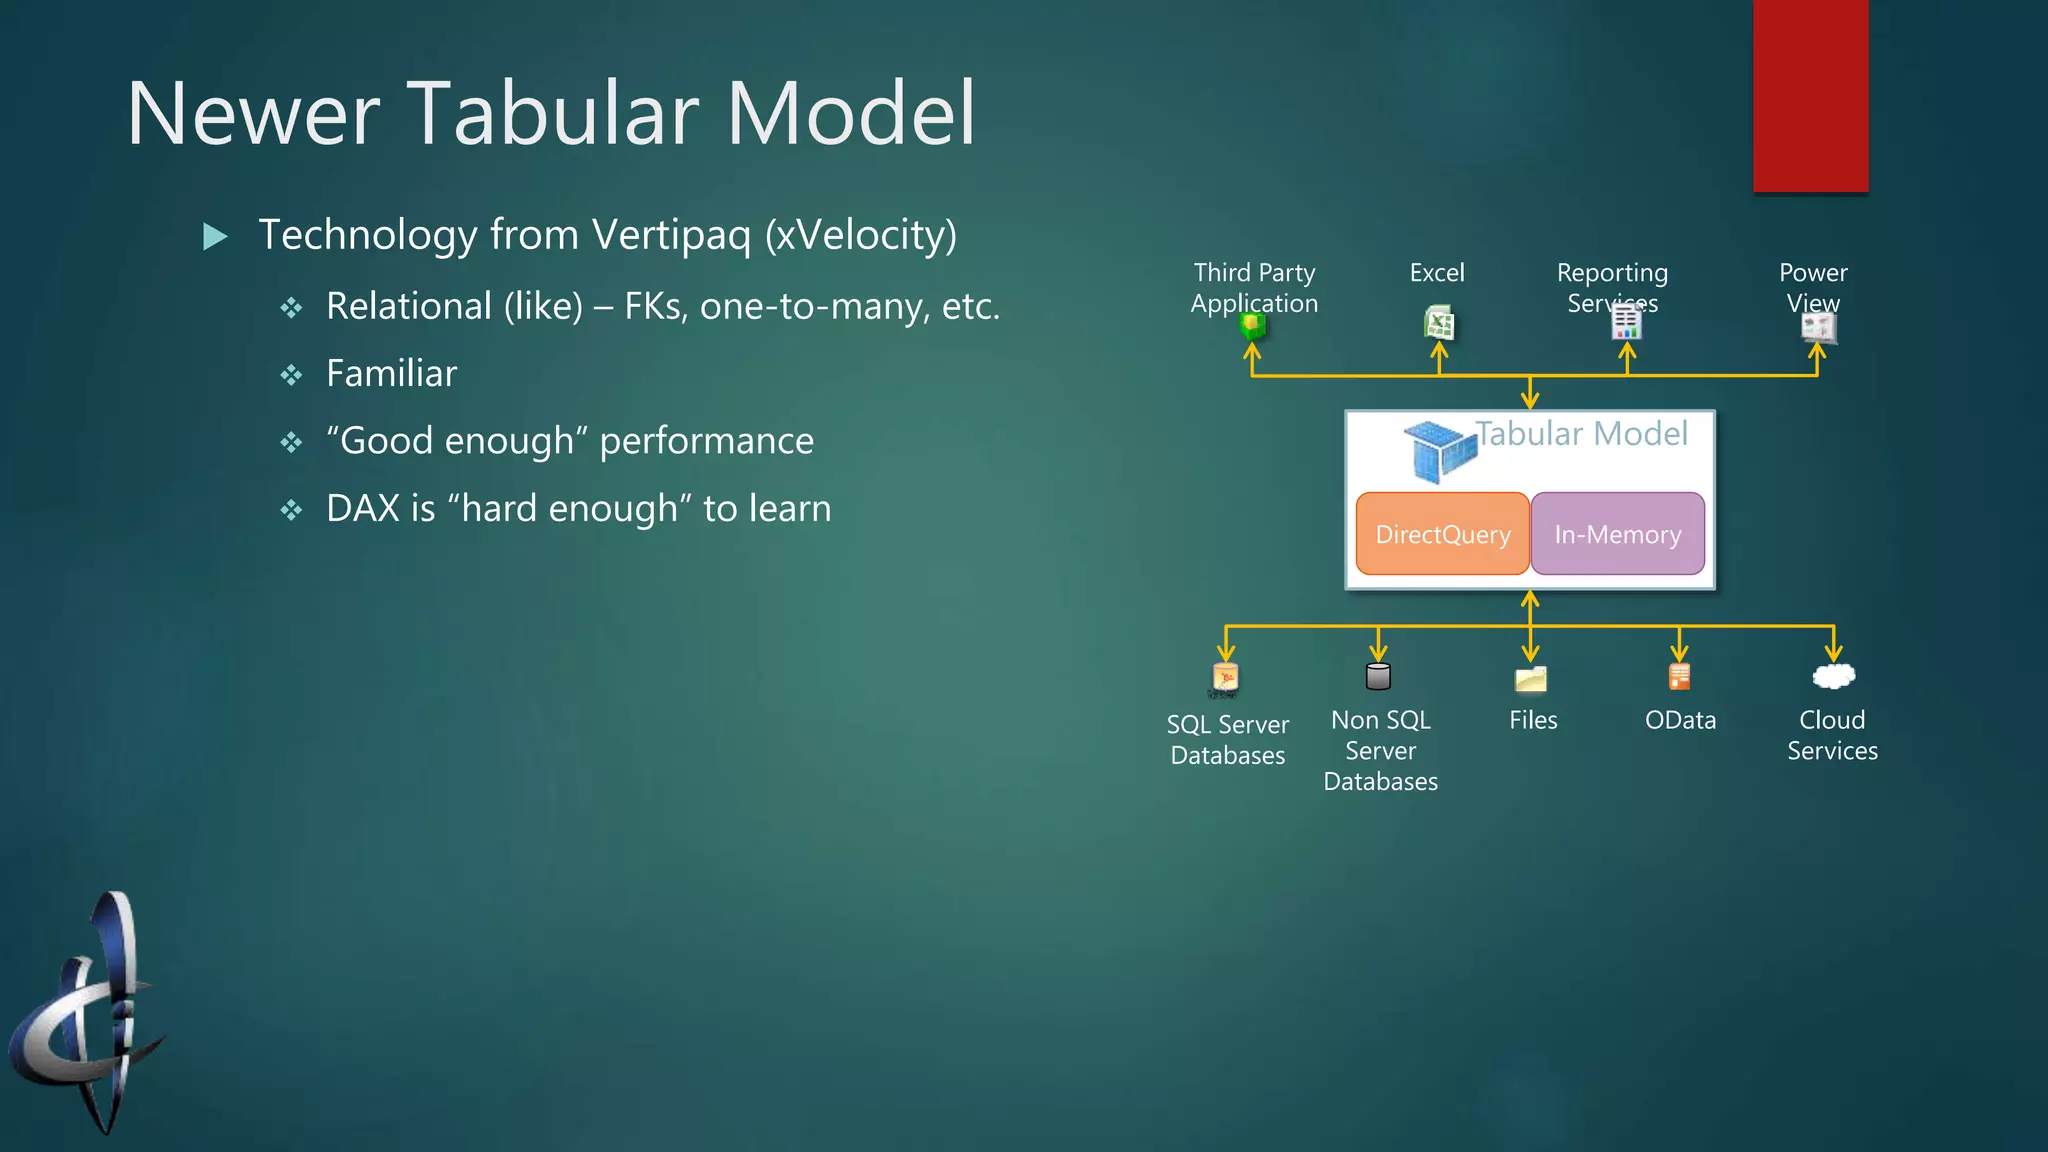
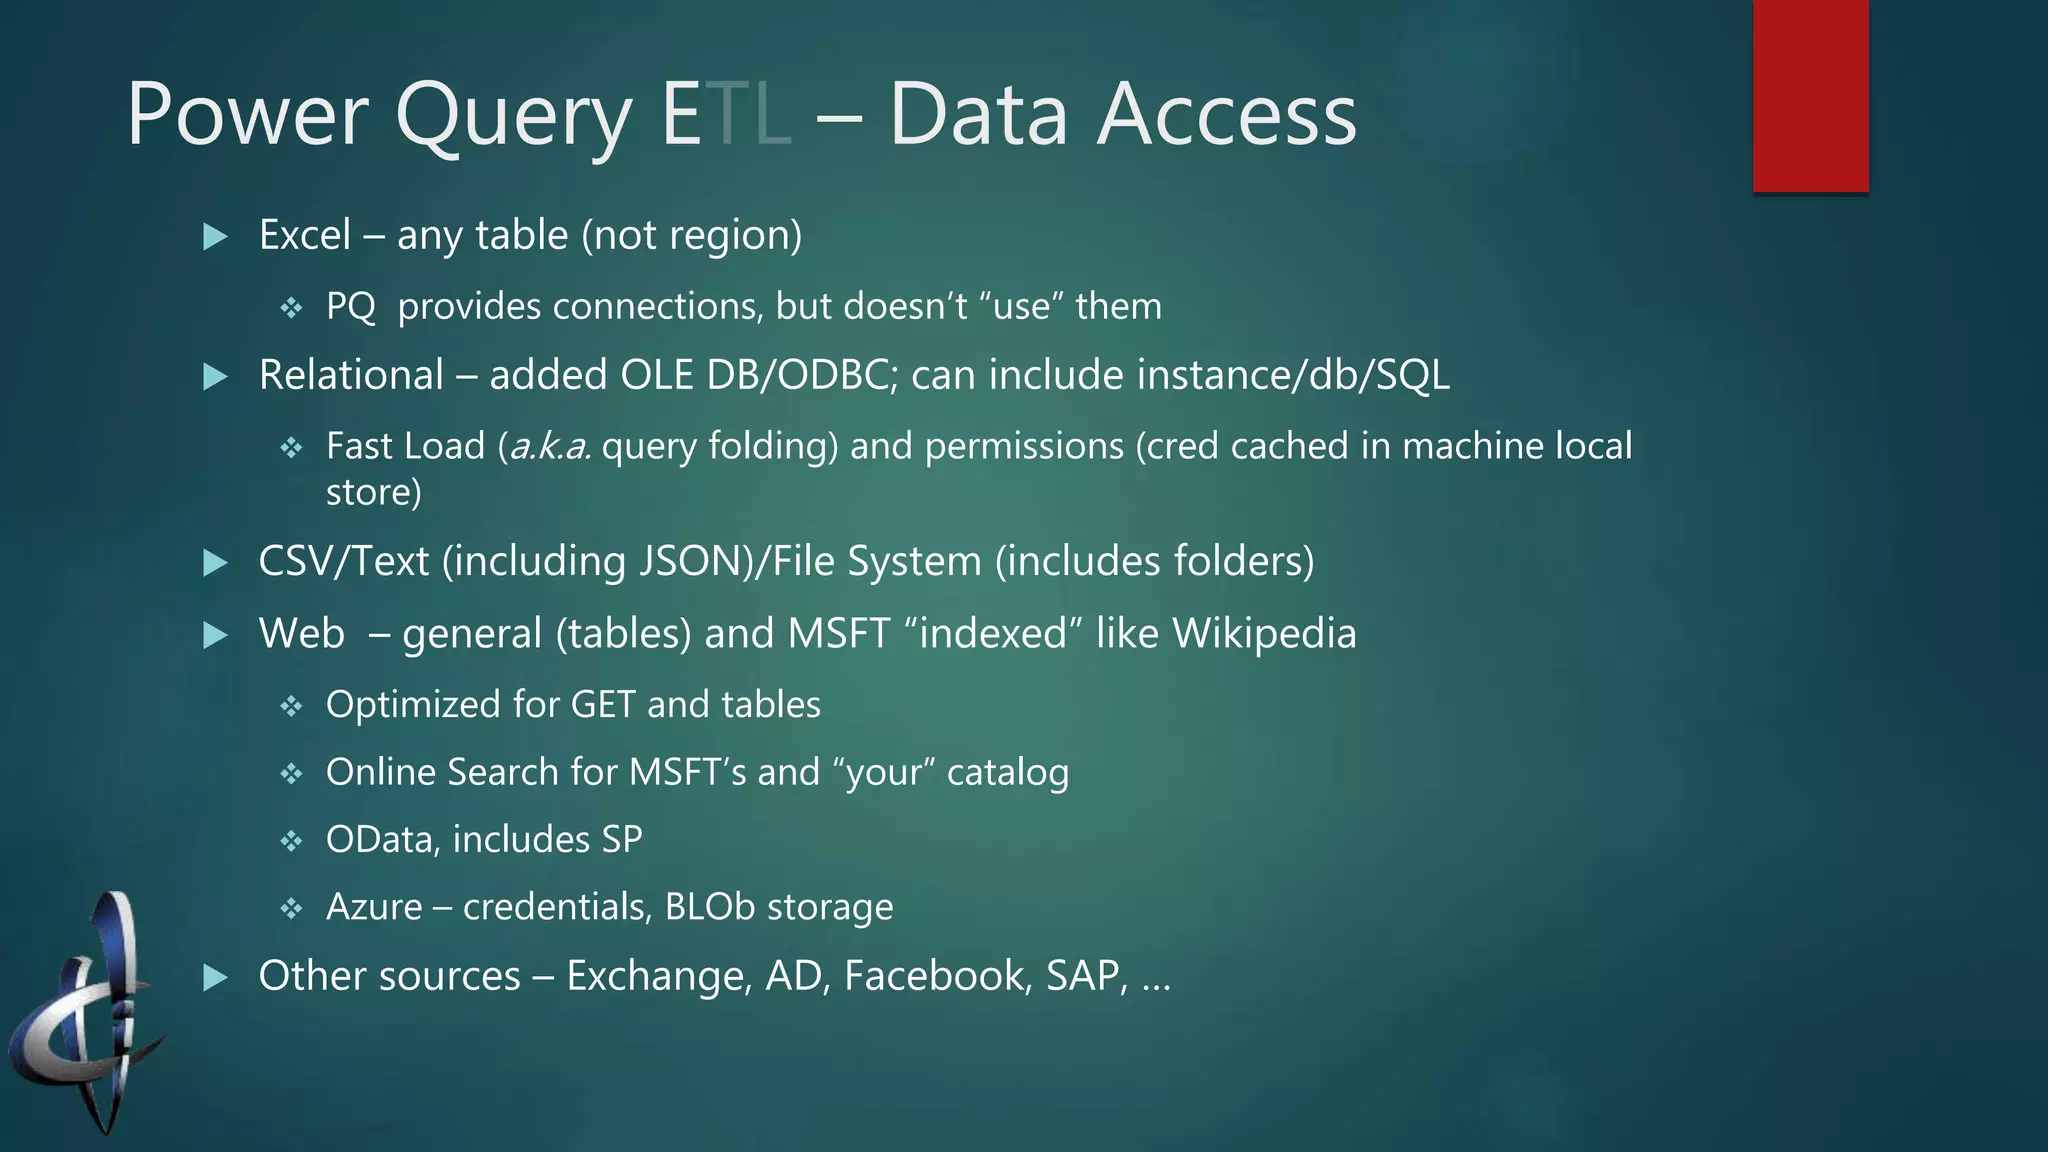
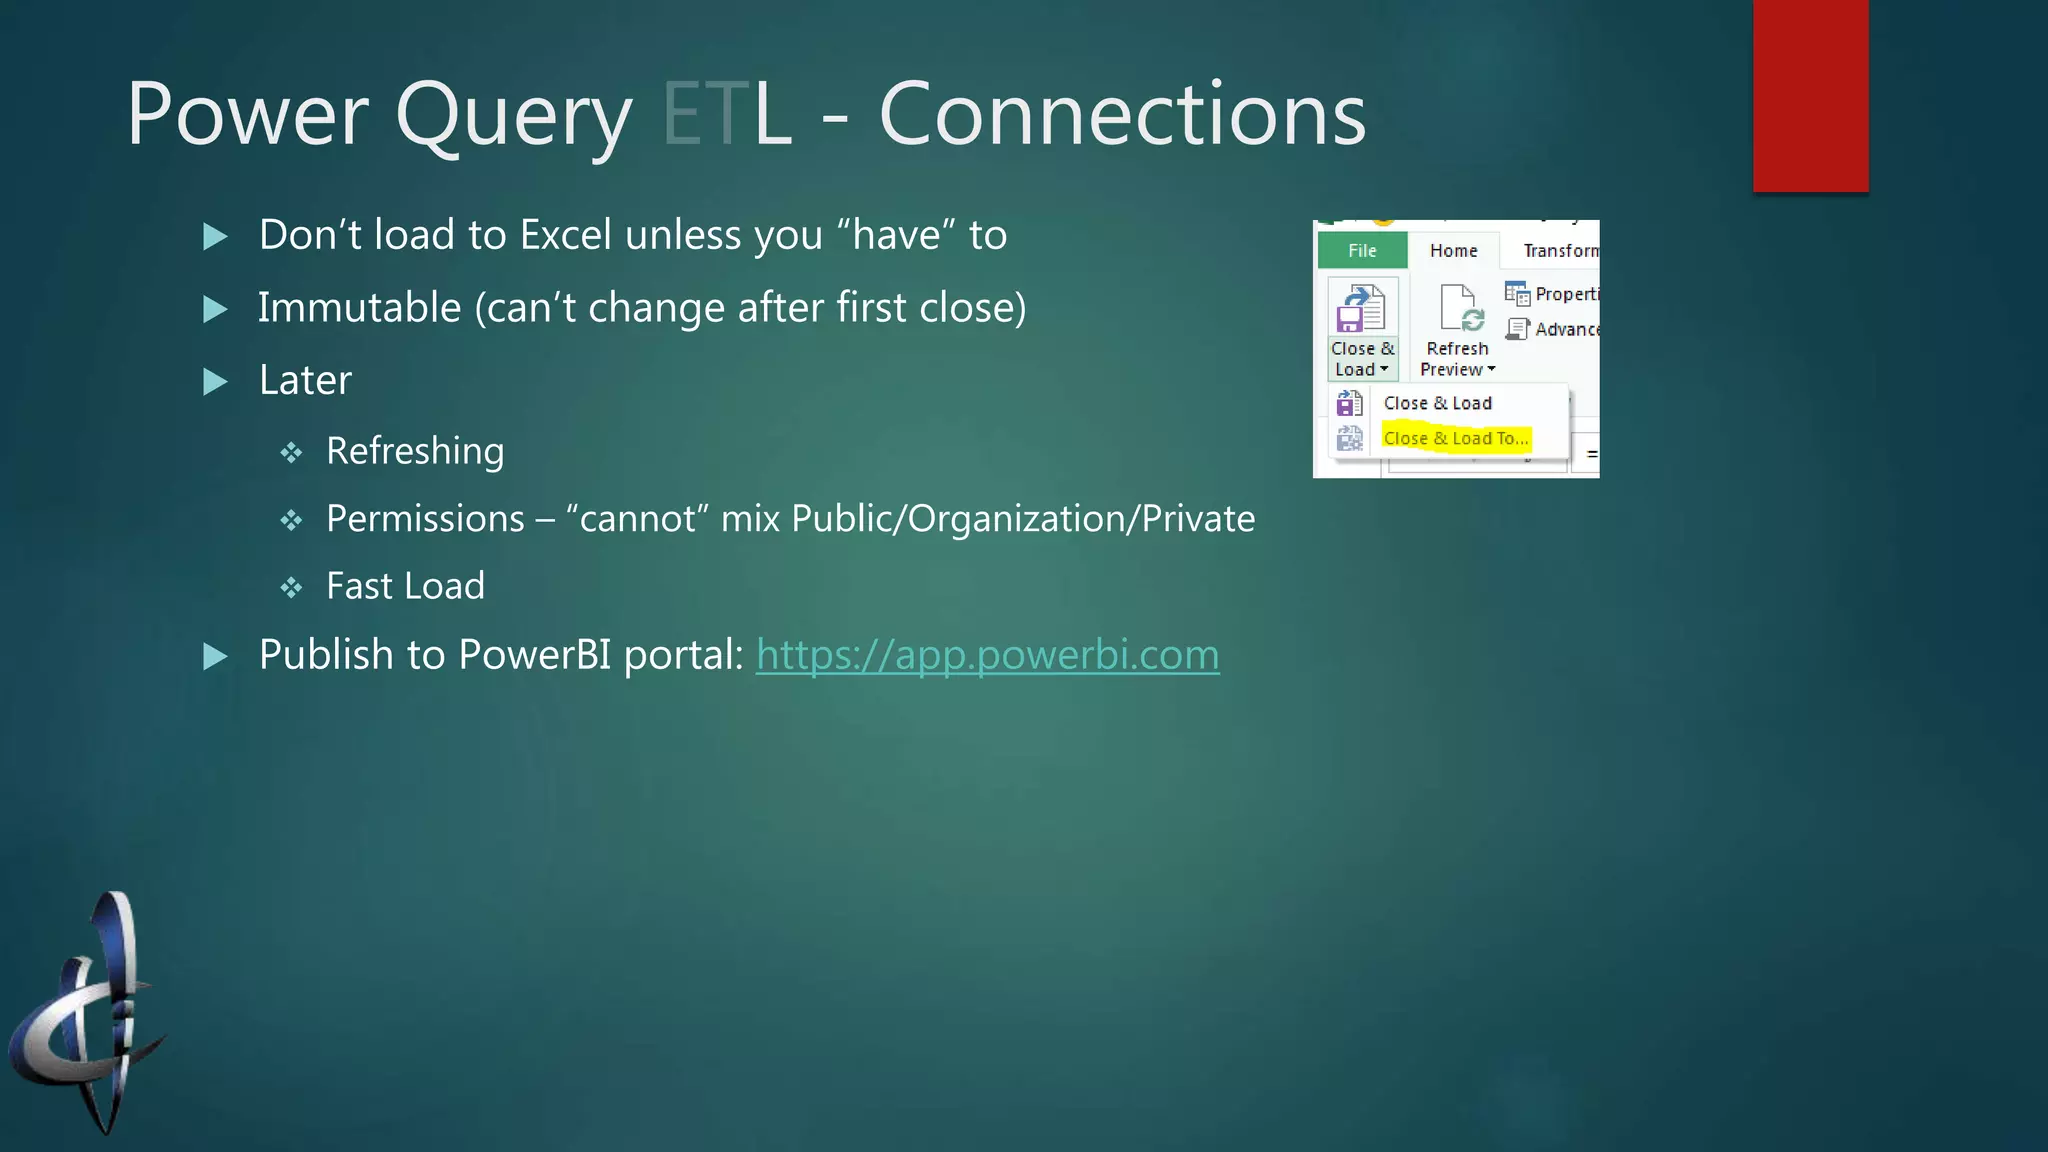
The document provides an overview of Microsoft's Power BI and its components, focusing on self-service business intelligence tools like Power Query, PowerPivot, and Power View. It discusses the differences between multi-dimensional cubes and tabular models, along with the challenges of using Excel for data analysis. Additionally, it highlights the capabilities of Power BI in handling big data and the importance of DAX and M languages for data manipulation and visualization.


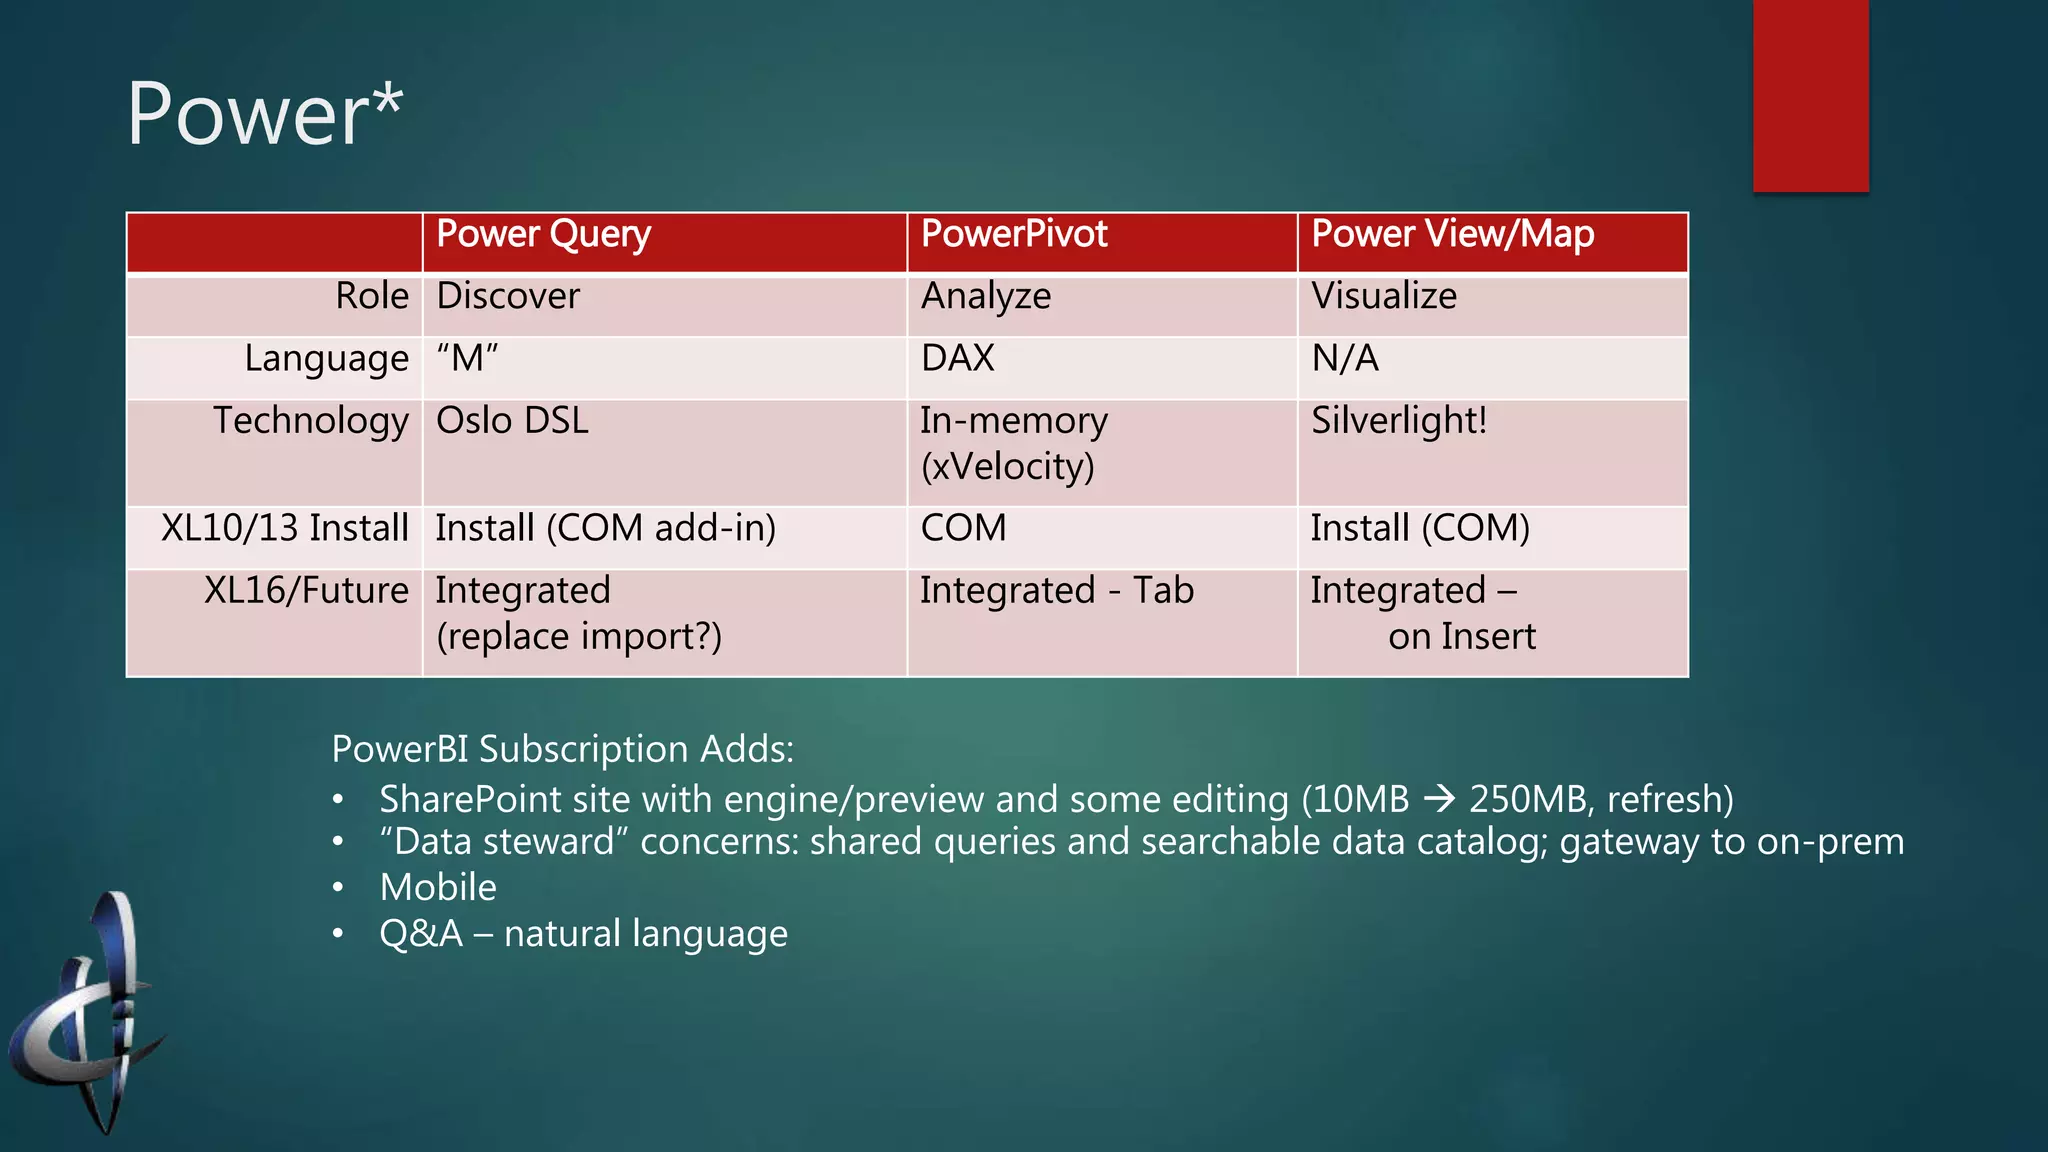

![Power Query T – Informally “M”
Functional, strongly-typed, domain specific language
More similar to Excel functions that OOP
“Control flow” (if…then…else and try…otherwise) are functions
Comments // and /*…*/
Structured data types:
List – an ordered sequence { … } (special form: {1..10}); also indexes
Record – “one row” of named fields [«name» = «value»]; selects field
Table – most important #table() function
Example:
Source = OData.Feed("http://...svc/ "),
Orders_table = Source{[Name="Orders", Signature="table"]}[Data],
https://msdn.microsoft.com/en-us/library/mt211003.aspx](https://image.slidesharecdn.com/powerbi-151114071326-lva1-app6891/75/Power-bi-12-2048.jpg)

![Data Analysis eXtensions
Simpler (tabular) than MDX; “part way” between M and Excel
Syntax “reversed” from M: [] around columns
Statically typed with liberal coercion: "1"+1 = 2; "1"&1 = "11"
Calculated Columns vs. Calculated Fields (nee Measures)
It’s all about the evaluation context:
Row context – typically for calculated columns
Filter context – typically for calculated fields/measures (think in a PivotTable)
Powerful functions like SUMX and CALCULATE
Related() and RelatedTable() go one-to-many but not many-to-one
In-memory vs. Direct Query](https://image.slidesharecdn.com/powerbi-151114071326-lva1-app6891/75/Power-bi-15-2048.jpg)


![[DSC Europe 25] Dusan Jovicic - AI Story: From on-prem to cloud and back agai...](https://cdn.slidesharecdn.com/ss_thumbnails/8kp49m6uq22ifnbwhfnk-2-251205085715-964d11a6-thumbnail.jpg?width=640&height=640&fit=bounds)
![[DSC Europe 25] Boris Perkovic - Lost in performance.pptx](https://cdn.slidesharecdn.com/ss_thumbnails/uq5hrp7vsuahqkxzifux-1-251204082258-fd2ee09d-thumbnail.jpg?width=640&height=640&fit=bounds)

![[DSC Europe 25] Nikola Rajovic - Hardware Technologies Under the Hood: RISC-V...](https://cdn.slidesharecdn.com/ss_thumbnails/o2gptrmtoyqndgoshwgq-dsc2025-tenstorrent-rajovic-251205090438-814685f5-thumbnail.jpg?width=640&height=640&fit=bounds)


![[DSC Europe 25] Goran Obradovic - The Rise of Sovereign AI: Building the Regi...](https://cdn.slidesharecdn.com/ss_thumbnails/7nw2xxixrxqdxvrb5wca-6-251205085714-ab09a2ac-thumbnail.jpg?width=640&height=640&fit=bounds)

![[DSC Europe 25] Vid Stimac - Policy Parsimony: Between Oversimplifying and Ov...](https://cdn.slidesharecdn.com/ss_thumbnails/eqlepagzqp2rhg3gbluh-dsc-stimac-251120-251205090438-059e7f54-thumbnail.jpg?width=640&height=640&fit=bounds)
![[DSC Europe 25] Dragana Ilic - AI for Big Data in Astronomy.pptx](https://cdn.slidesharecdn.com/ss_thumbnails/8palya86qaatvjhva1ms-2-dragana-ilic-ai-ilic-251208151906-652b819c-thumbnail.jpg?width=640&height=640&fit=bounds)


![[DSC Europe 25] Max Talanov - Non digital NNs.pptx](https://cdn.slidesharecdn.com/ss_thumbnails/wif8tr3gtua74qvtopke-non-digital-nns-251205090438-26b0eea6-thumbnail.jpg?width=640&height=640&fit=bounds)
