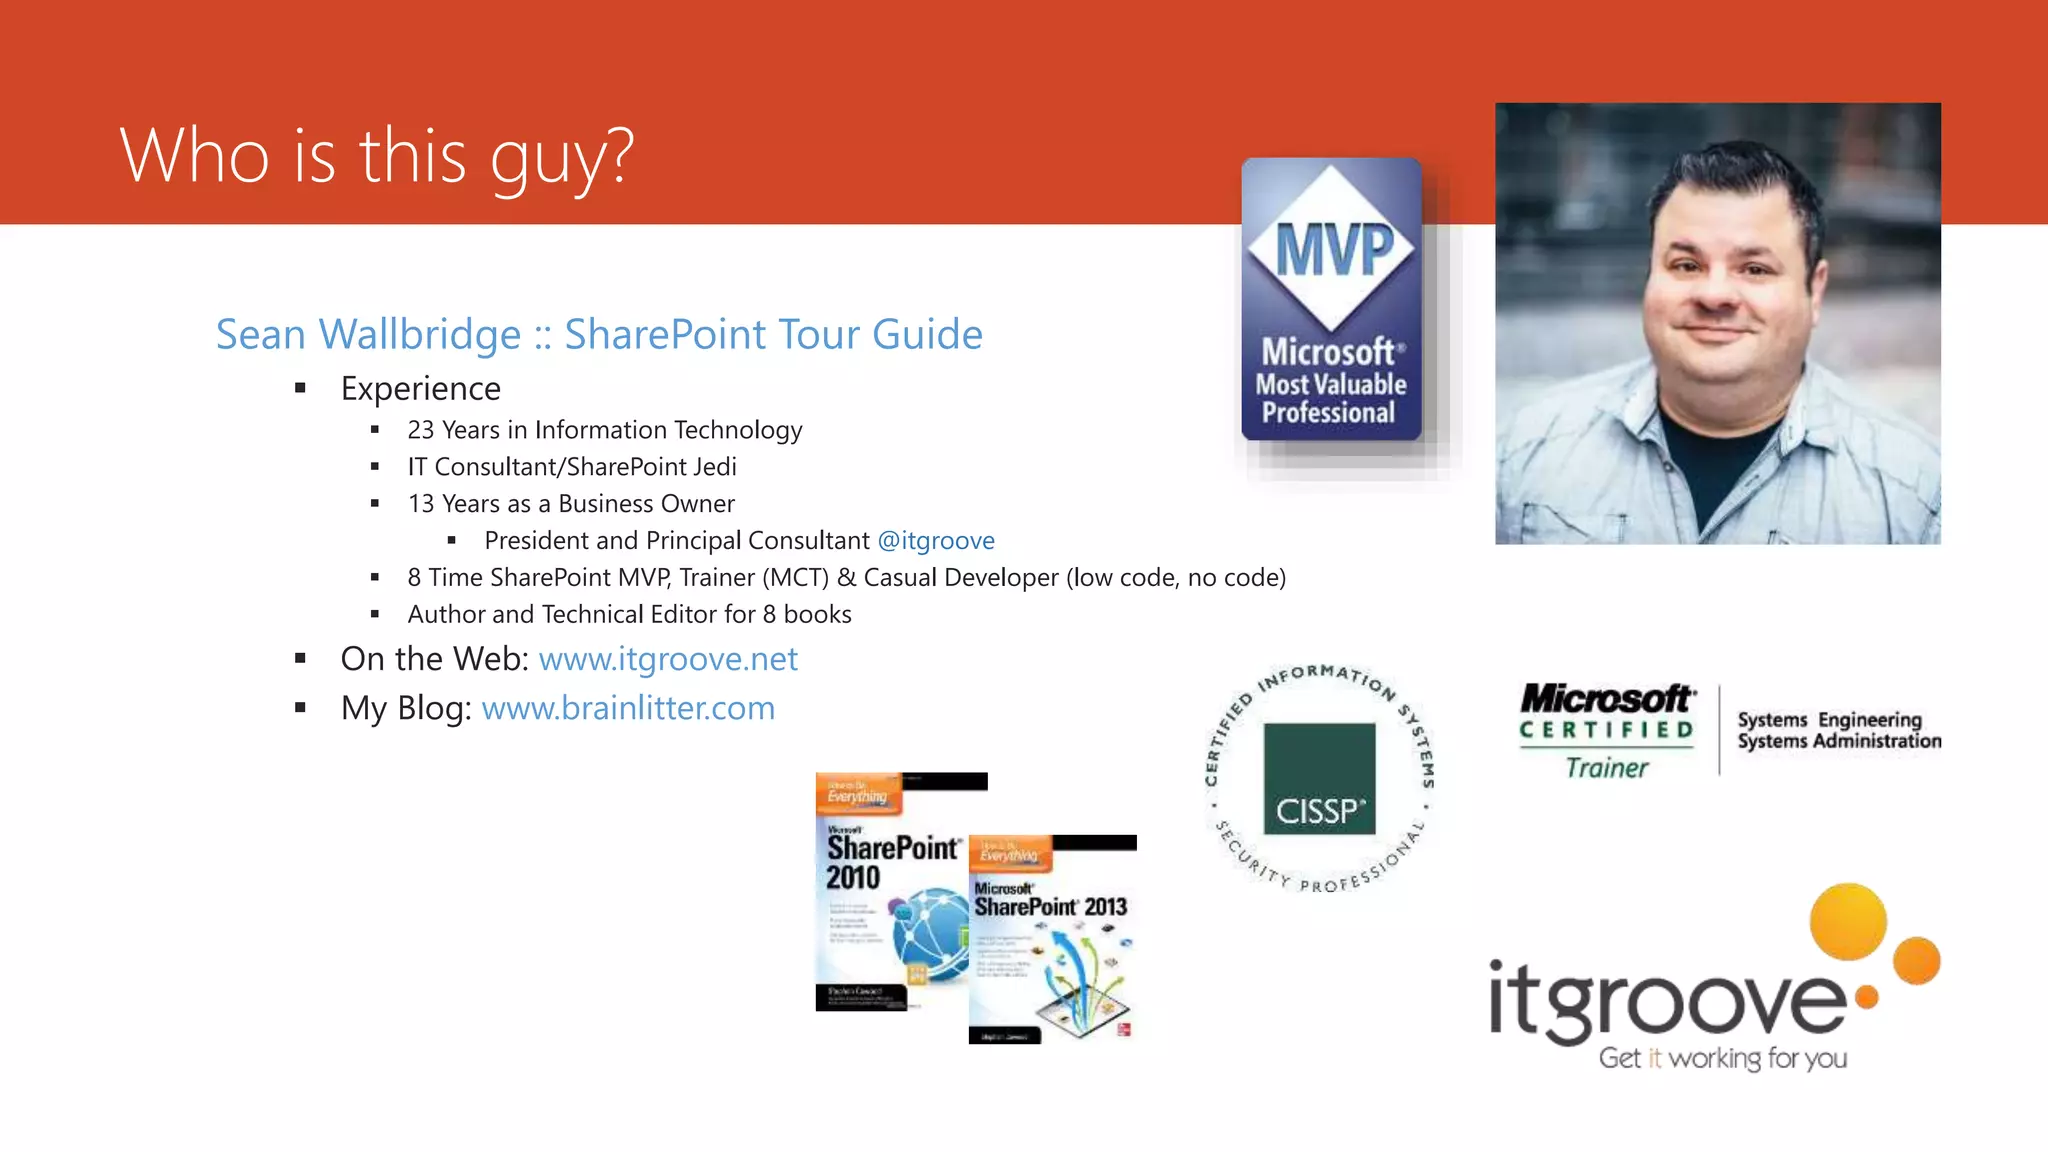
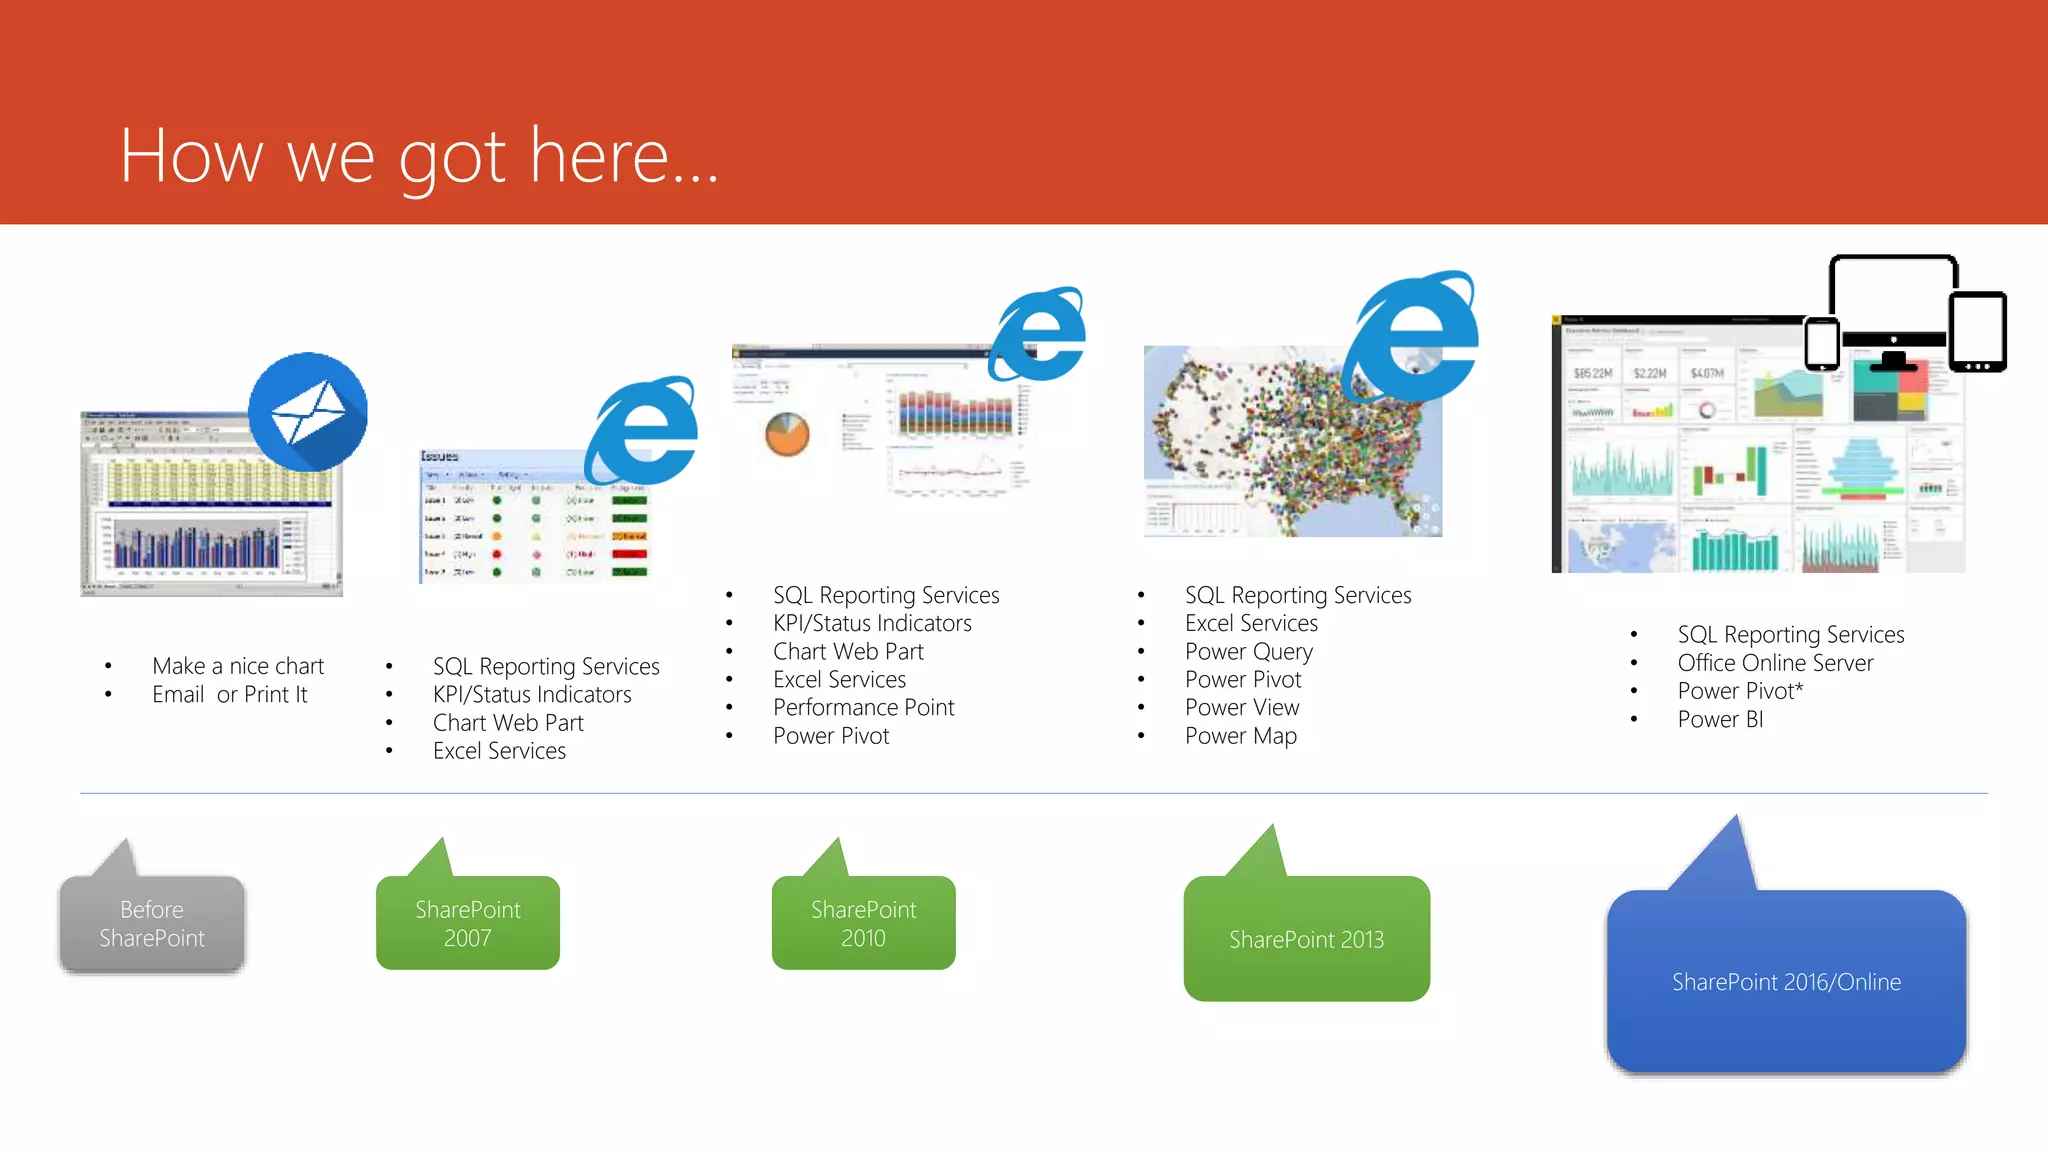
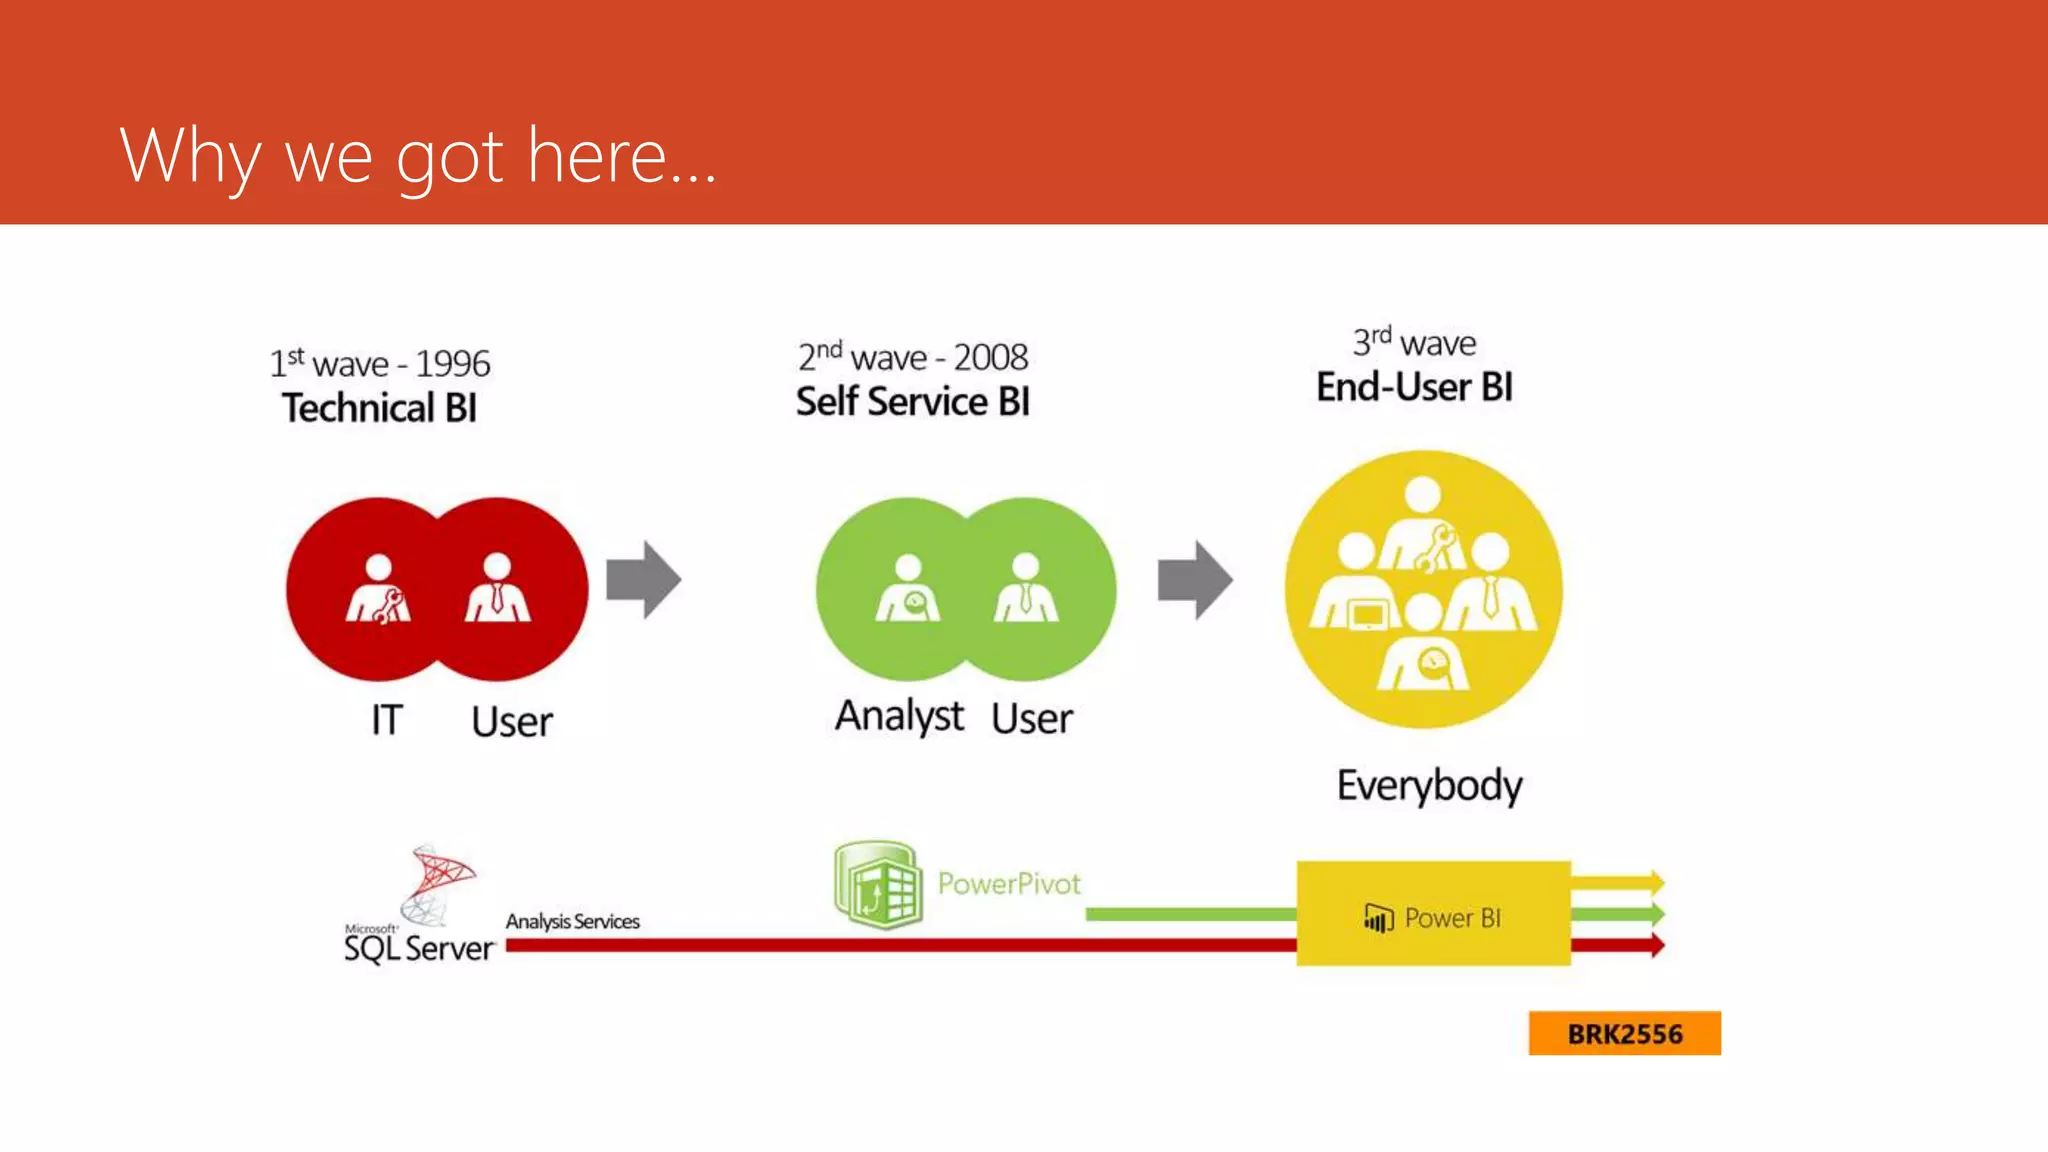
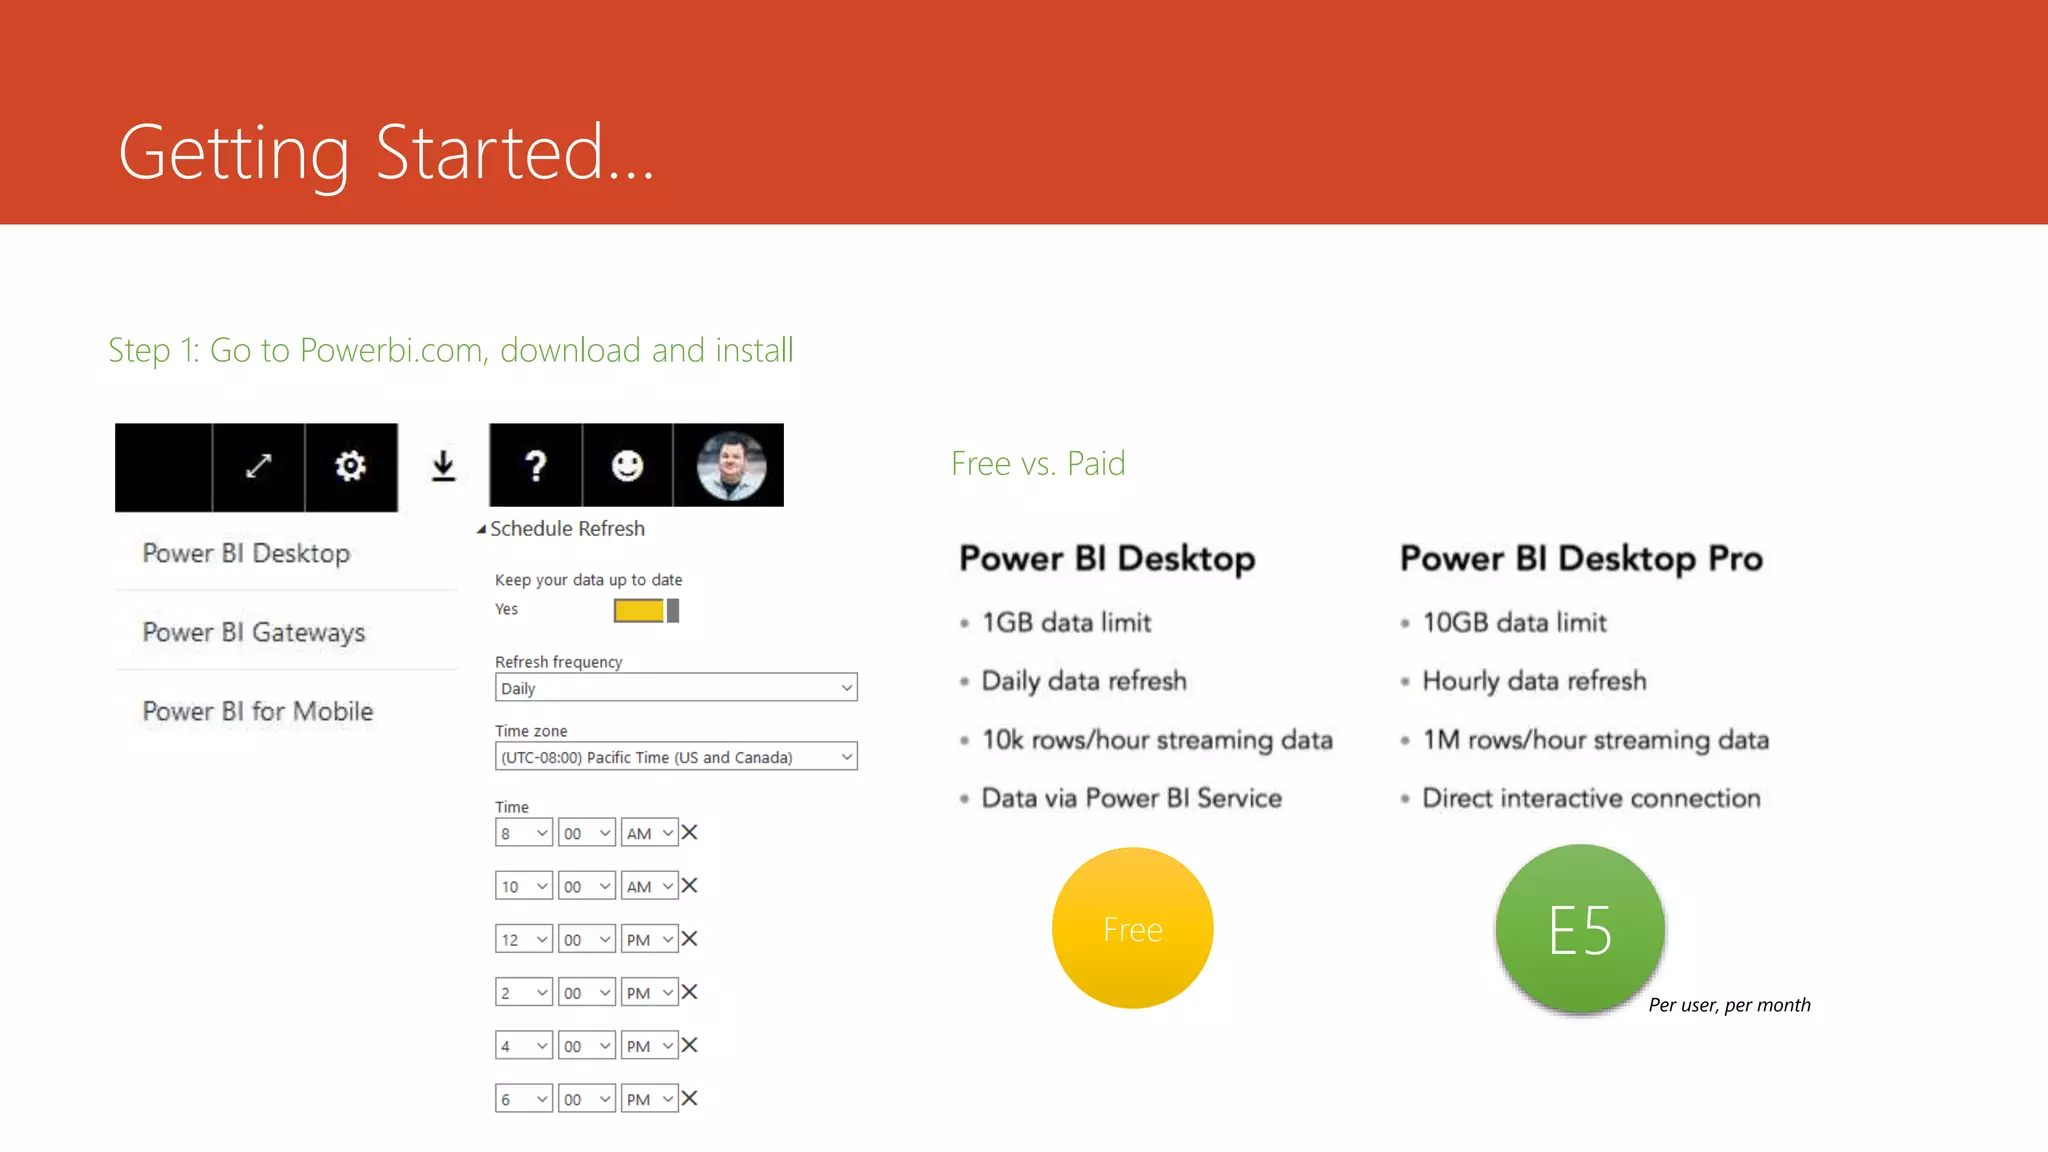
Power BI Overview
Sean Wallbridge, SharePoint MVP
@itgroove | www.itgroove.net
Agenda
 A Brief History of Microsoft BI
 Power BI Components today
 Demo/Preview (if time allows)
Who is this guy?
Sean Wallbridge :: SharePoint Tour Guide
 Experience
 23 Years in Information Technology
 IT Consultant/SharePoint Jedi
 13 Years as a Business Owner
 President and Principal Consultant @itgroove
 8 Time SharePoint MVP, Trainer (MCT) & Casual Developer (low code, no code)
 Author and Technical Editor for 8 books
 On the Web: www.itgroove.net
 My Blog: www.brainlitter.com
How we got here…
Before
SharePoint
• Make a nice chart
• Email or Print It
SharePoint
2007
• SQL Reporting Services
• KPI/Status Indicators
• Chart Web Part
• Excel Services
SharePoint
2010
• SQL Reporting Services
• KPI/Status Indicators
• Chart Web Part
• Excel Services
• Performance Point
• Power Pivot
SharePoint 2013
• SQL Reporting Services
• Excel Services
• Power Query
• Power Pivot
• Power View
• Power Map
SharePoint 2016/Online
• SQL Reporting Services
• Office Online Server
• Power Pivot*
• Power BI
Why we got here…
Building Some BI…
Get Data
Model
Create Visualizations & Reports
Share & Refresh
Get Data
•Excel
•Power Query
Model
•Power Pivot
Create Visualizations & Reports
•Power View
•Power Map
Share & Refresh
•SharePoint
Before (and on Prem)
Get Data
•Power BI
Model
•Power BI
Create Visualizations & Reports
•Power BI
Share & Refresh
•Power BI
Now (Office 365)
Getting Started…
Step 1: Go to Powerbi.com, download and install
Free $12.20
Per user, per month
Free vs. Paid
E5
Getting Started…
WATCH: https://youtu.be/Qgam9M8I0xA

vOffice365 - May 2016 - Overview of Microsoft's Power BI - Sean Wallbridge

  • 1.
    Power BI Overview SeanWallbridge, SharePoint MVP @itgroove | www.itgroove.net
  • 2.
    Agenda  A BriefHistory of Microsoft BI  Power BI Components today  Demo/Preview (if time allows)
  • 3.
    Who is thisguy? Sean Wallbridge :: SharePoint Tour Guide  Experience  23 Years in Information Technology  IT Consultant/SharePoint Jedi  13 Years as a Business Owner  President and Principal Consultant @itgroove  8 Time SharePoint MVP, Trainer (MCT) & Casual Developer (low code, no code)  Author and Technical Editor for 8 books  On the Web: www.itgroove.net  My Blog: www.brainlitter.com
  • 4.
    How we gothere… Before SharePoint • Make a nice chart • Email or Print It SharePoint 2007 • SQL Reporting Services • KPI/Status Indicators • Chart Web Part • Excel Services SharePoint 2010 • SQL Reporting Services • KPI/Status Indicators • Chart Web Part • Excel Services • Performance Point • Power Pivot SharePoint 2013 • SQL Reporting Services • Excel Services • Power Query • Power Pivot • Power View • Power Map SharePoint 2016/Online • SQL Reporting Services • Office Online Server • Power Pivot* • Power BI
  • 5.
    Why we gothere…
  • 6.
    Building Some BI… GetData Model Create Visualizations & Reports Share & Refresh Get Data •Excel •Power Query Model •Power Pivot Create Visualizations & Reports •Power View •Power Map Share & Refresh •SharePoint Before (and on Prem) Get Data •Power BI Model •Power BI Create Visualizations & Reports •Power BI Share & Refresh •Power BI Now (Office 365)
  • 7.
    Getting Started… Step 1:Go to Powerbi.com, download and install Free $12.20 Per user, per month Free vs. Paid E5
  • 8.

Editor's Notes

  • #4  Who is this guy? Why am I here? Reluctant PM