Downloaded 307 times


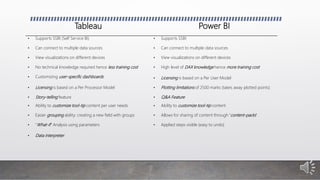
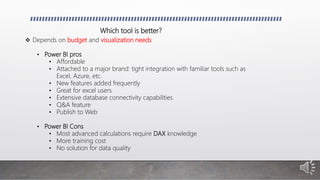


The document outlines the features, pricing, and comparative advantages of two major business intelligence tools: Power BI and Tableau. It details their capabilities, including data visualization, reporting tools, and integration options, emphasizing factors such as user needs, technical expertise, and budget considerations. Ultimately, it suggests that Power BI may be more suitable for budget-conscious users with technical capabilities, while Tableau is recommended for non-technical users despite its higher cost.


