Downloaded 145 times

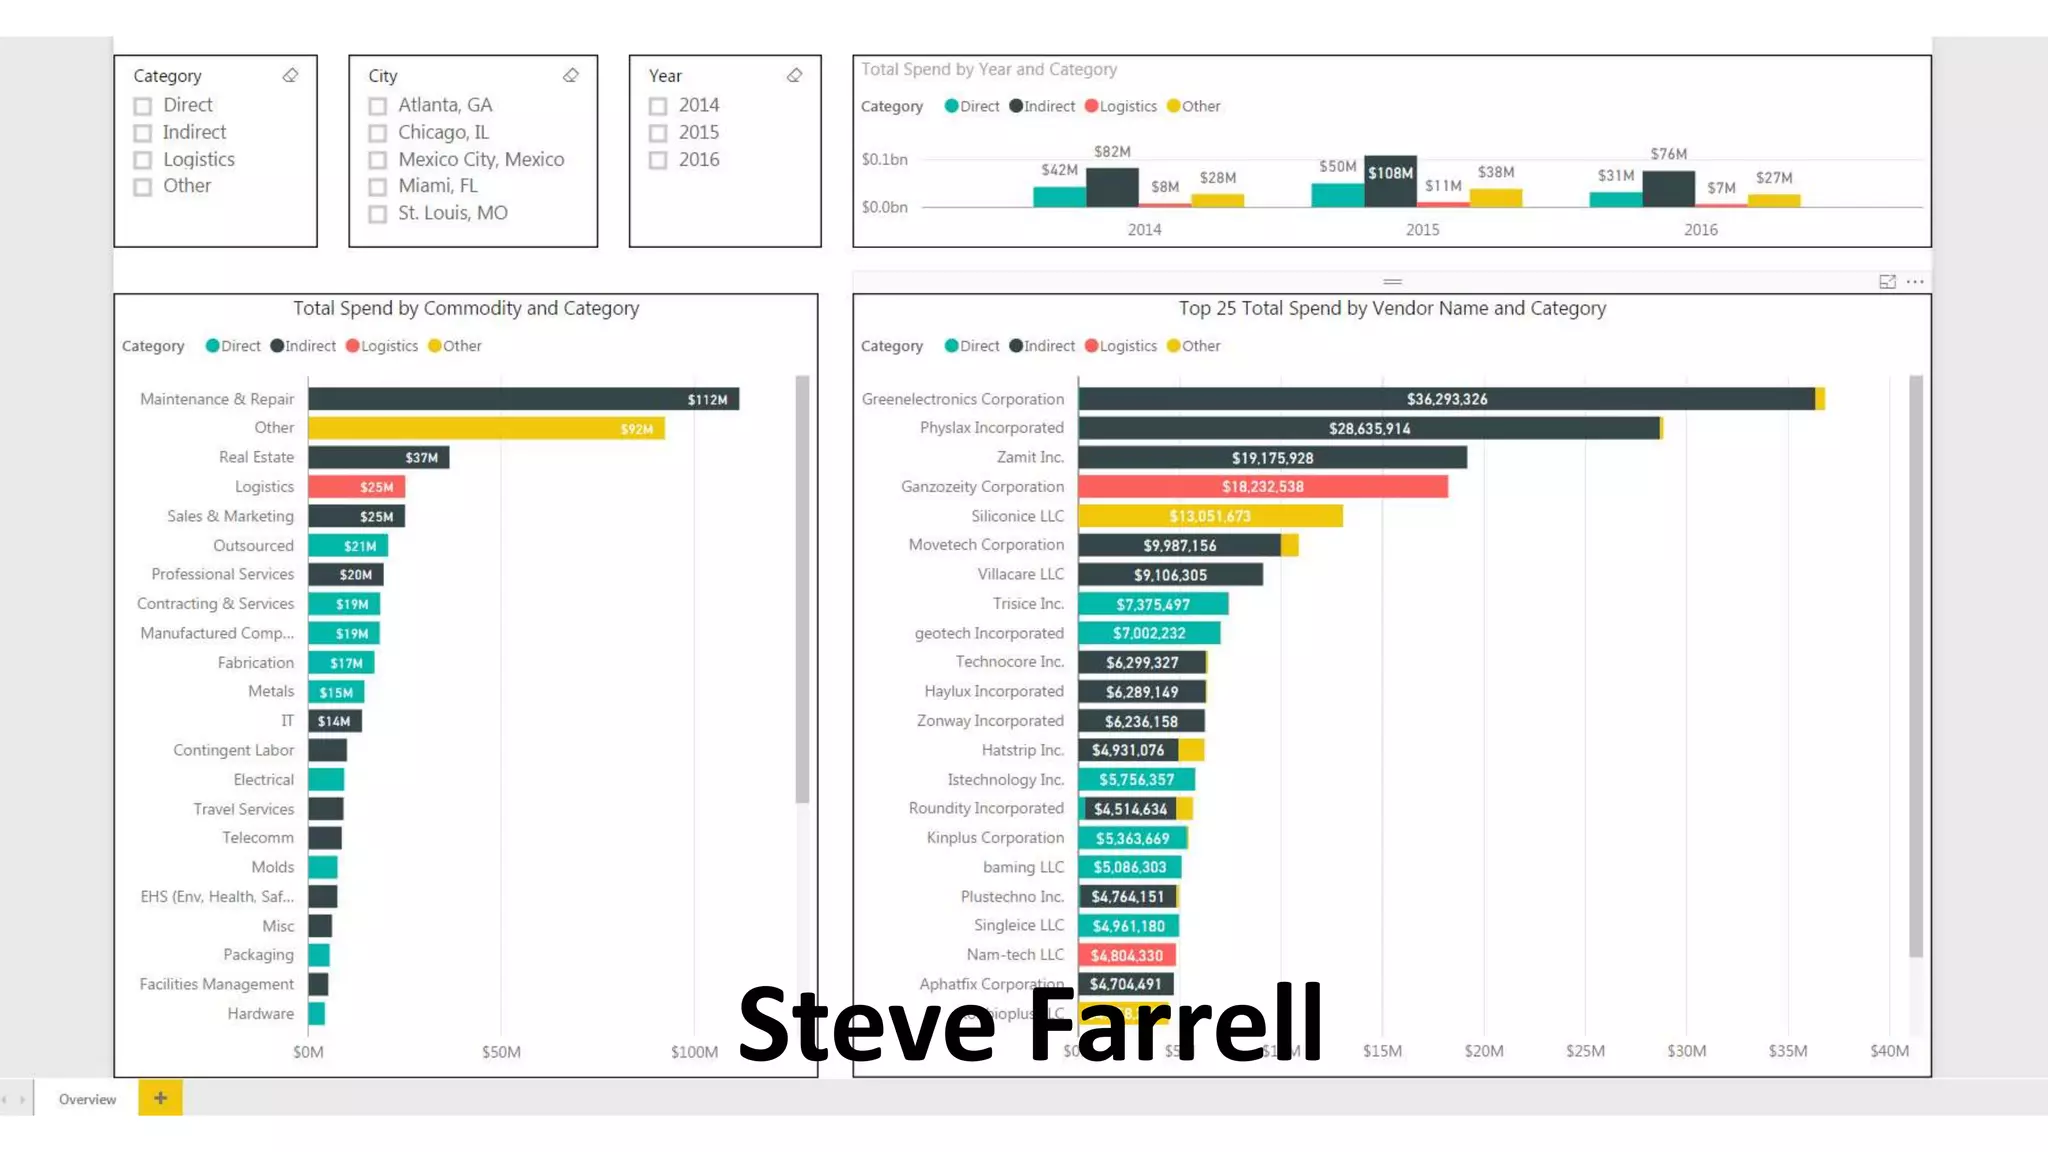

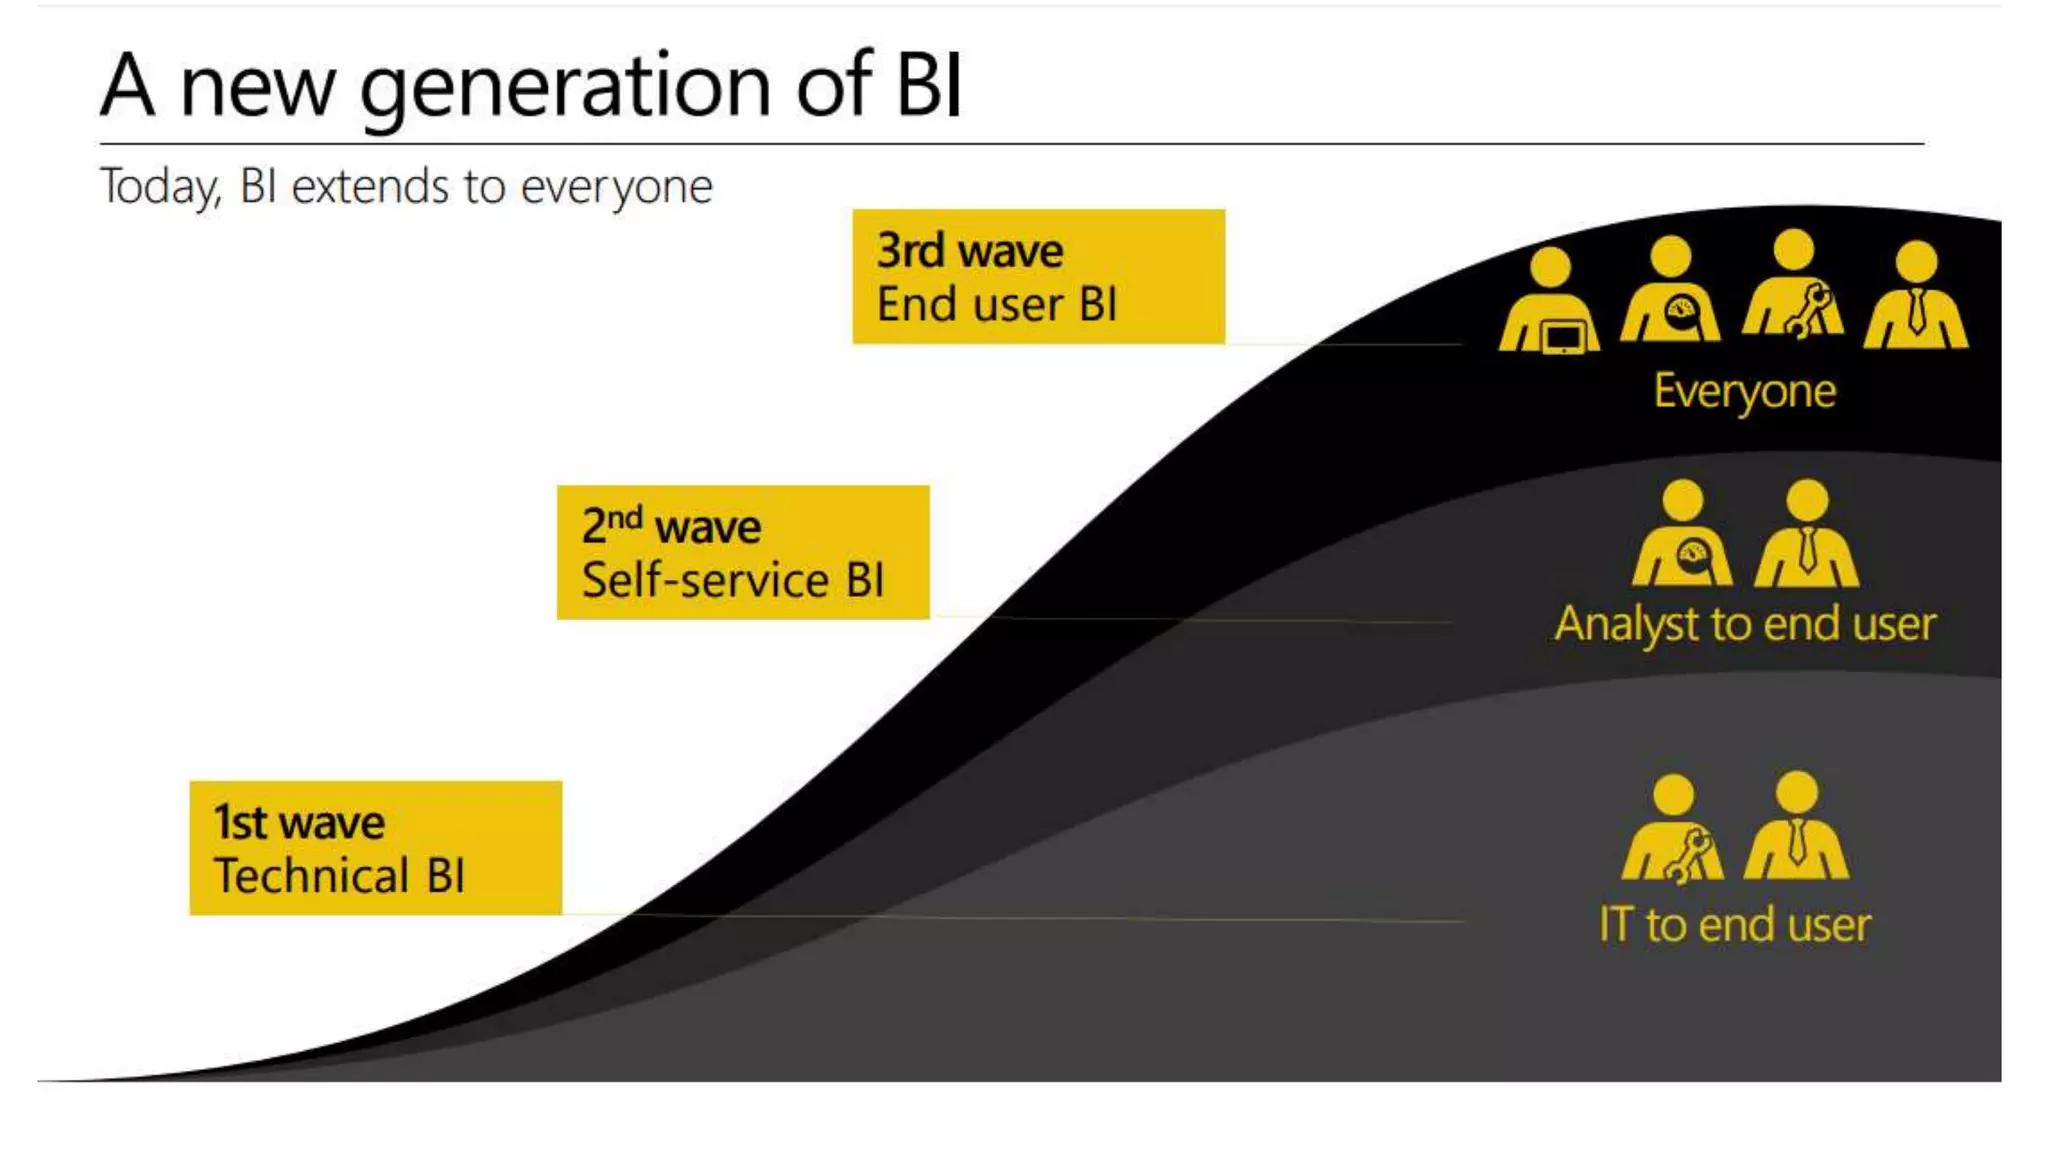
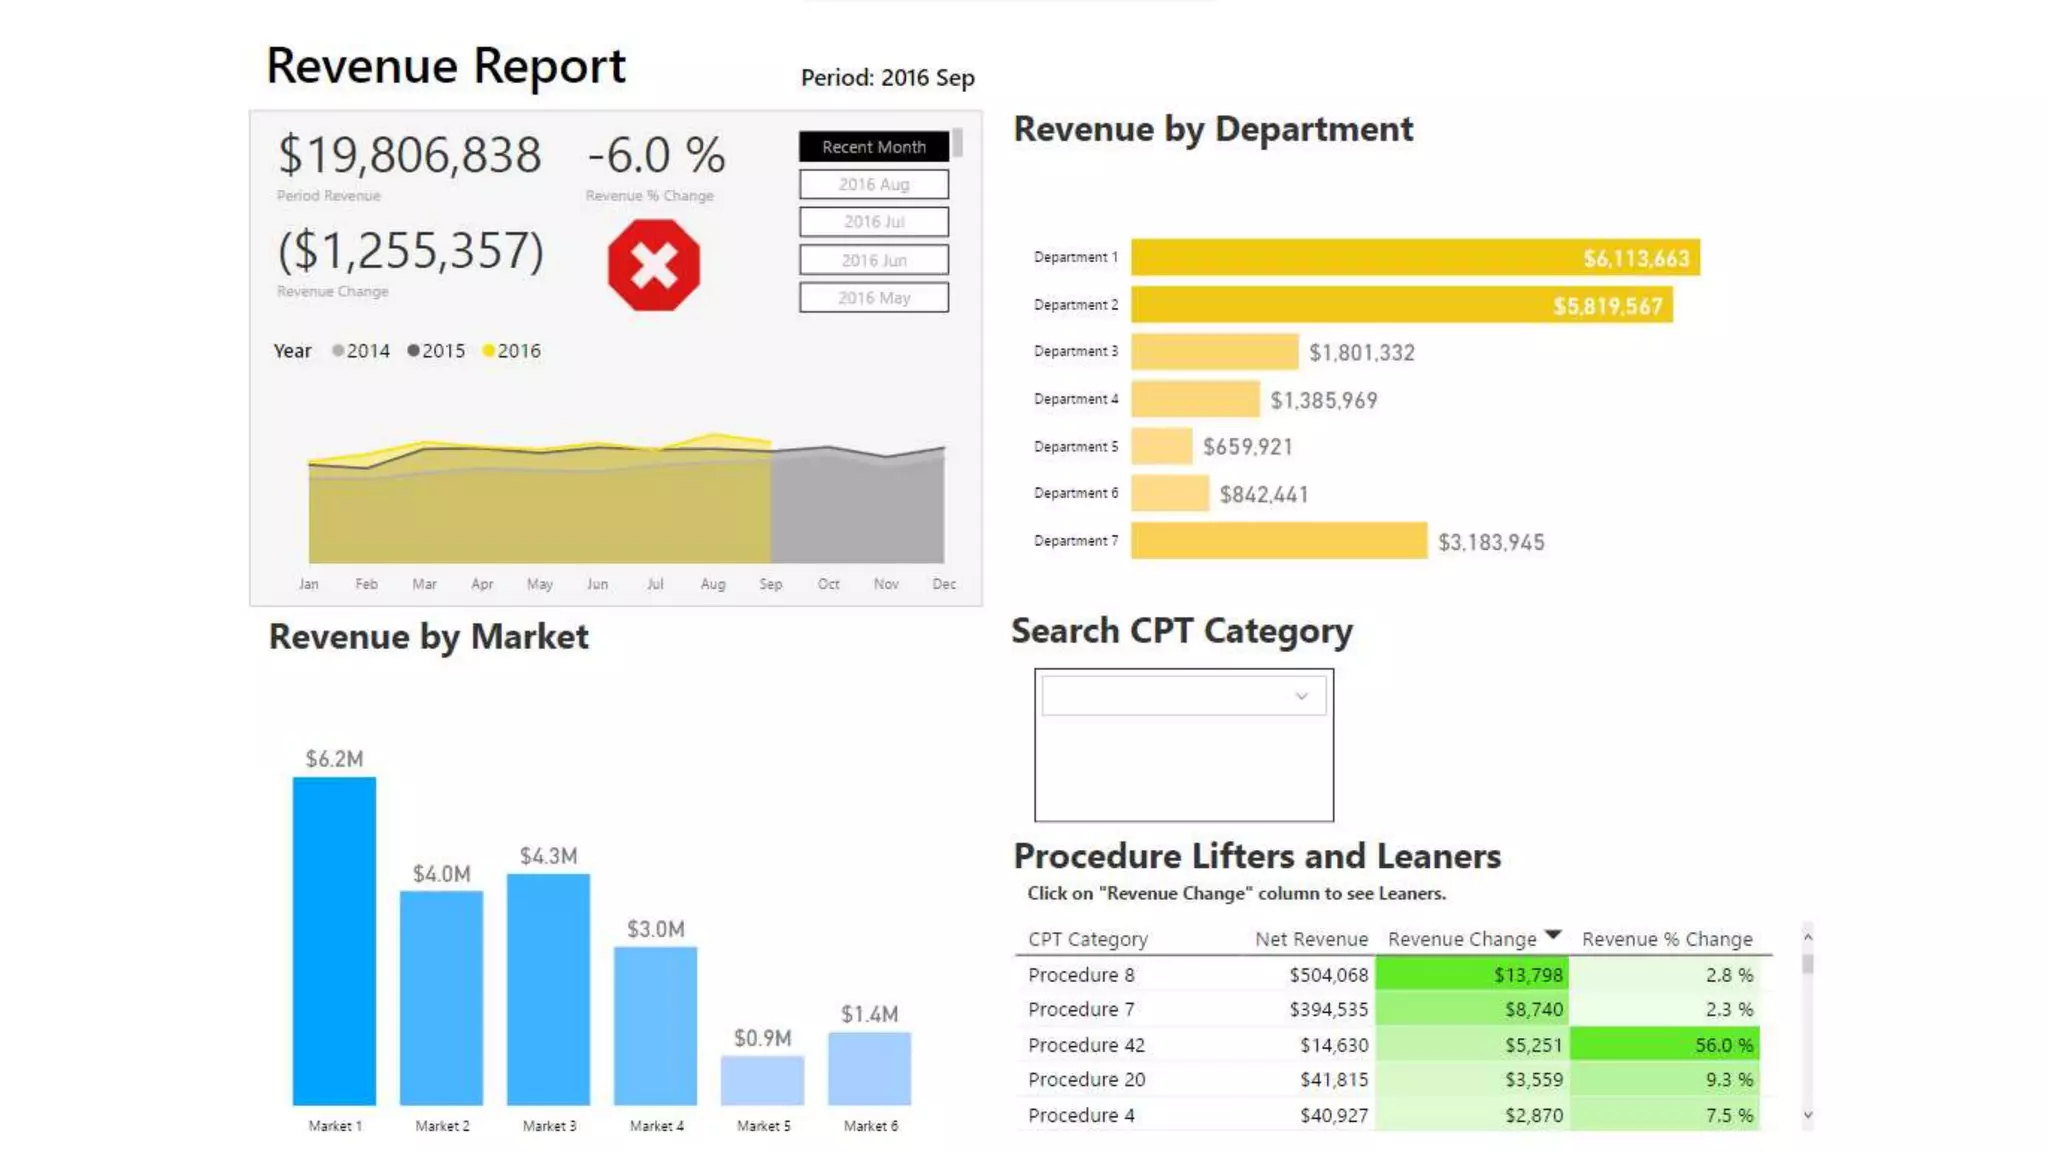
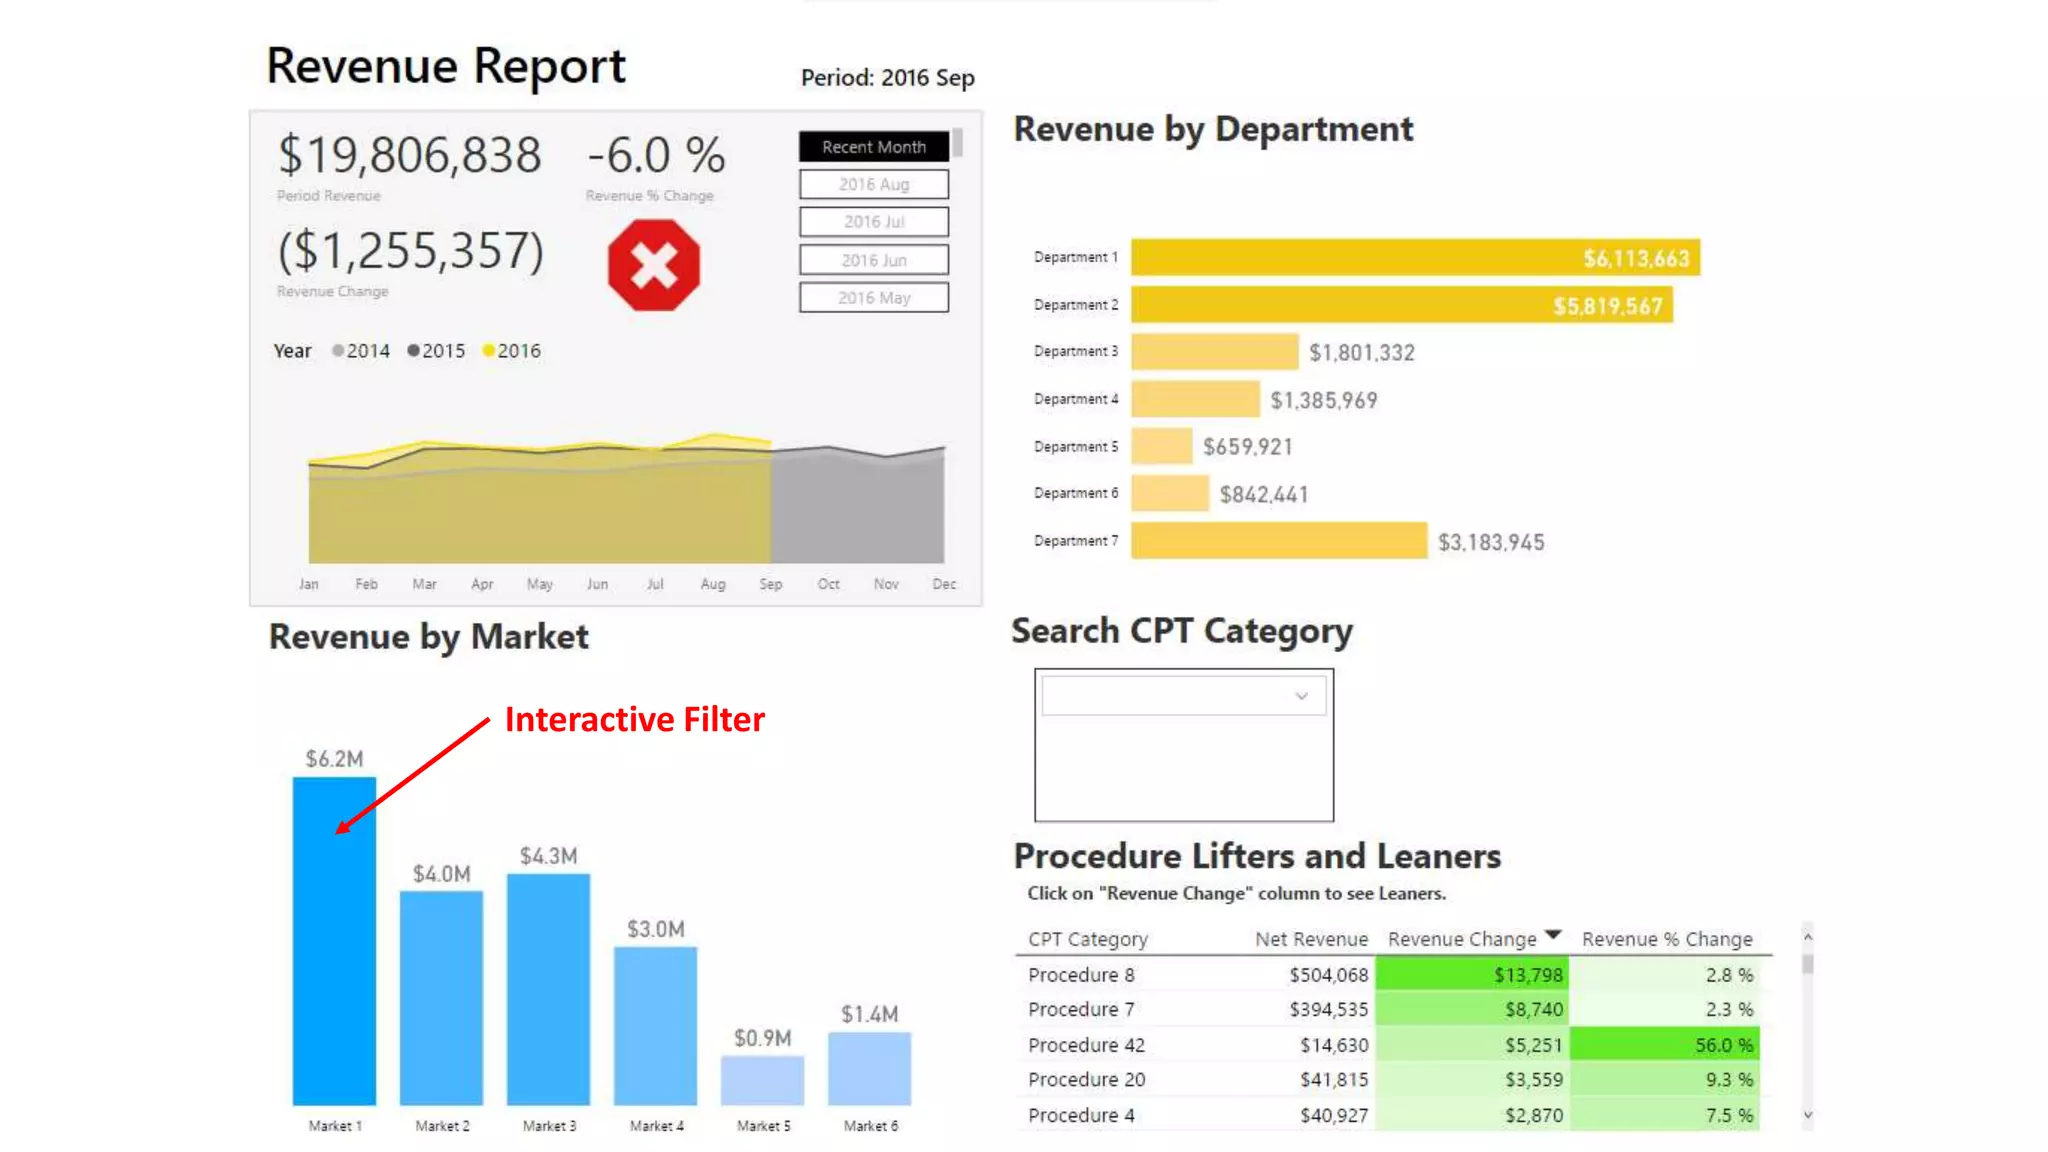
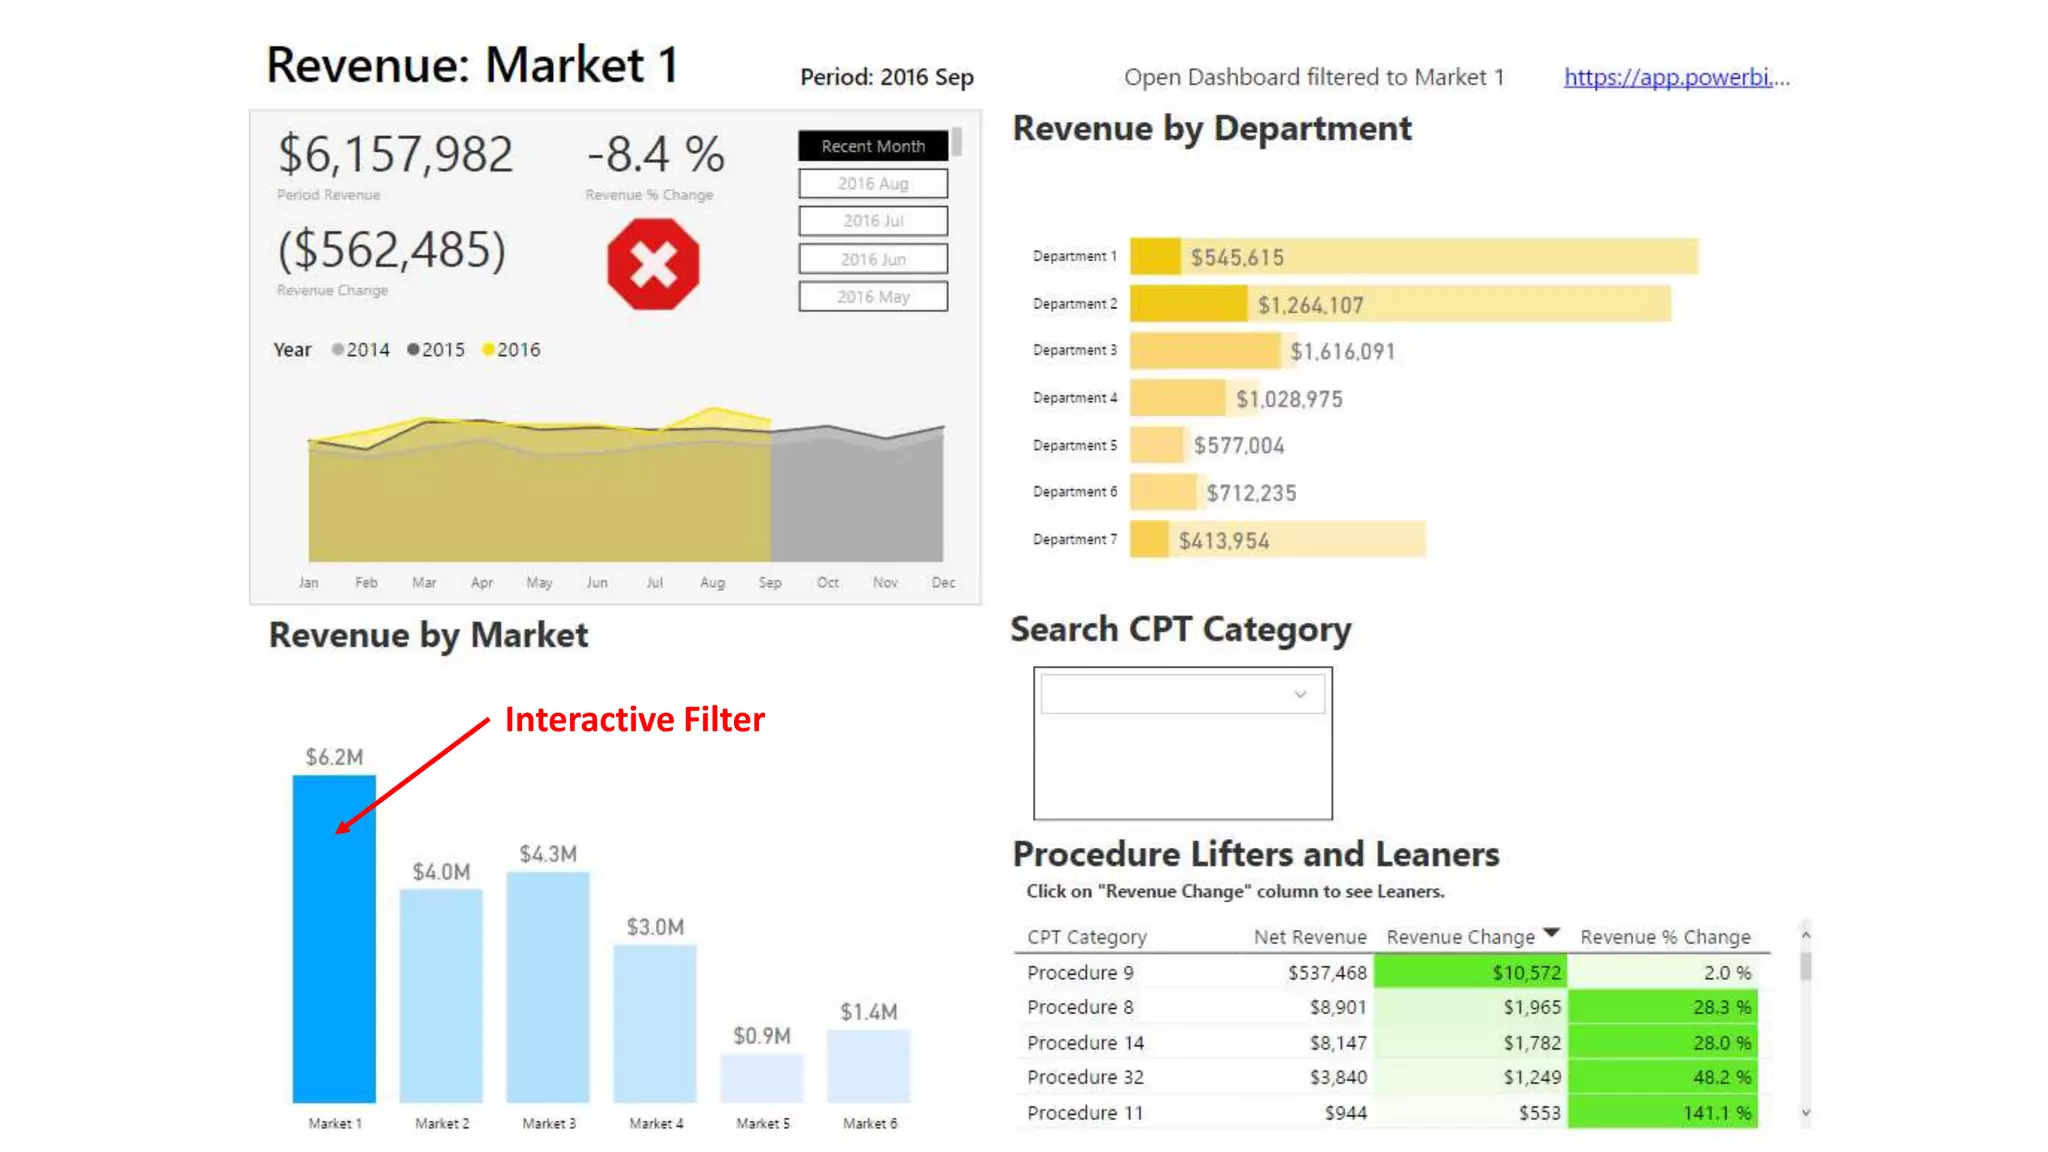
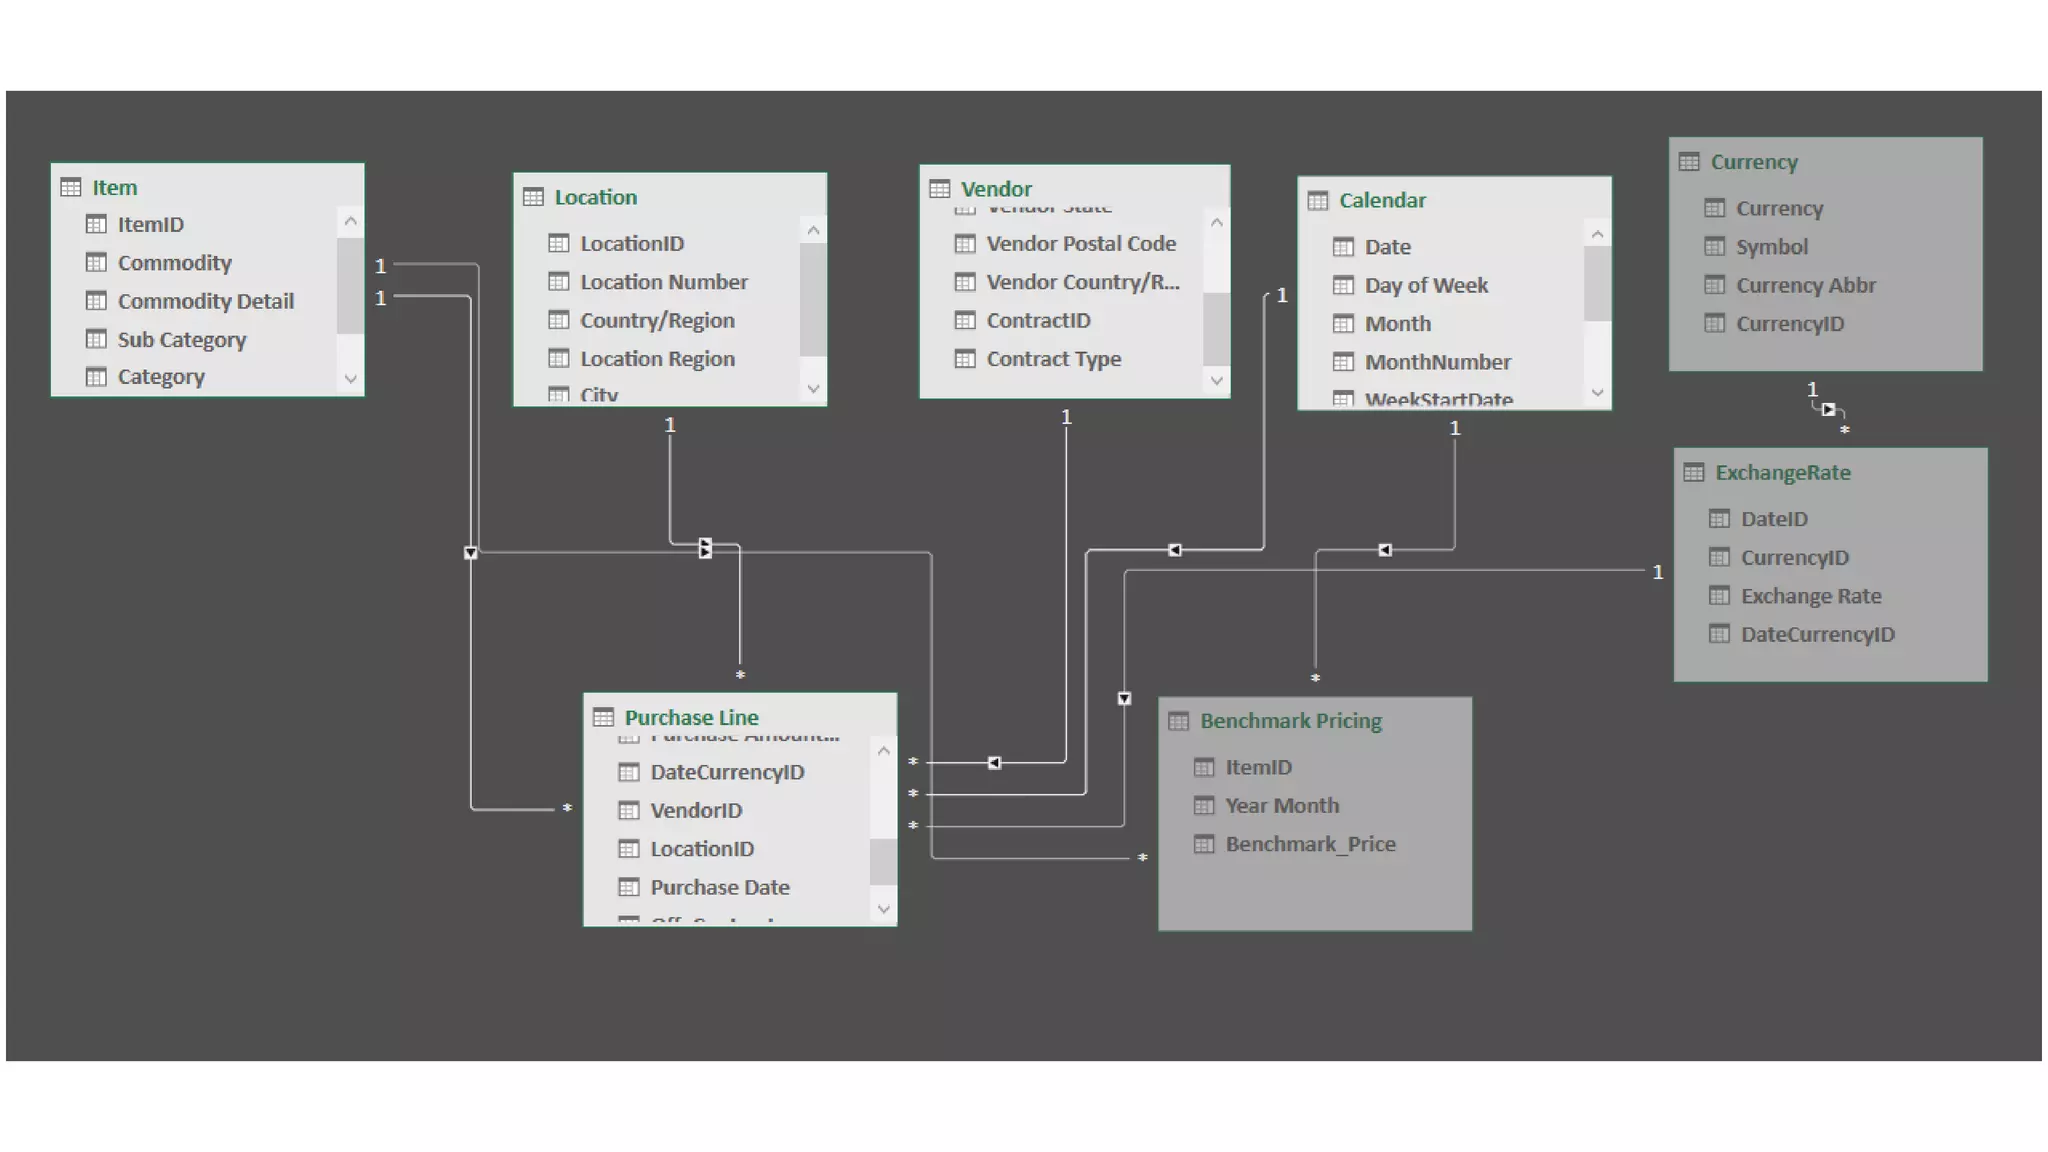


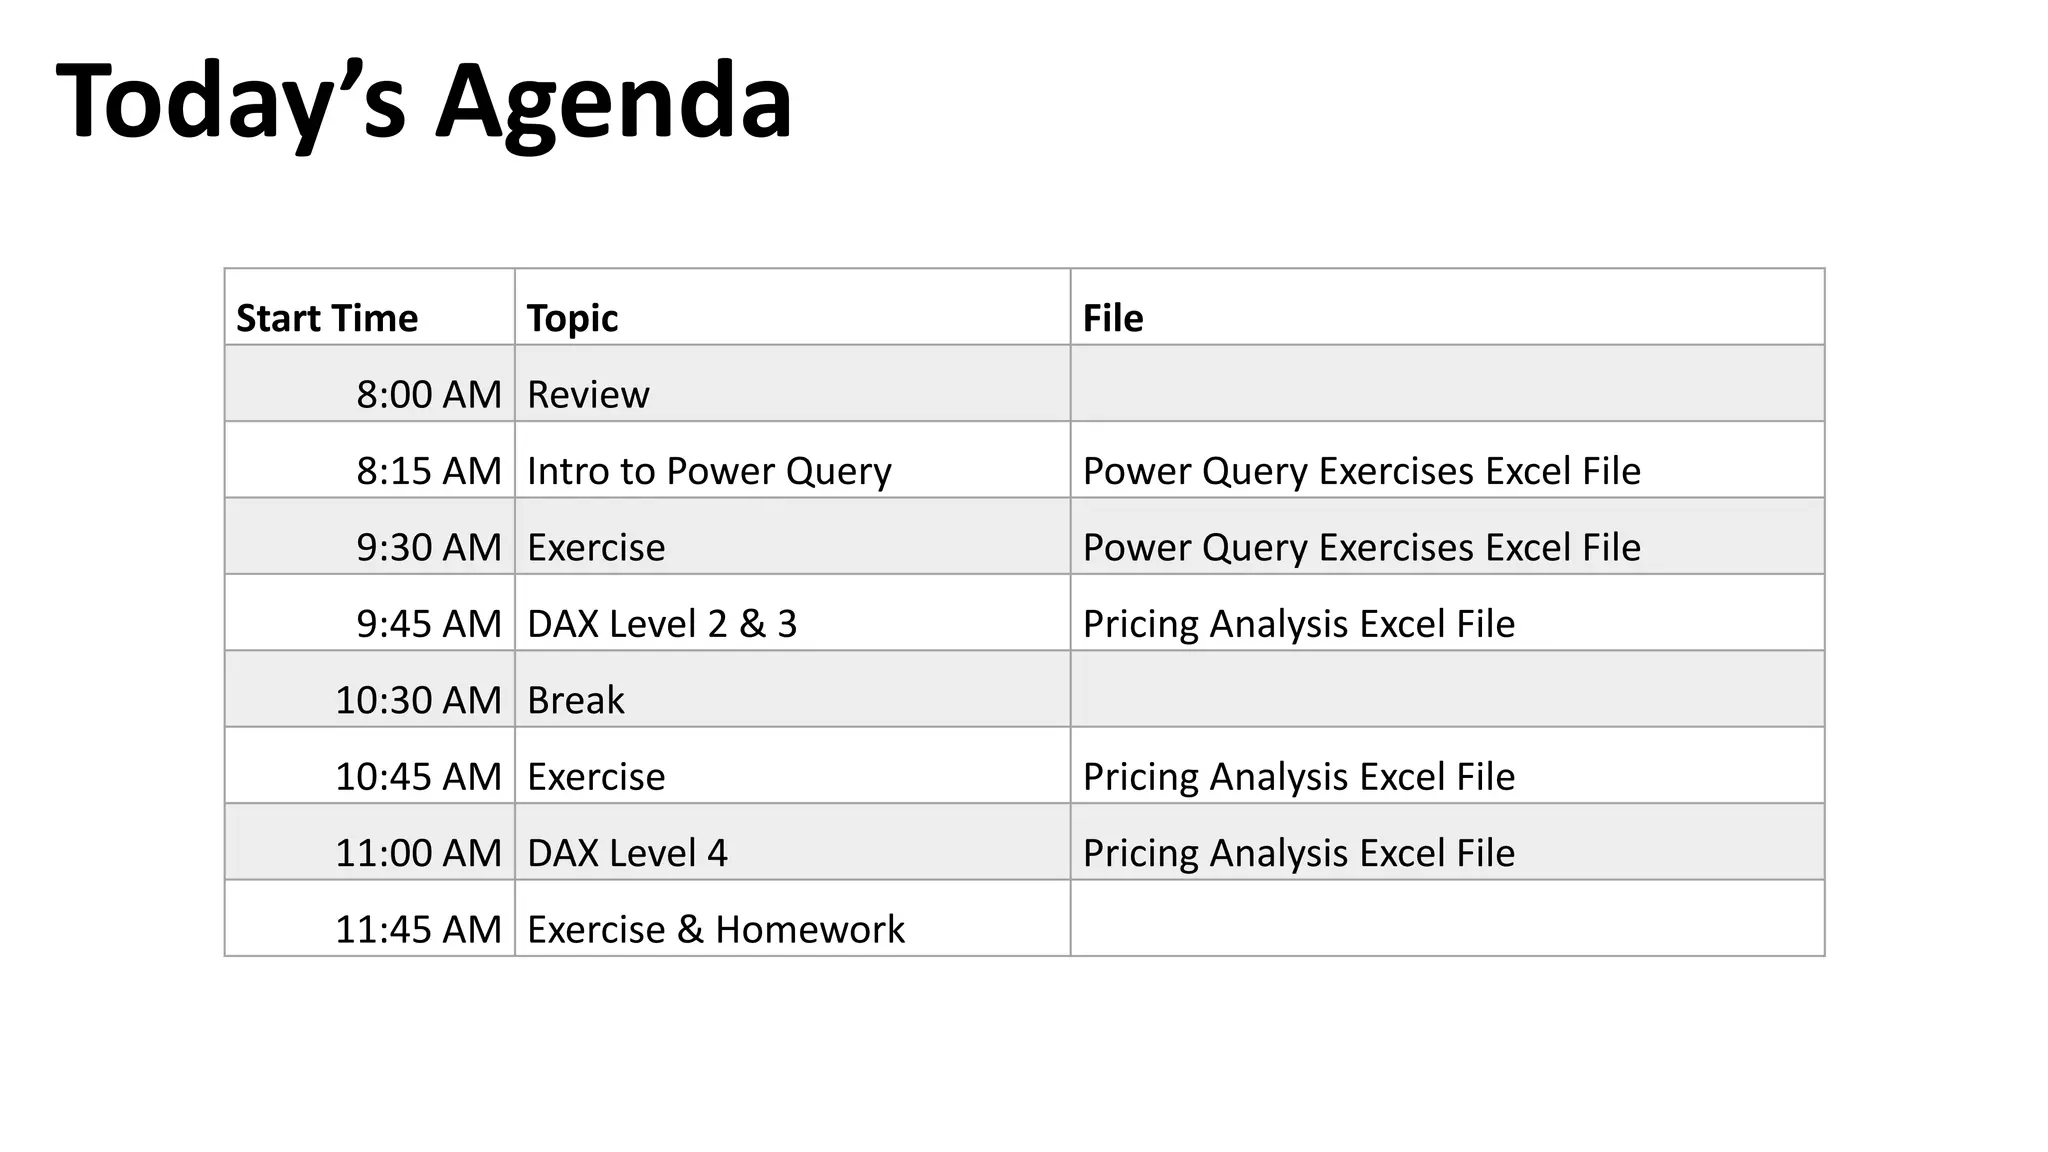


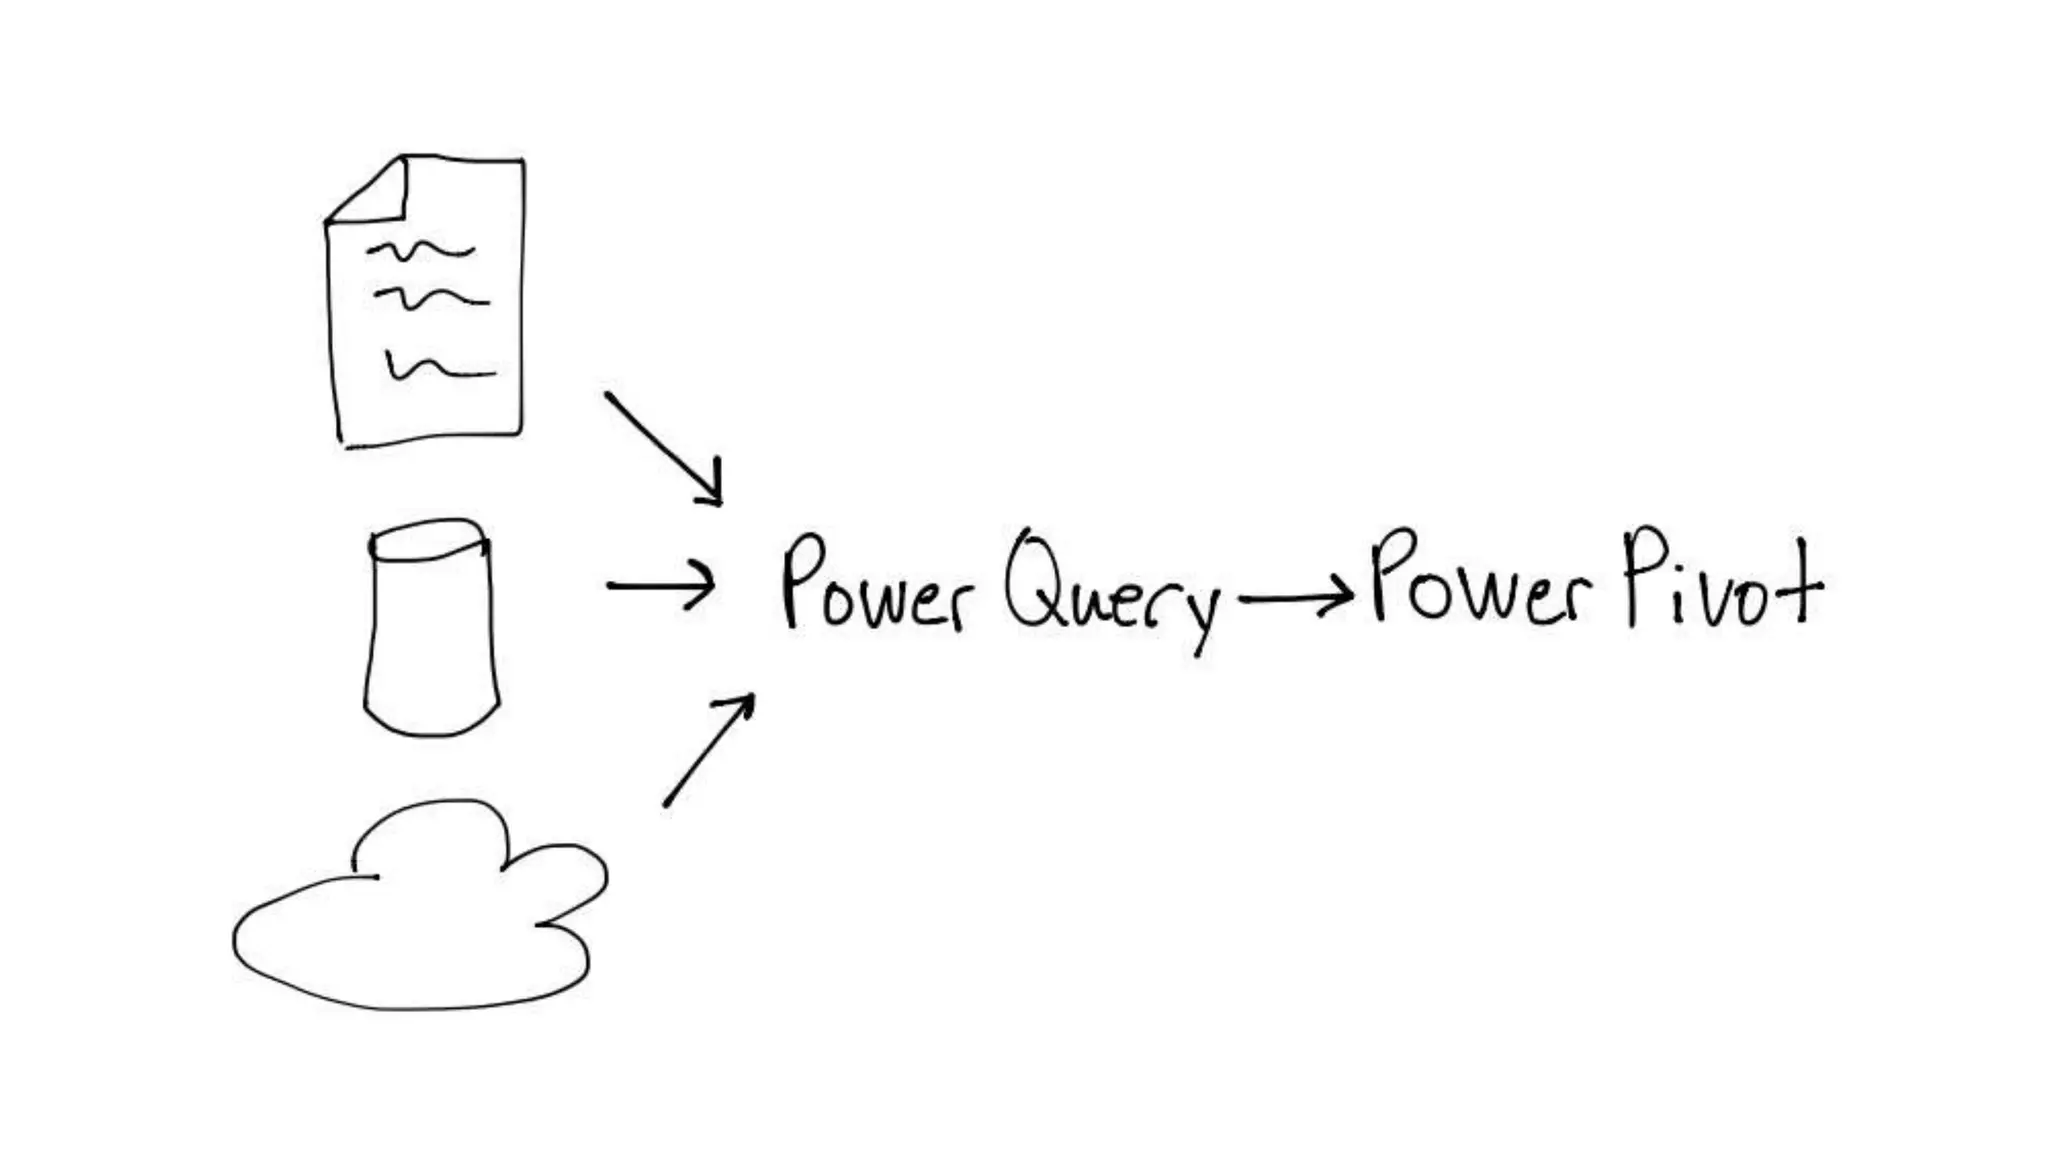
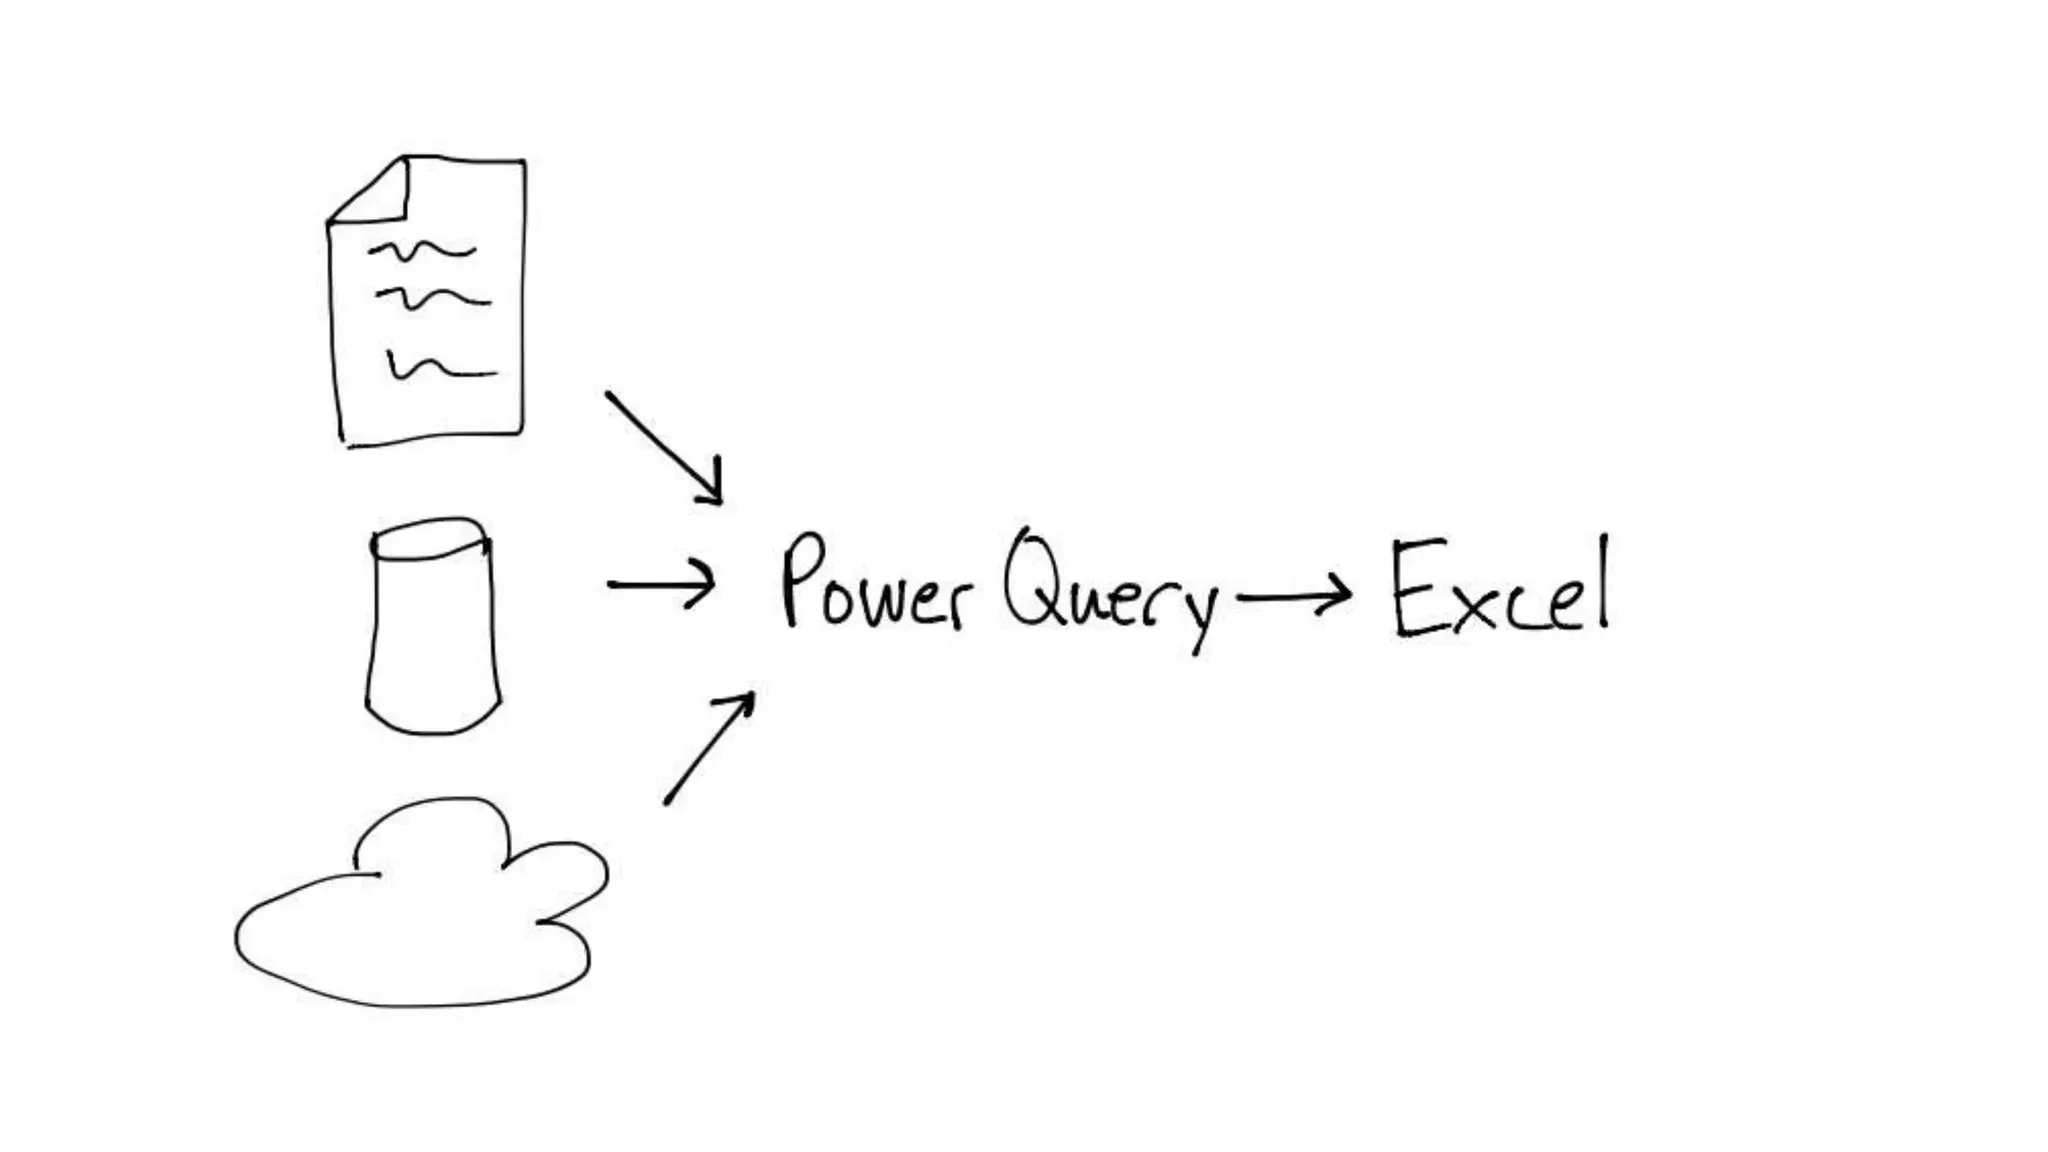
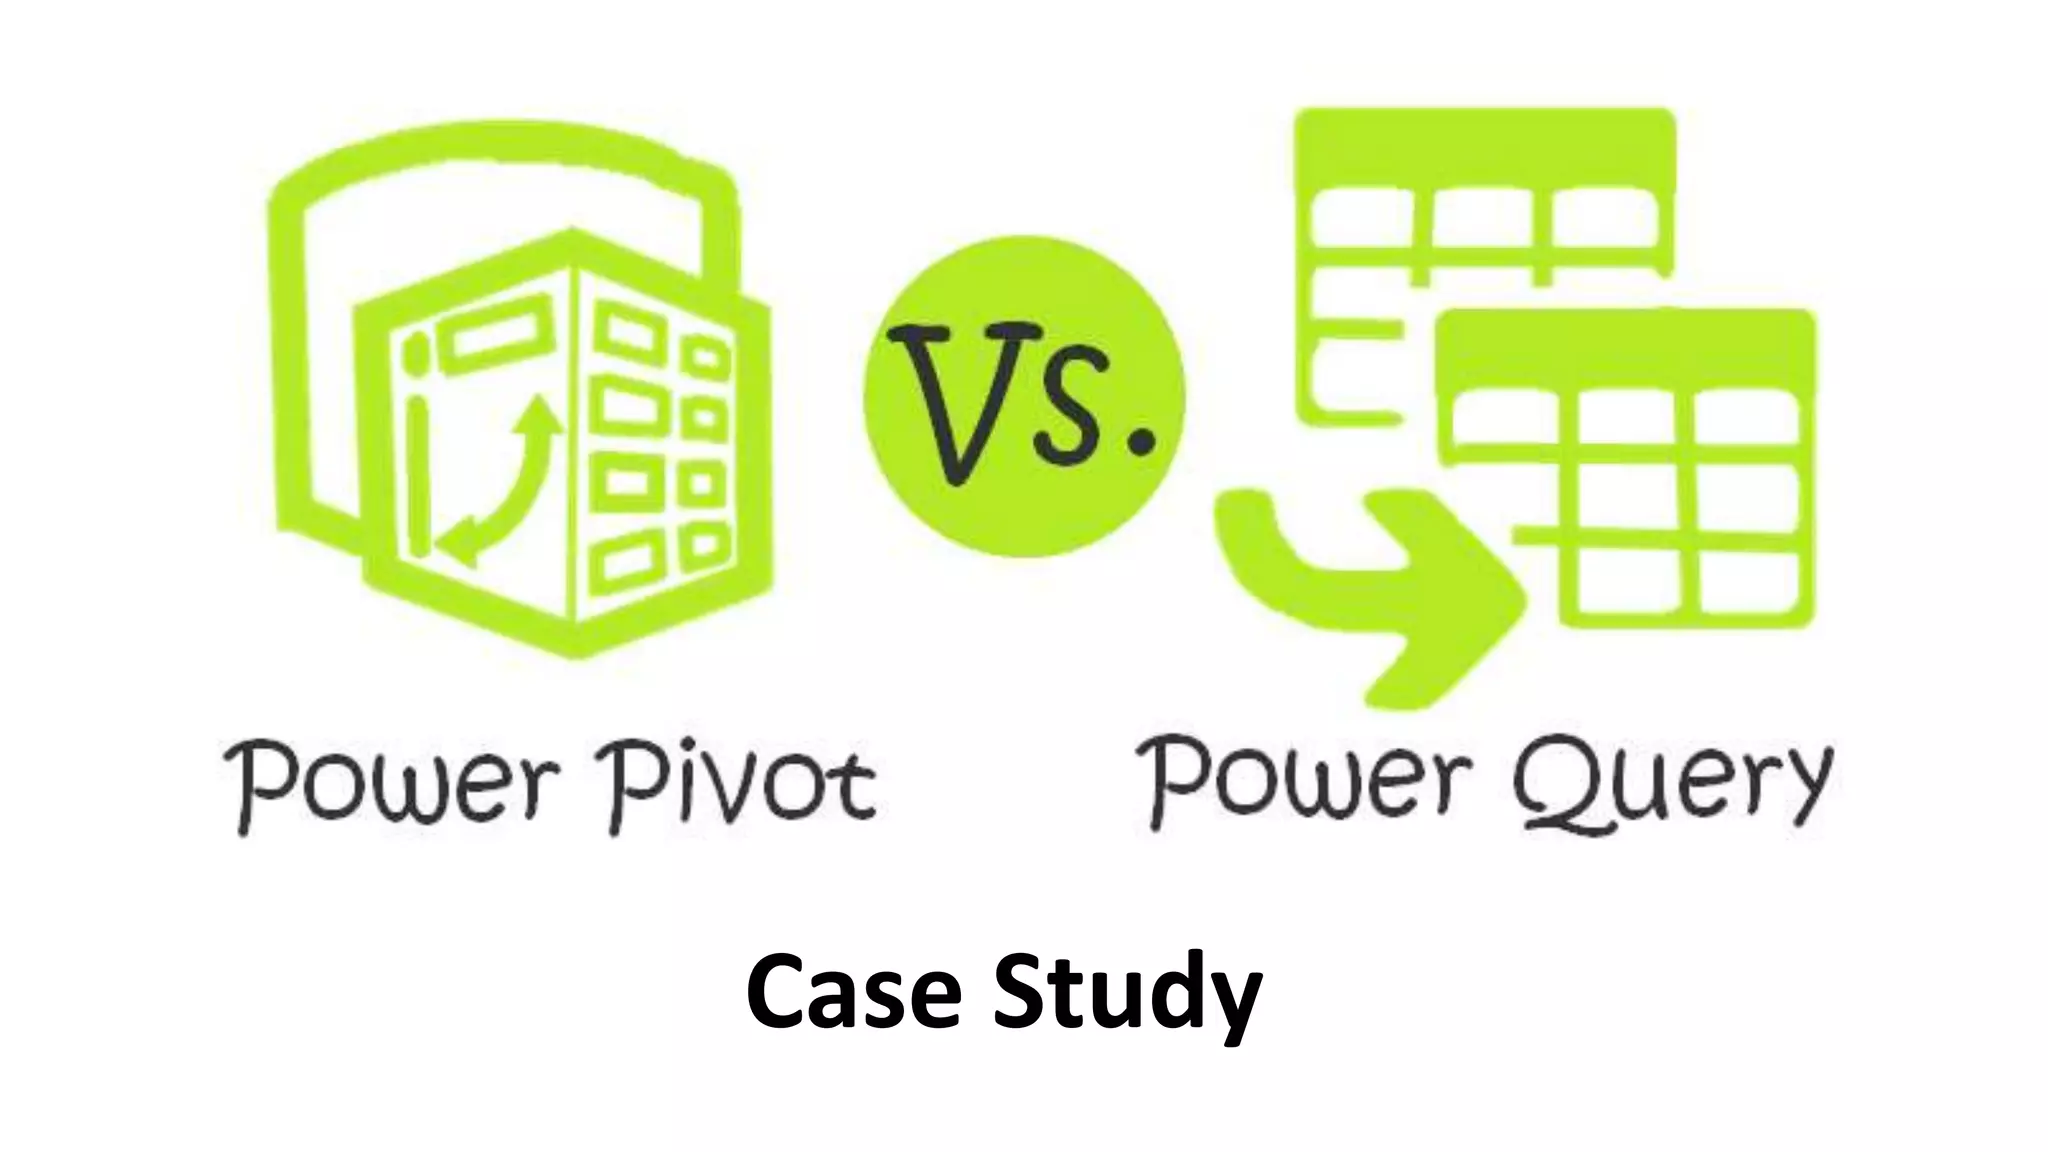
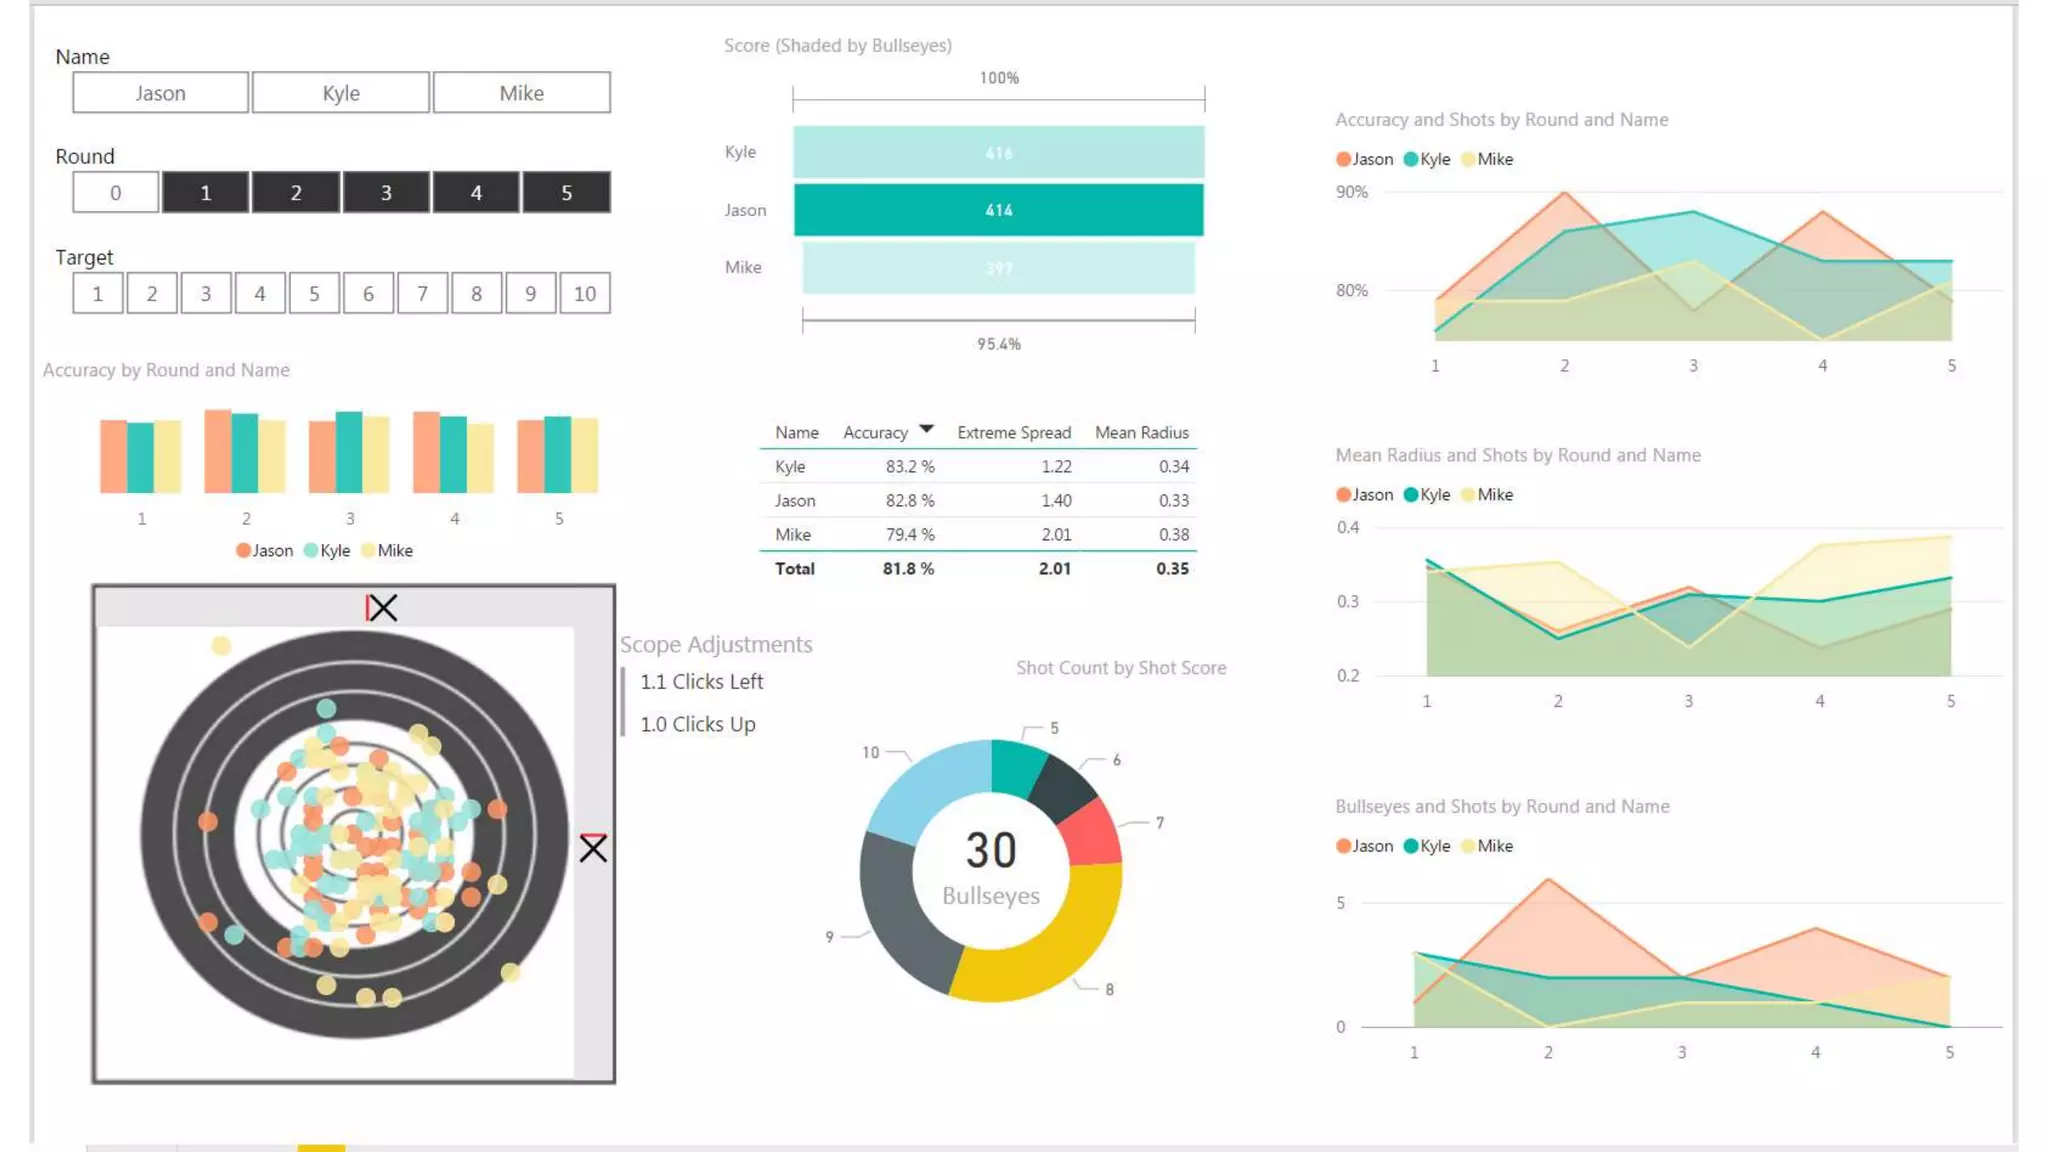

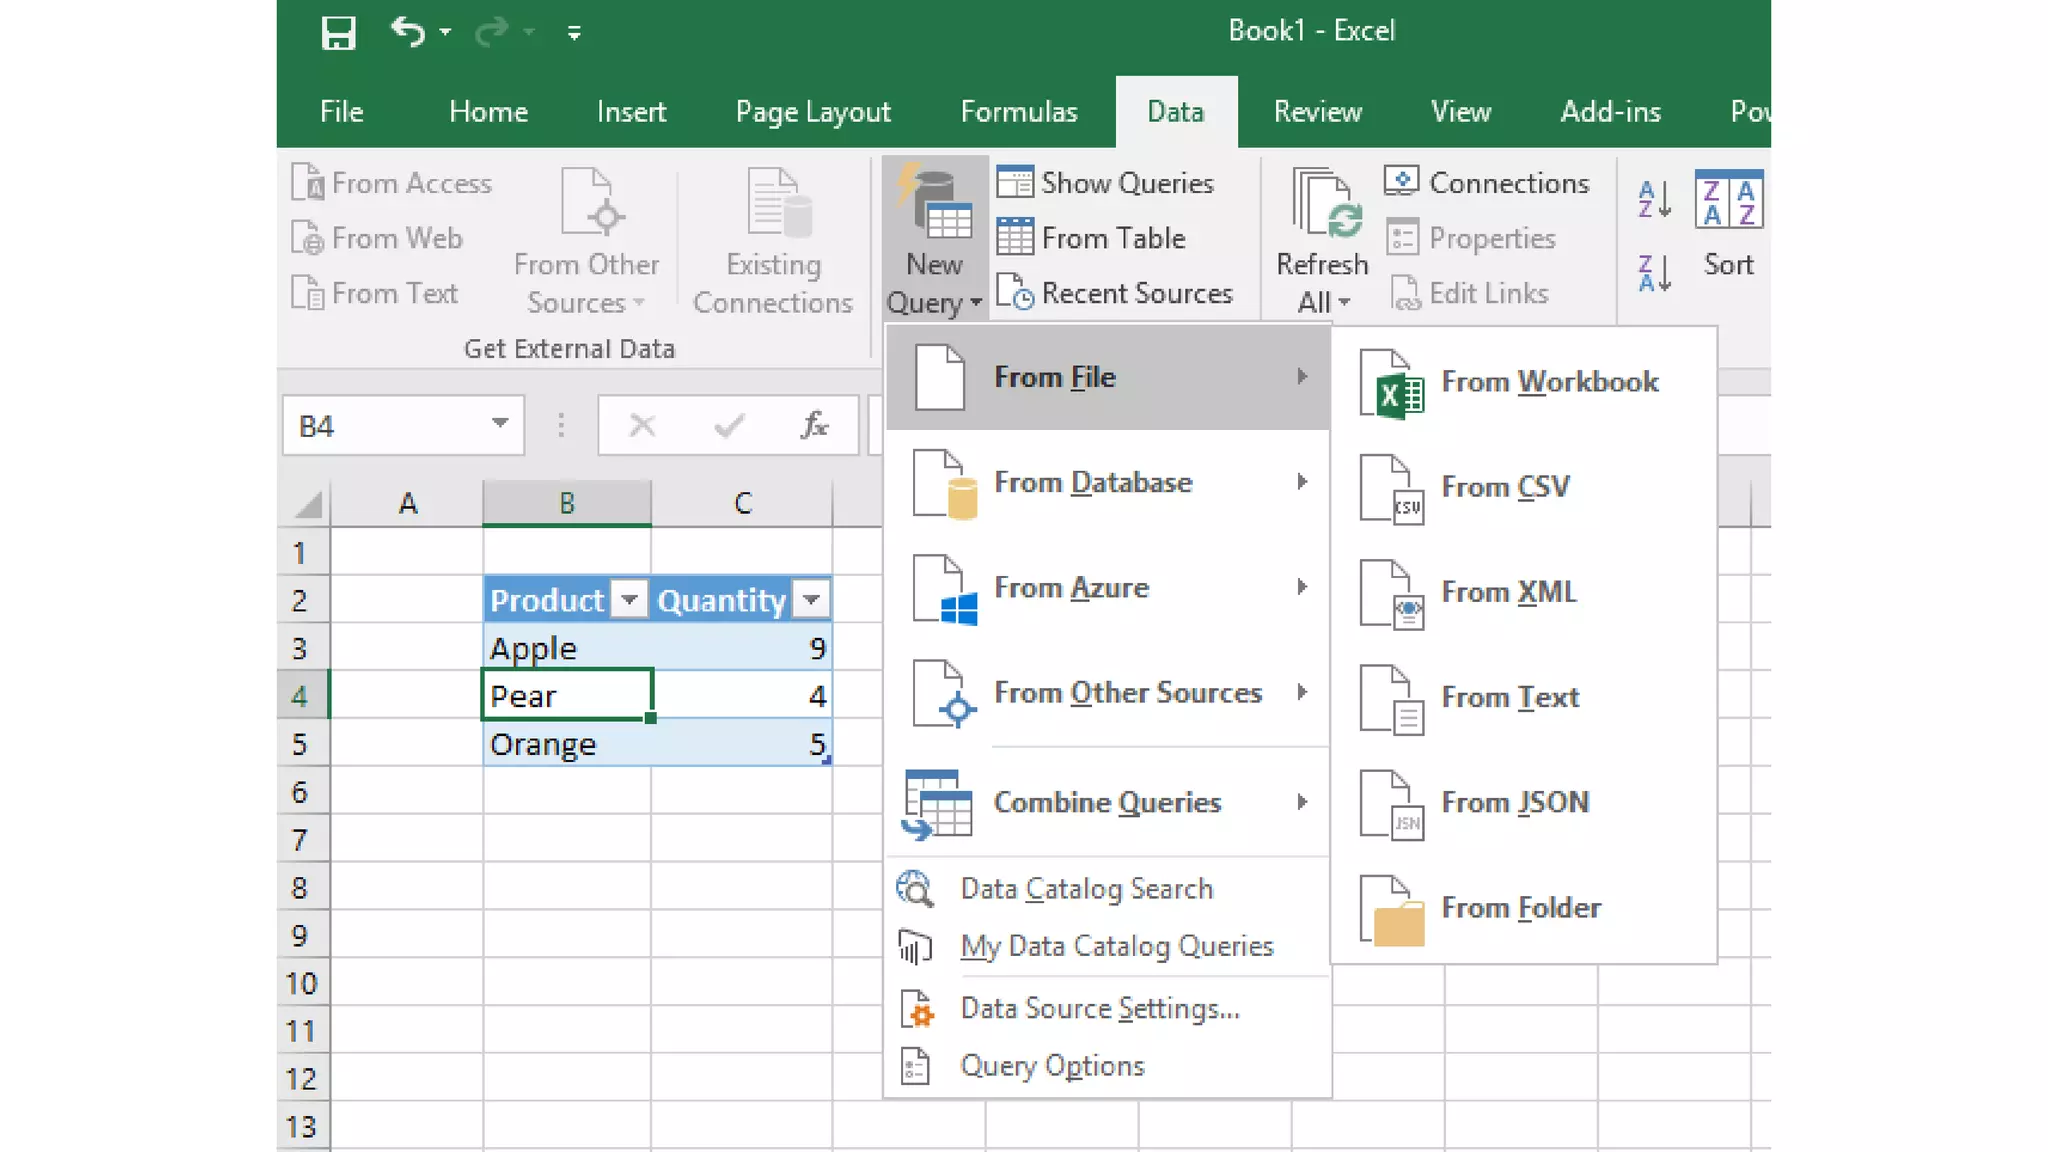

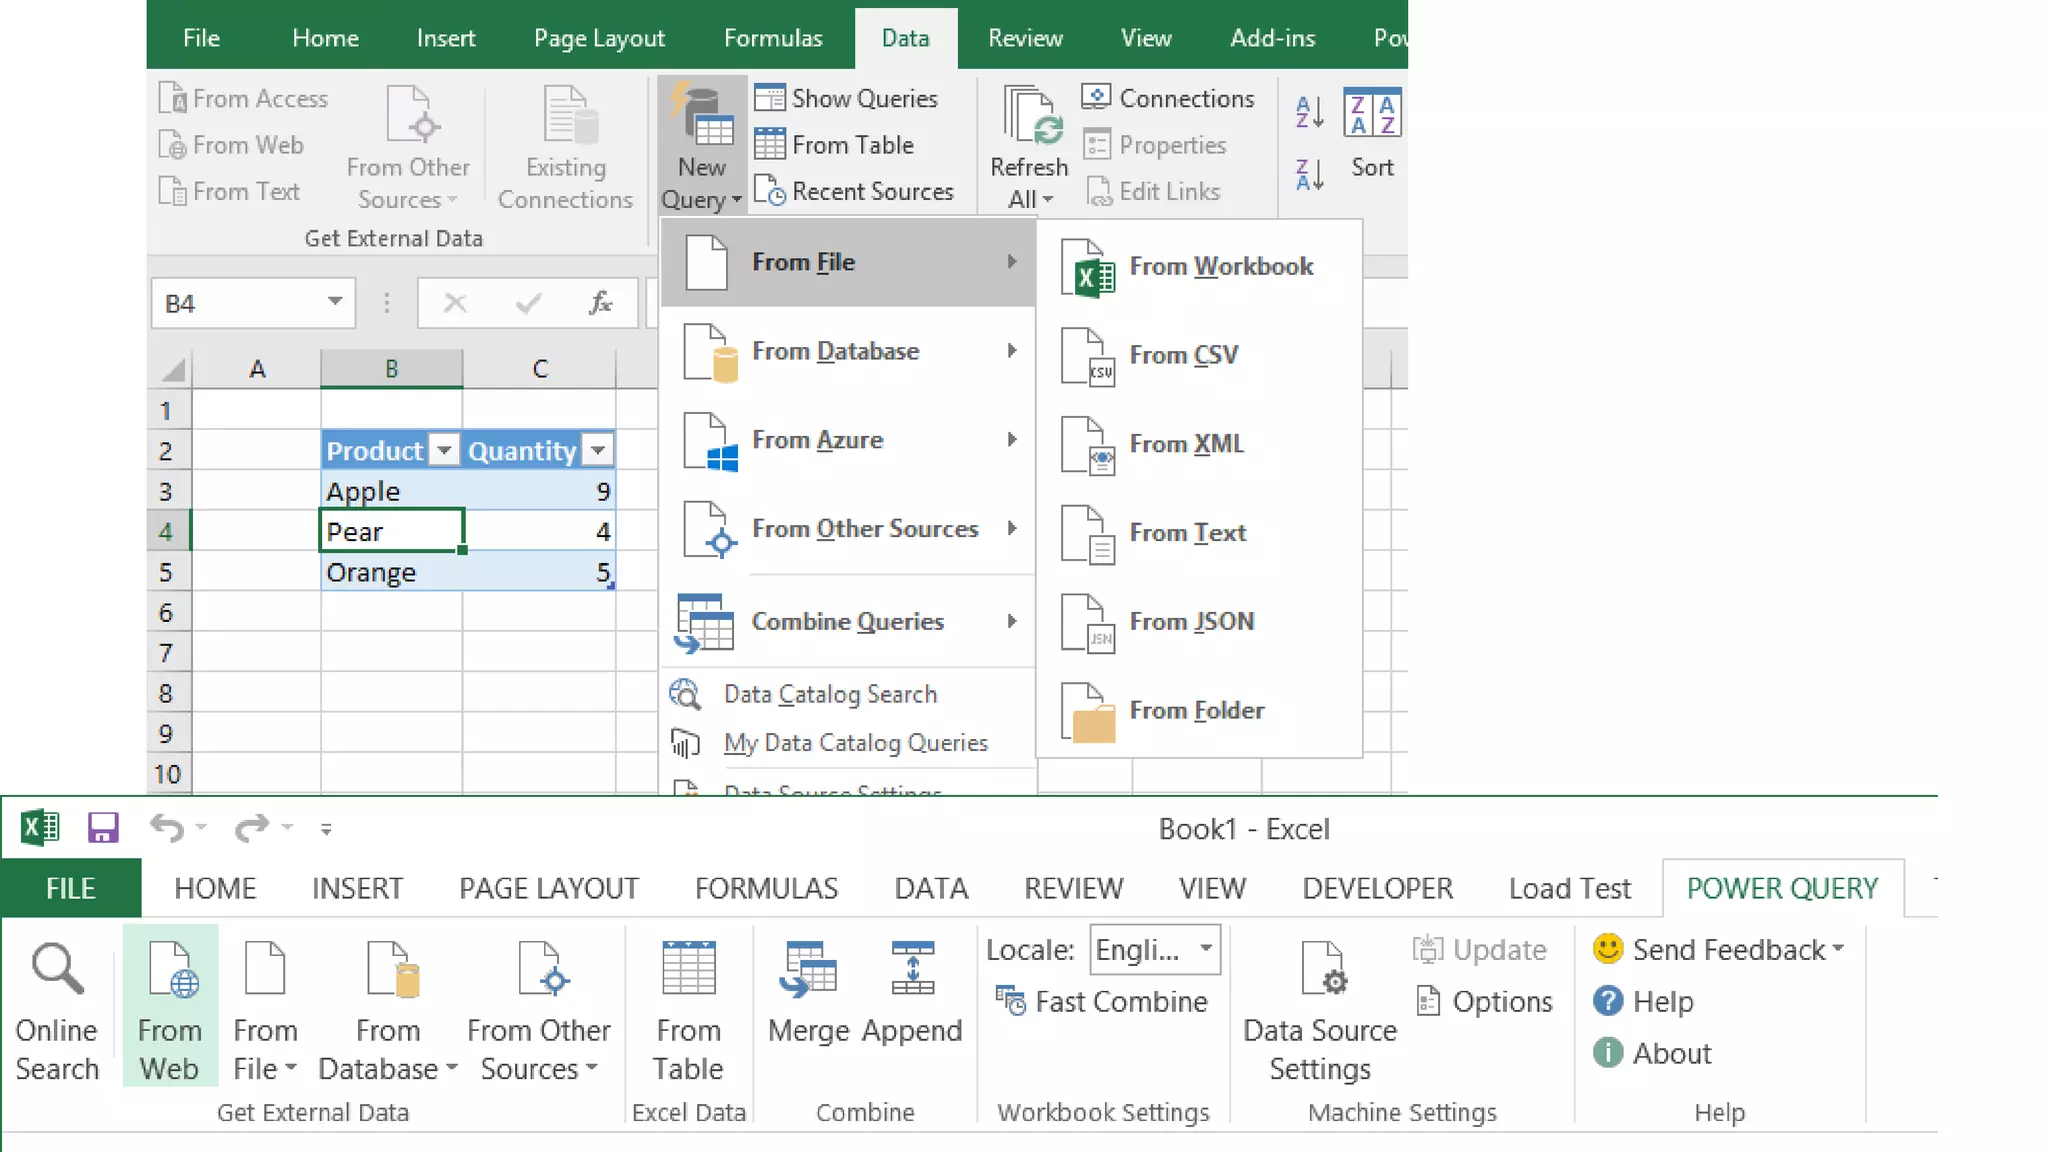


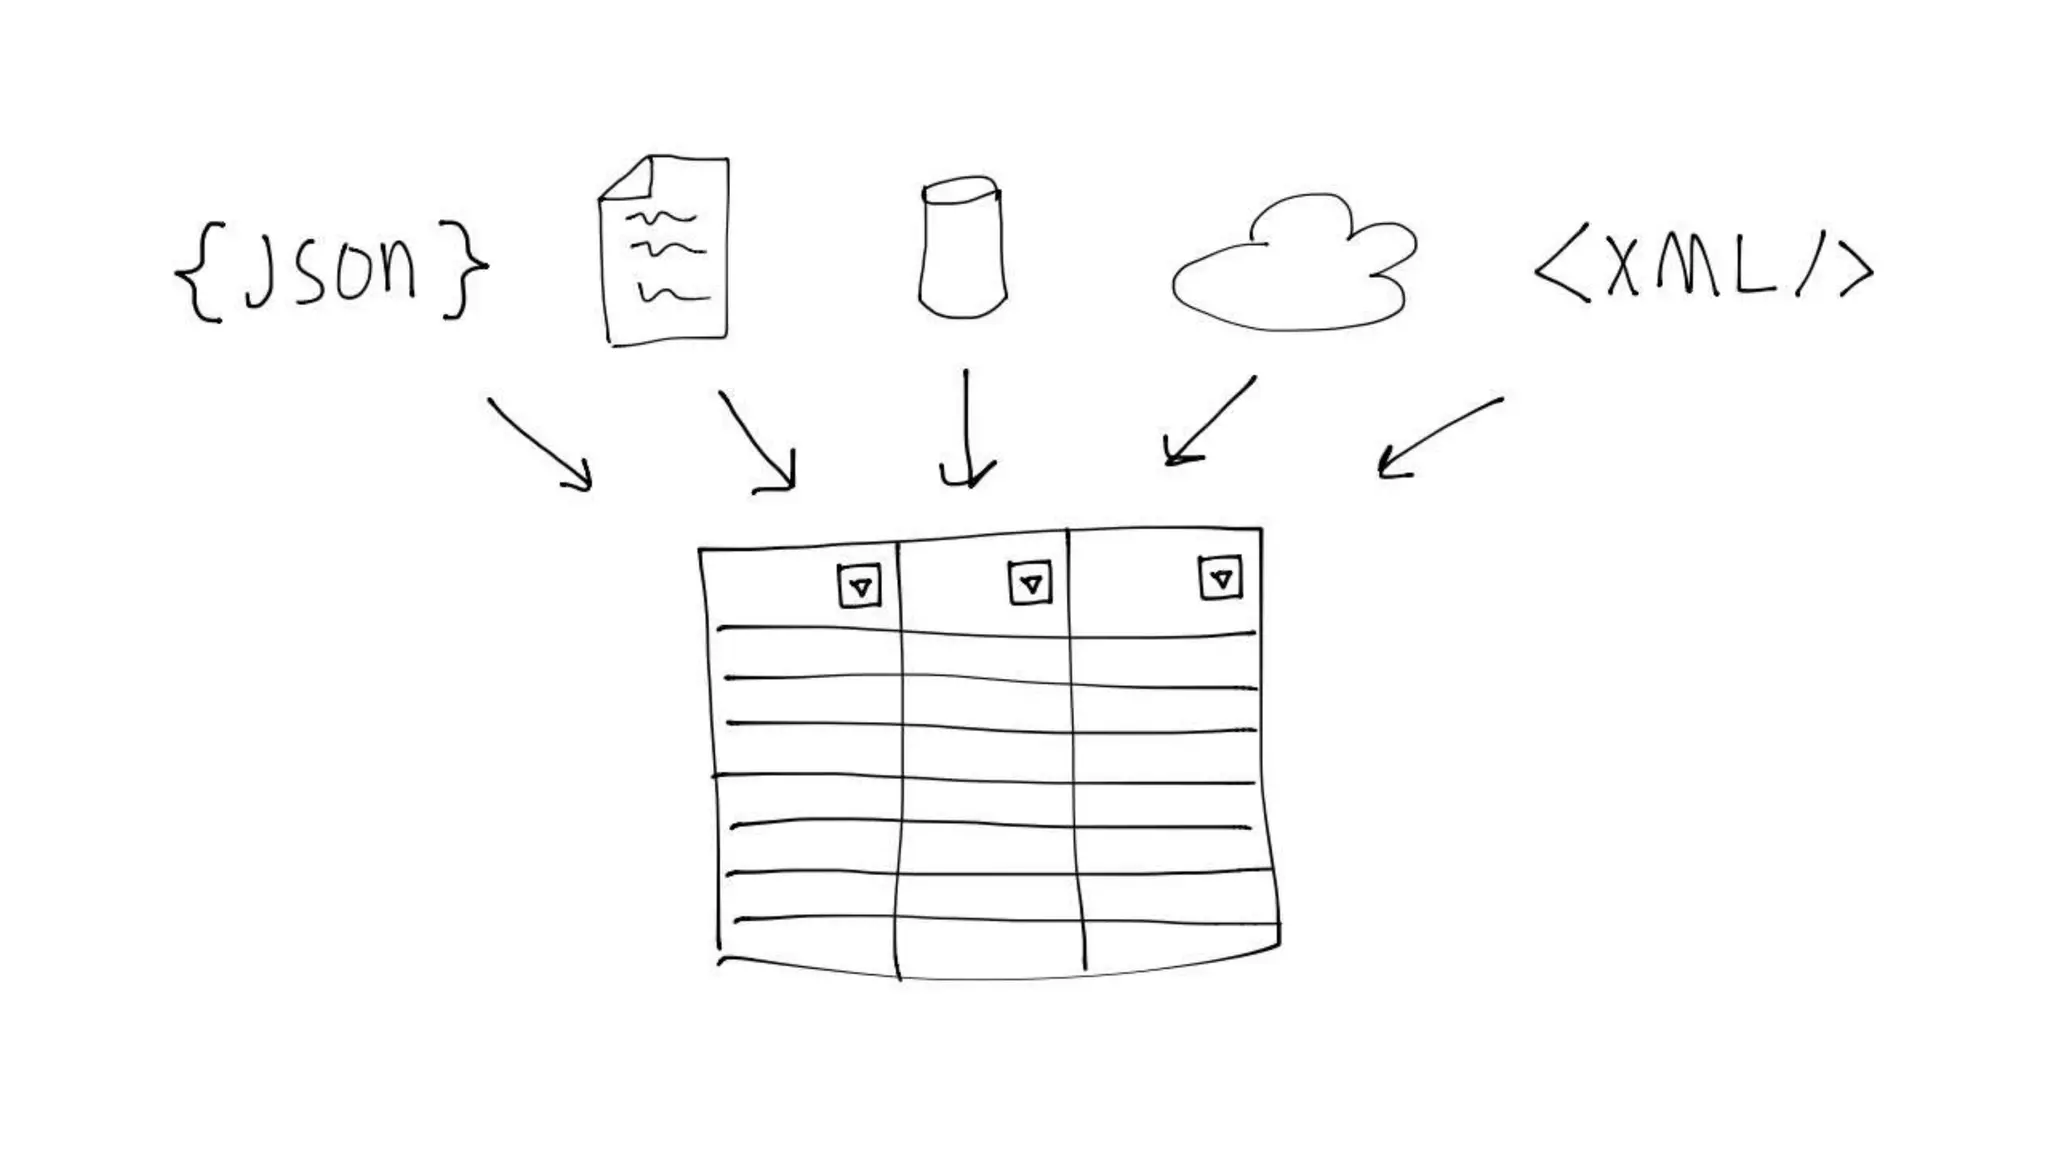


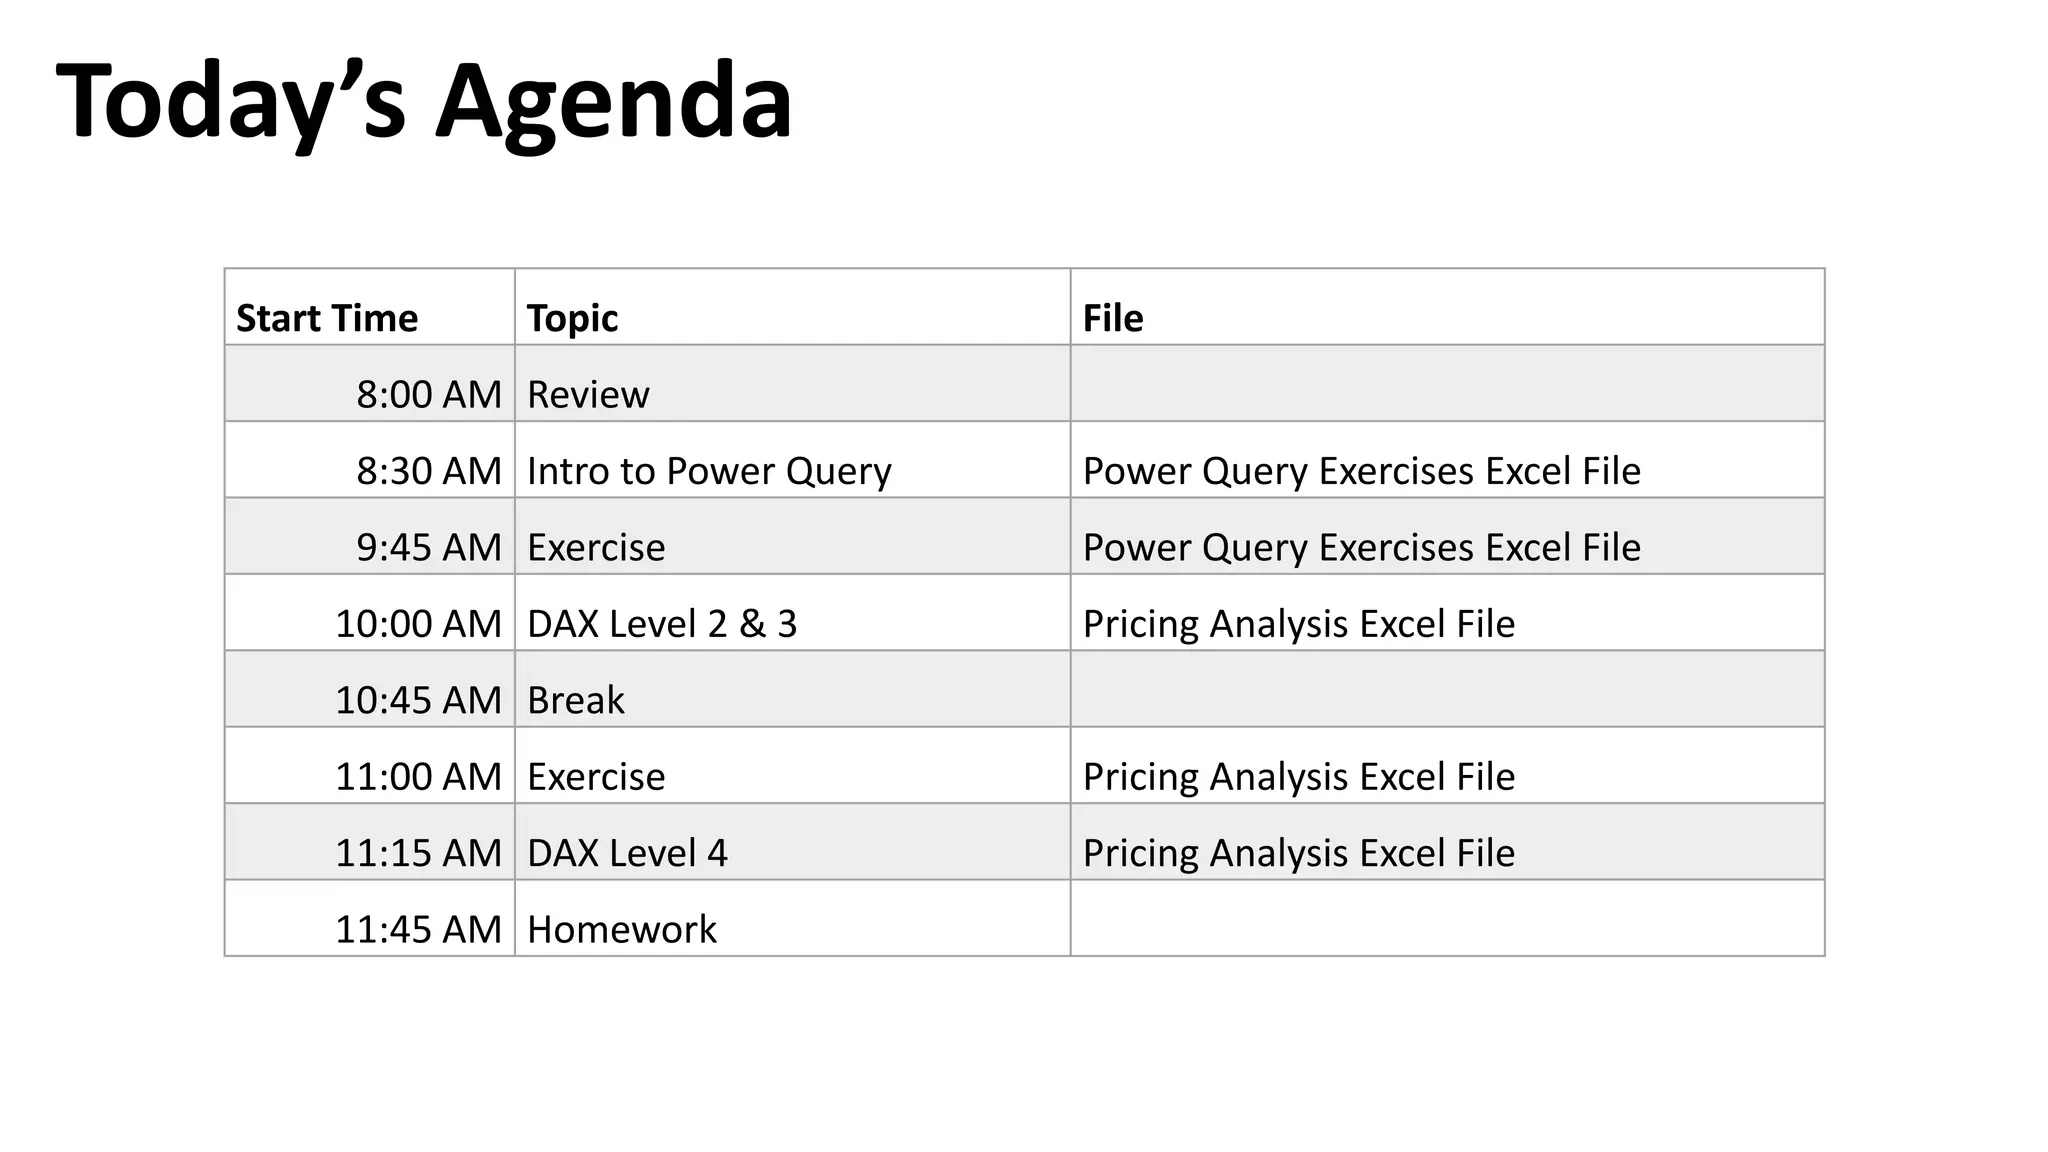

The document outlines a training agenda for DAX and Power BI, led by Shaun Shiveley and Steve Farrell, focusing on interactive filters and dashboard creation. It covers topics like Power Query, pricing analysis exercises, and hands-on demos, with specific sessions scheduled from 8:00 AM to 11:45 AM. The training aims to enhance skills in data handling and visualization through various exercises and case studies.


![Vibe Coding vs. Spec-Driven Development [Free Meetup]](https://cdn.slidesharecdn.com/ss_thumbnails/vibecodingvsspecdrivendevelopment-251209105622-43f455e7-thumbnail.jpg?width=640&height=640&fit=bounds)


