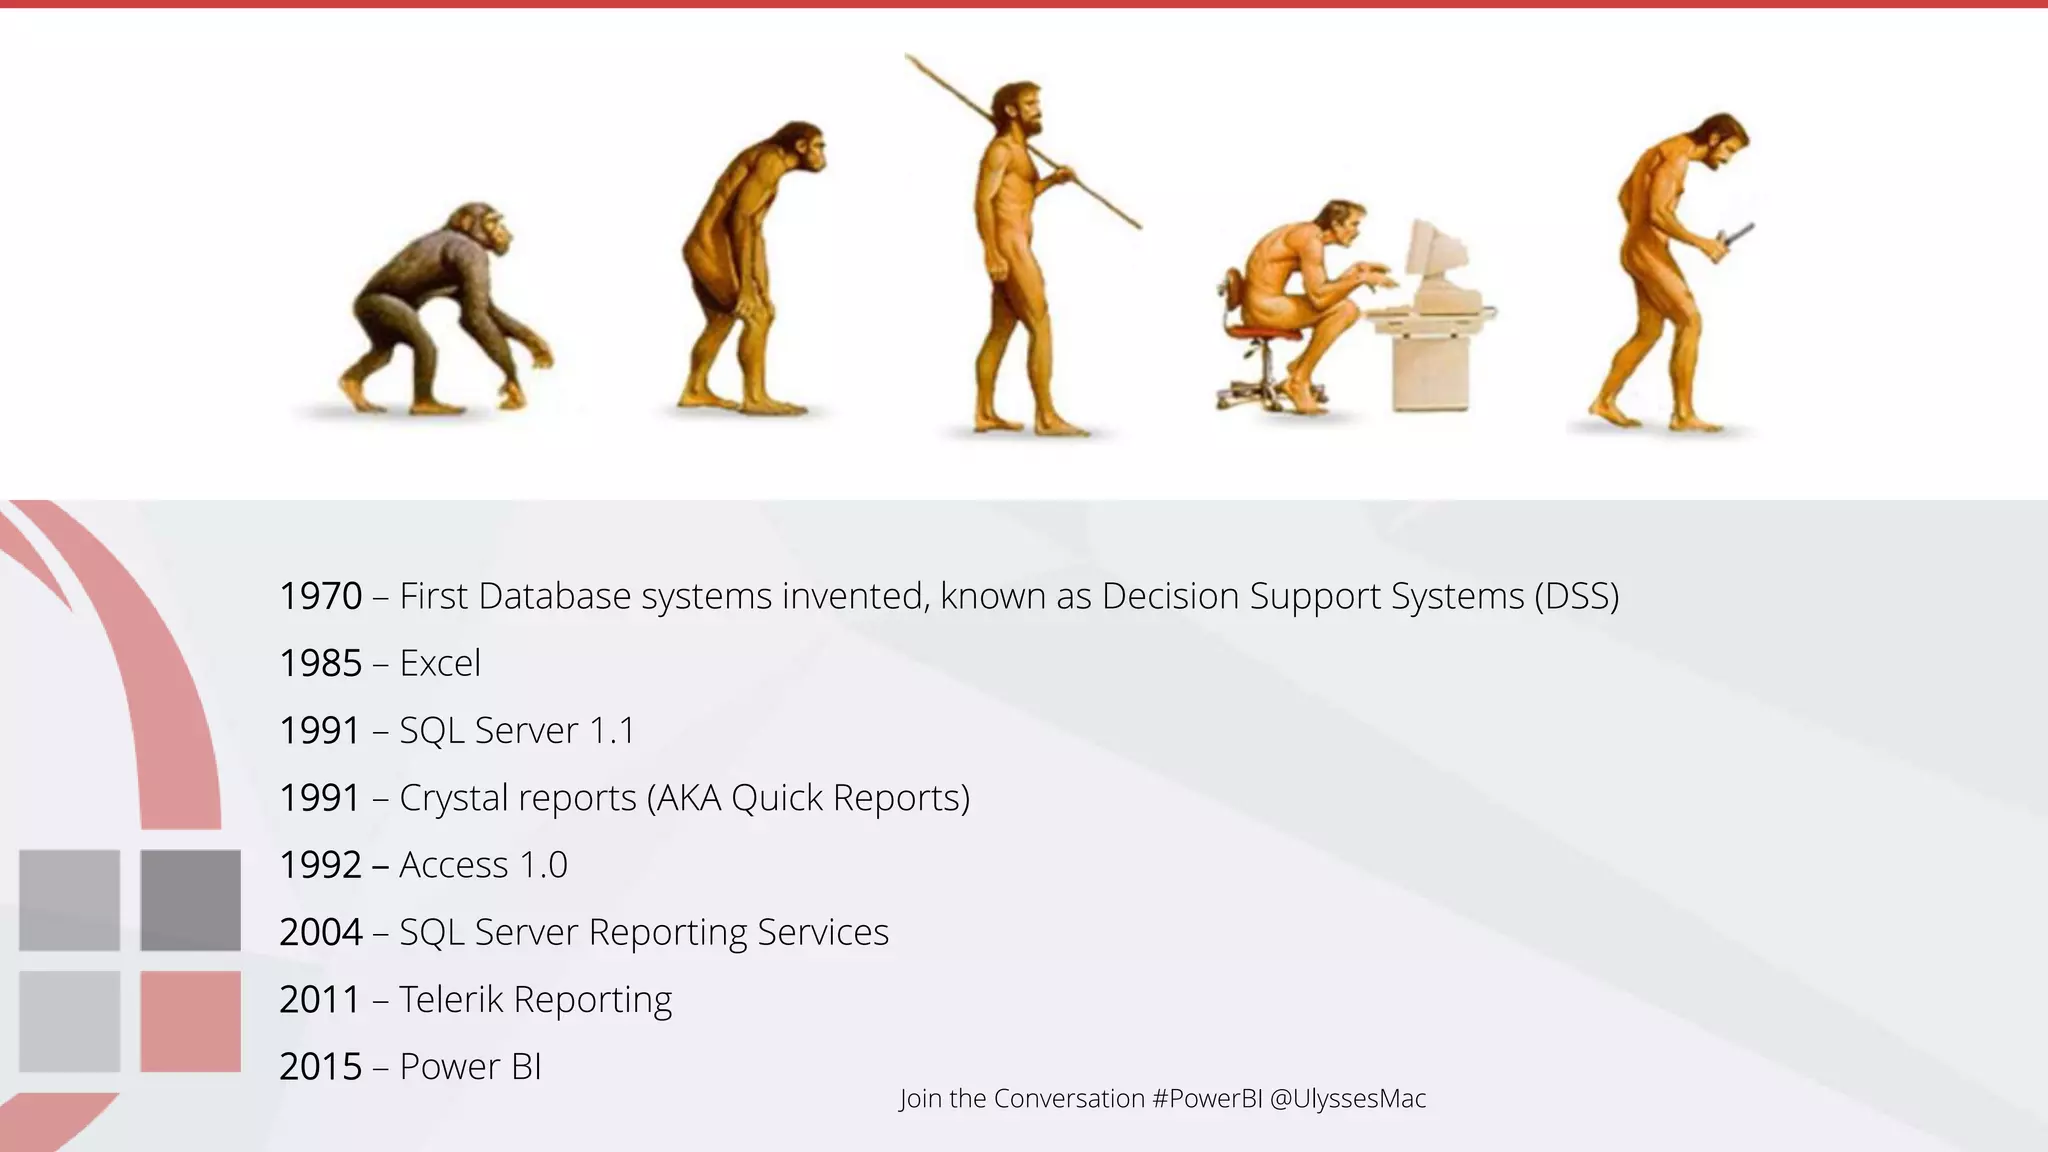
Enterprise Software Development
Join the Conversation #PowerBI @UlyssesMac
Power BI
Finally I can make decisions
based on facts
Join the Conversation #PowerBI @UlyssesMac
.NET User Group - October 2016
SSW General Manager
Ulysses Maclaren
#ulyssesmac
ulysses.maclaren
ulyssesmaclaren
 At SSW for over 10 years
 Obsessive Scrum Master
 Teaches Salsa and won a World Latin Dance Cup in
2014
Join the Conversation #PowerBI @UlyssesMac
Disclaimer:
I am not a developer
Making a New Report from Scratch
Power BI to the Rescue
History
The Age of Traditional Reporting
Table of
Contents
Tips
Summary
1970 – First Database systems invented, known as Decision Support Systems (DSS)
1985 – Excel
1991 – SQL Server 1.1
1991 – Crystal reports (AKA Quick Reports)
1992 – Access 1.0
2004 – SQL Server Reporting Services
2011 – Telerik Reporting
2015 – Power BI
Join the Conversation #PowerBI @UlyssesMac
Google Trends
Join the Conversation #PowerBI @UlyssesMac
Making a New Report from Scratch
Power BI to the Rescue
History
The Age of Traditional Reporting
Tips
Summary
I have questions:
Who could I book
for upcoming
client work?
Are my salespeople
keeping on top of
their opportunities
How is the
company going
financially?
No problem… I’ll
make you a report
in SQL Reporting
Services 
Reporting Services (old)
Once reports have been developed, I
can get key information quickly
Join the Conversation #PowerBI @UlyssesMac
Reporting Services (old)
Once reports have been developed, I
can get key information quickly
These reports allow me to answer FAQs
Join the Conversation #PowerBI @UlyssesMac
Reporting Services (old)
Once reports have been developed, I
can get key information quickly
These reports allow me to answer FAQs
I can see dashboards, and with
enough work, they can look pretty good
Join the Conversation #PowerBI @UlyssesMac
The Problems
Long report development time
High cost of report development
Delayed answers to key questions
Missed opportunities
I can’t freely ask new questions
This does not breed a culture of curiosity
Join the Conversation #PowerBI @UlyssesMac
The Big Problem
Due to the difficulty in getting quick answers, I was
making decisions based on guesses and war
stories
Join the Conversation #PowerBI @UlyssesMac
Examples:
Should I talk the boss into opening a new office in
another state? – high $$
When should I hire a new guy (or sack)?
What technologies should we be focussing on?
Plus more… like seeing trends on an Ad Hoc basis
Join the Conversation #PowerBI @UlyssesMac
Making a New Report from Scratch
Power BI to the Rescue
History
The Age of Traditional Reporting
Tips
Summary
I can’t show you client reports - Private data
Timesheet data from
Join the Conversation #PowerBI @UlyssesMac
Finance data from
Join the Conversation #PowerBI @UlyssesMac
Sales data from CRM
Join the Conversation #PowerBI @UlyssesMac
Phone call data from Phone call data from
Source Control data from
Here’s some I prepared earlier
My Journey
• A developer setup my 1st dataset
• Started with the browser editor
• Moved to Desktop
• Using Git for source control
• Discovered calculated columns
• Discovered the Custom Visualisations Marketplace
• New Power BI reports are now very fast to spin up
Custom Visualisations Marketplace
Power BI - Pros
Reports can be made by power users
Easy to drill up/down
Can interactively cross filter charts
Easy to merge multiple data sources into one report
Dashboards are mobile friendly (responsive)
Join the Conversation #PowerBI @UlyssesMac
Power BI - Pros
Data gets refreshed on a schedule
Can easily be triggered manually
Can also be set up with direct query
Join the Conversation #PowerBI @UlyssesMac
Power BI - Unexpected benefits
Data cleaned
Business processes improved – new fields added
Join the Conversation #PowerBI @UlyssesMac
Power BI – Cons – our version is at http://bettersoftwaresuggestions.com/category/microsoft/powerbi/
Power BI - Cons
No alignment helper controls for visualisations
Join the Conversation #PowerBI @UlyssesMac
Power BI - Cons
No alignment helper controls for visualisations
No year-month slicer (I had to add a custom
dimension for this)
Join the Conversation #PowerBI @UlyssesMac
Power BI - Cons
No alignment helper controls for visualisations
No year-month slicer (I had to add a custom
dimension for this)
Can’t hide slicer section
Join the Conversation #PowerBI @UlyssesMac
Power BI - Cons
No alignment helper controls for visualisations
No year-month slicer (I had to add a custom
dimension for this)
Can’t hide slicer section
No easy way to specify financial year rather than
annual year
Join the Conversation #PowerBI @UlyssesMac
Power BI - Cons
No alignment helper controls for visualisations
No year-month slicer (I had to add a custom
dimension for this)
Can’t hide slicer section
No easy way to specify financial year rather than
annual year
No source control for collaboration
Join the Conversation #PowerBI @UlyssesMac
Making a New Report from Scratch
Power BI to the Rescue
History
The Age of Traditional Reporting
Tips
Summary
Creation Process
Connect to a data source
Use the modelling tab to
manipulate your data set
Create visualisations on
reports and dashboards
Join the Conversation #PowerBI @UlyssesMac
Warning:
Live Demo
Join the Conversation #PowerBI @UlyssesMac
Summary
Pull in the data you want…
Tables from SQL Server in this
case
Join the Conversation #PowerBI @UlyssesMac
Summary
Click on Edit Queries | Choose
Columns…
To focus on what you care
about
Join the Conversation #PowerBI @UlyssesMac
Summary
Drag and drop fields to create
visualisations
Join the Conversation #PowerBI @UlyssesMac
Summary
Add slicers and/or page filters…
To limit the dataset
Join the Conversation #PowerBI @UlyssesMac
Summary
Advanced: Create measures or
columns if necessary to view
your data in different ways…
Using DAX
Join the Conversation #PowerBI @UlyssesMac
Summary
Choose the visualisation type
that works best
Join the Conversation #PowerBI @UlyssesMac
Summary
Play with formatting (e.g.
changing titles, removing
unnecessary headers, using
Aussie state colours, etc…)
NSW = Blue, QLD = Maroon
Join the Conversation #PowerBI @UlyssesMac
Summary
Publish/share reports
Join the Conversation #PowerBI @UlyssesMac
Making a New Report from Scratch
Power BI to the Rescue
History
The Age of Traditional Reporting
Tips
Summary
Tips
Create measures and new
columns
This will let you see metrics and
slice up your data any way you
want
Calculated Columns and Measures
Calculated columns:
• Stored in the database
• Often used to filter/group data
Measures:
• Computed on aggregates of values
• Computed at query time
• Often used to give a numerical metric
Join the Conversation #PowerBI @UlyssesMac
Learn some basic DAX – even just IF statements – it’s cool and less scary than I thought
Tips
If you can do Excel formulas…
Join the Conversation #PowerBI @UlyssesMac
Tips
Integrate with SQL Server Reporting Services
Join the Conversation #PowerBI @UlyssesMac
Your 1st reports will be from the starting point of “What can I do with the data I have?”
After that, your best reports will have the starting point of “Who am I and what do I want to know?”
Don’t get stuck on using your “favourite visualisation” – use the best one for the situation
Tips
Know when to use
Dashboards vs Reports
Put slicers on the left when possible… the check boxes line up
Tufte Principles: Think of your Data-Ink Ratio
Sort Order (Alphabetical sucks)
Question: Date Sorting
Making a New Report from Scratch
Power BI to the Rescue
History
The Age of Traditional Reporting
Tips
Summary
Remember The Big Problem?
Due to the difficulty in getting quick answers, I was
making decisions based on guesses and war
stories
Join the Conversation #PowerBI @UlyssesMac
Should I talk the boss into opening a new office in another state? – high $$
When should we hire a new guy (or sack)?
What technologies should we be
focussing on?
Plus more, like Ad Hoc seeing
trends
Thank you!
https://www.ssw.com.au/ssw/Consulting/Power-BI.aspx
https://rules.ssw.com.au/rules-to-better-power-bi
uly@ssw.com.au
www.ssw.com.au
Sydney | Melbourne | Brisbane
Price of Pizza 
Please fill out this short
feedback survey.
Note: Search your app
store for “QR”…
or http://svy.mk/2dXvswt

Power BI - Finally I can make decisions based on facts

  • 1.
    Enterprise Software Development Jointhe Conversation #PowerBI @UlyssesMac
  • 2.
    Power BI Finally Ican make decisions based on facts Join the Conversation #PowerBI @UlyssesMac .NET User Group - October 2016
  • 3.
    SSW General Manager UlyssesMaclaren #ulyssesmac ulysses.maclaren ulyssesmaclaren  At SSW for over 10 years  Obsessive Scrum Master  Teaches Salsa and won a World Latin Dance Cup in 2014 Join the Conversation #PowerBI @UlyssesMac
  • 4.
  • 5.
    Making a NewReport from Scratch Power BI to the Rescue History The Age of Traditional Reporting Table of Contents Tips Summary
  • 6.
    1970 – FirstDatabase systems invented, known as Decision Support Systems (DSS) 1985 – Excel 1991 – SQL Server 1.1 1991 – Crystal reports (AKA Quick Reports) 1992 – Access 1.0 2004 – SQL Server Reporting Services 2011 – Telerik Reporting 2015 – Power BI Join the Conversation #PowerBI @UlyssesMac
  • 7.
  • 8.
    Join the Conversation#PowerBI @UlyssesMac
  • 9.
    Making a NewReport from Scratch Power BI to the Rescue History The Age of Traditional Reporting Tips Summary
  • 10.
    I have questions: Whocould I book for upcoming client work? Are my salespeople keeping on top of their opportunities How is the company going financially? No problem… I’ll make you a report in SQL Reporting Services 
  • 11.
    Reporting Services (old) Oncereports have been developed, I can get key information quickly Join the Conversation #PowerBI @UlyssesMac
  • 12.
    Reporting Services (old) Oncereports have been developed, I can get key information quickly These reports allow me to answer FAQs Join the Conversation #PowerBI @UlyssesMac
  • 13.
    Reporting Services (old) Oncereports have been developed, I can get key information quickly These reports allow me to answer FAQs I can see dashboards, and with enough work, they can look pretty good Join the Conversation #PowerBI @UlyssesMac
  • 14.
    The Problems Long reportdevelopment time High cost of report development Delayed answers to key questions Missed opportunities I can’t freely ask new questions This does not breed a culture of curiosity Join the Conversation #PowerBI @UlyssesMac
  • 15.
    The Big Problem Dueto the difficulty in getting quick answers, I was making decisions based on guesses and war stories Join the Conversation #PowerBI @UlyssesMac
  • 16.
    Examples: Should I talkthe boss into opening a new office in another state? – high $$ When should I hire a new guy (or sack)? What technologies should we be focussing on? Plus more… like seeing trends on an Ad Hoc basis Join the Conversation #PowerBI @UlyssesMac
  • 17.
    Making a NewReport from Scratch Power BI to the Rescue History The Age of Traditional Reporting Tips Summary
  • 18.
    I can’t showyou client reports - Private data
  • 19.
    Timesheet data from Jointhe Conversation #PowerBI @UlyssesMac
  • 20.
    Finance data from Jointhe Conversation #PowerBI @UlyssesMac
  • 21.
    Sales data fromCRM Join the Conversation #PowerBI @UlyssesMac
  • 22.
    Phone call datafrom Phone call data from
  • 23.
  • 24.
    Here’s some Iprepared earlier
  • 27.
    My Journey • Adeveloper setup my 1st dataset • Started with the browser editor • Moved to Desktop • Using Git for source control • Discovered calculated columns • Discovered the Custom Visualisations Marketplace • New Power BI reports are now very fast to spin up
  • 28.
  • 29.
    Power BI -Pros Reports can be made by power users Easy to drill up/down Can interactively cross filter charts Easy to merge multiple data sources into one report Dashboards are mobile friendly (responsive) Join the Conversation #PowerBI @UlyssesMac
  • 30.
    Power BI -Pros Data gets refreshed on a schedule Can easily be triggered manually Can also be set up with direct query Join the Conversation #PowerBI @UlyssesMac
  • 31.
    Power BI -Unexpected benefits Data cleaned Business processes improved – new fields added Join the Conversation #PowerBI @UlyssesMac
  • 32.
    Power BI –Cons – our version is at http://bettersoftwaresuggestions.com/category/microsoft/powerbi/
  • 33.
    Power BI -Cons No alignment helper controls for visualisations Join the Conversation #PowerBI @UlyssesMac
  • 34.
    Power BI -Cons No alignment helper controls for visualisations No year-month slicer (I had to add a custom dimension for this) Join the Conversation #PowerBI @UlyssesMac
  • 35.
    Power BI -Cons No alignment helper controls for visualisations No year-month slicer (I had to add a custom dimension for this) Can’t hide slicer section Join the Conversation #PowerBI @UlyssesMac
  • 36.
    Power BI -Cons No alignment helper controls for visualisations No year-month slicer (I had to add a custom dimension for this) Can’t hide slicer section No easy way to specify financial year rather than annual year Join the Conversation #PowerBI @UlyssesMac
  • 37.
    Power BI -Cons No alignment helper controls for visualisations No year-month slicer (I had to add a custom dimension for this) Can’t hide slicer section No easy way to specify financial year rather than annual year No source control for collaboration Join the Conversation #PowerBI @UlyssesMac
  • 38.
    Making a NewReport from Scratch Power BI to the Rescue History The Age of Traditional Reporting Tips Summary
  • 39.
    Creation Process Connect toa data source Use the modelling tab to manipulate your data set Create visualisations on reports and dashboards Join the Conversation #PowerBI @UlyssesMac
  • 40.
    Join the Conversation#PowerBI @UlyssesMac
  • 46.
  • 47.
    Join the Conversation#PowerBI @UlyssesMac
  • 48.
    Summary Pull in thedata you want… Tables from SQL Server in this case Join the Conversation #PowerBI @UlyssesMac
  • 49.
    Summary Click on EditQueries | Choose Columns… To focus on what you care about Join the Conversation #PowerBI @UlyssesMac
  • 50.
    Summary Drag and dropfields to create visualisations Join the Conversation #PowerBI @UlyssesMac
  • 51.
    Summary Add slicers and/orpage filters… To limit the dataset Join the Conversation #PowerBI @UlyssesMac
  • 52.
    Summary Advanced: Create measuresor columns if necessary to view your data in different ways… Using DAX Join the Conversation #PowerBI @UlyssesMac
  • 53.
    Summary Choose the visualisationtype that works best Join the Conversation #PowerBI @UlyssesMac
  • 54.
    Summary Play with formatting(e.g. changing titles, removing unnecessary headers, using Aussie state colours, etc…) NSW = Blue, QLD = Maroon Join the Conversation #PowerBI @UlyssesMac
  • 55.
    Summary Publish/share reports Join theConversation #PowerBI @UlyssesMac
  • 56.
    Making a NewReport from Scratch Power BI to the Rescue History The Age of Traditional Reporting Tips Summary
  • 57.
    Tips Create measures andnew columns This will let you see metrics and slice up your data any way you want
  • 58.
    Calculated Columns andMeasures Calculated columns: • Stored in the database • Often used to filter/group data Measures: • Computed on aggregates of values • Computed at query time • Often used to give a numerical metric Join the Conversation #PowerBI @UlyssesMac
  • 59.
    Learn some basicDAX – even just IF statements – it’s cool and less scary than I thought
  • 60.
    Tips If you cando Excel formulas… Join the Conversation #PowerBI @UlyssesMac
  • 61.
    Tips Integrate with SQLServer Reporting Services Join the Conversation #PowerBI @UlyssesMac
  • 62.
    Your 1st reportswill be from the starting point of “What can I do with the data I have?”
  • 63.
    After that, yourbest reports will have the starting point of “Who am I and what do I want to know?”
  • 64.
    Don’t get stuckon using your “favourite visualisation” – use the best one for the situation
  • 65.
    Tips Know when touse Dashboards vs Reports
  • 66.
    Put slicers onthe left when possible… the check boxes line up
  • 67.
    Tufte Principles: Thinkof your Data-Ink Ratio
  • 68.
  • 69.
  • 70.
    Making a NewReport from Scratch Power BI to the Rescue History The Age of Traditional Reporting Tips Summary
  • 71.
    Remember The BigProblem? Due to the difficulty in getting quick answers, I was making decisions based on guesses and war stories Join the Conversation #PowerBI @UlyssesMac
  • 72.
    Should I talkthe boss into opening a new office in another state? – high $$
  • 73.
    When should wehire a new guy (or sack)?
  • 74.
    What technologies shouldwe be focussing on?
  • 75.
    Plus more, likeAd Hoc seeing trends
  • 76.
  • 77.
    Price of Pizza Please fill out this short feedback survey. Note: Search your app store for “QR”… or http://svy.mk/2dXvswt

Editor's Notes

  • #5 I have a degree in Electrical Engineering so I’m fairly technically minded, but I’m not a coder… I’m a business person
  • #9 I saw Adam’s talk on SSW TV and got inspired
  • #12 Took ages to get this report made. Was a struggle to get it approved. I now use it every day
  • #13 My main experience has been with Reporting Services
  • #14 My main experience has been with Reporting Services
  • #15 give an example. Such as "I have a client meeting tomorrow for CRM in the healthcare industry. I want a report to see previous relevant clients. If it gets to me after the meeting, then it is a missed opportunity to use the value“
  • #19 Done Power BI work for - Queensland Teachers Union, Harrier National
  • #23 Mobile needs skype for business app to be tracked. But I use Siri
  • #25 I grew up in England so here’s a quote from Blue Peter
  • #28 Financial overviews from MYOB
  • #29 Diagnose good/bad months
  • #30 See who owes us money
  • #31 Compare this April to the previous ones
  • #34 See new opprtunities coming in per month
  • #35 Used in sales meetings
  • #36 Catch neglected opportunities
  • #37 Manage sales people
  • #38 Measure sales success
  • #39 Where do we get our leads from?
  • #51 Many ideas on UserVoice
  • #55 Not that important for me, but the accountants want data shown this way
  • #66 Let’s recap a summary of what we just did
  • #78 Data Analysis Expressions
  • #79 It’s not much of a stretch to learn DAX
  • #81 good overviews
  • #82 actionable insights
  • #84 Dashboards for overview, click through to Reports for drill down or cross filtering
  • #85 Should be able to hide these
  • #88 Can’t actually change this
  • #93 Mention FireBootCamp for Angular 2
  • #96 Paper if you prefer