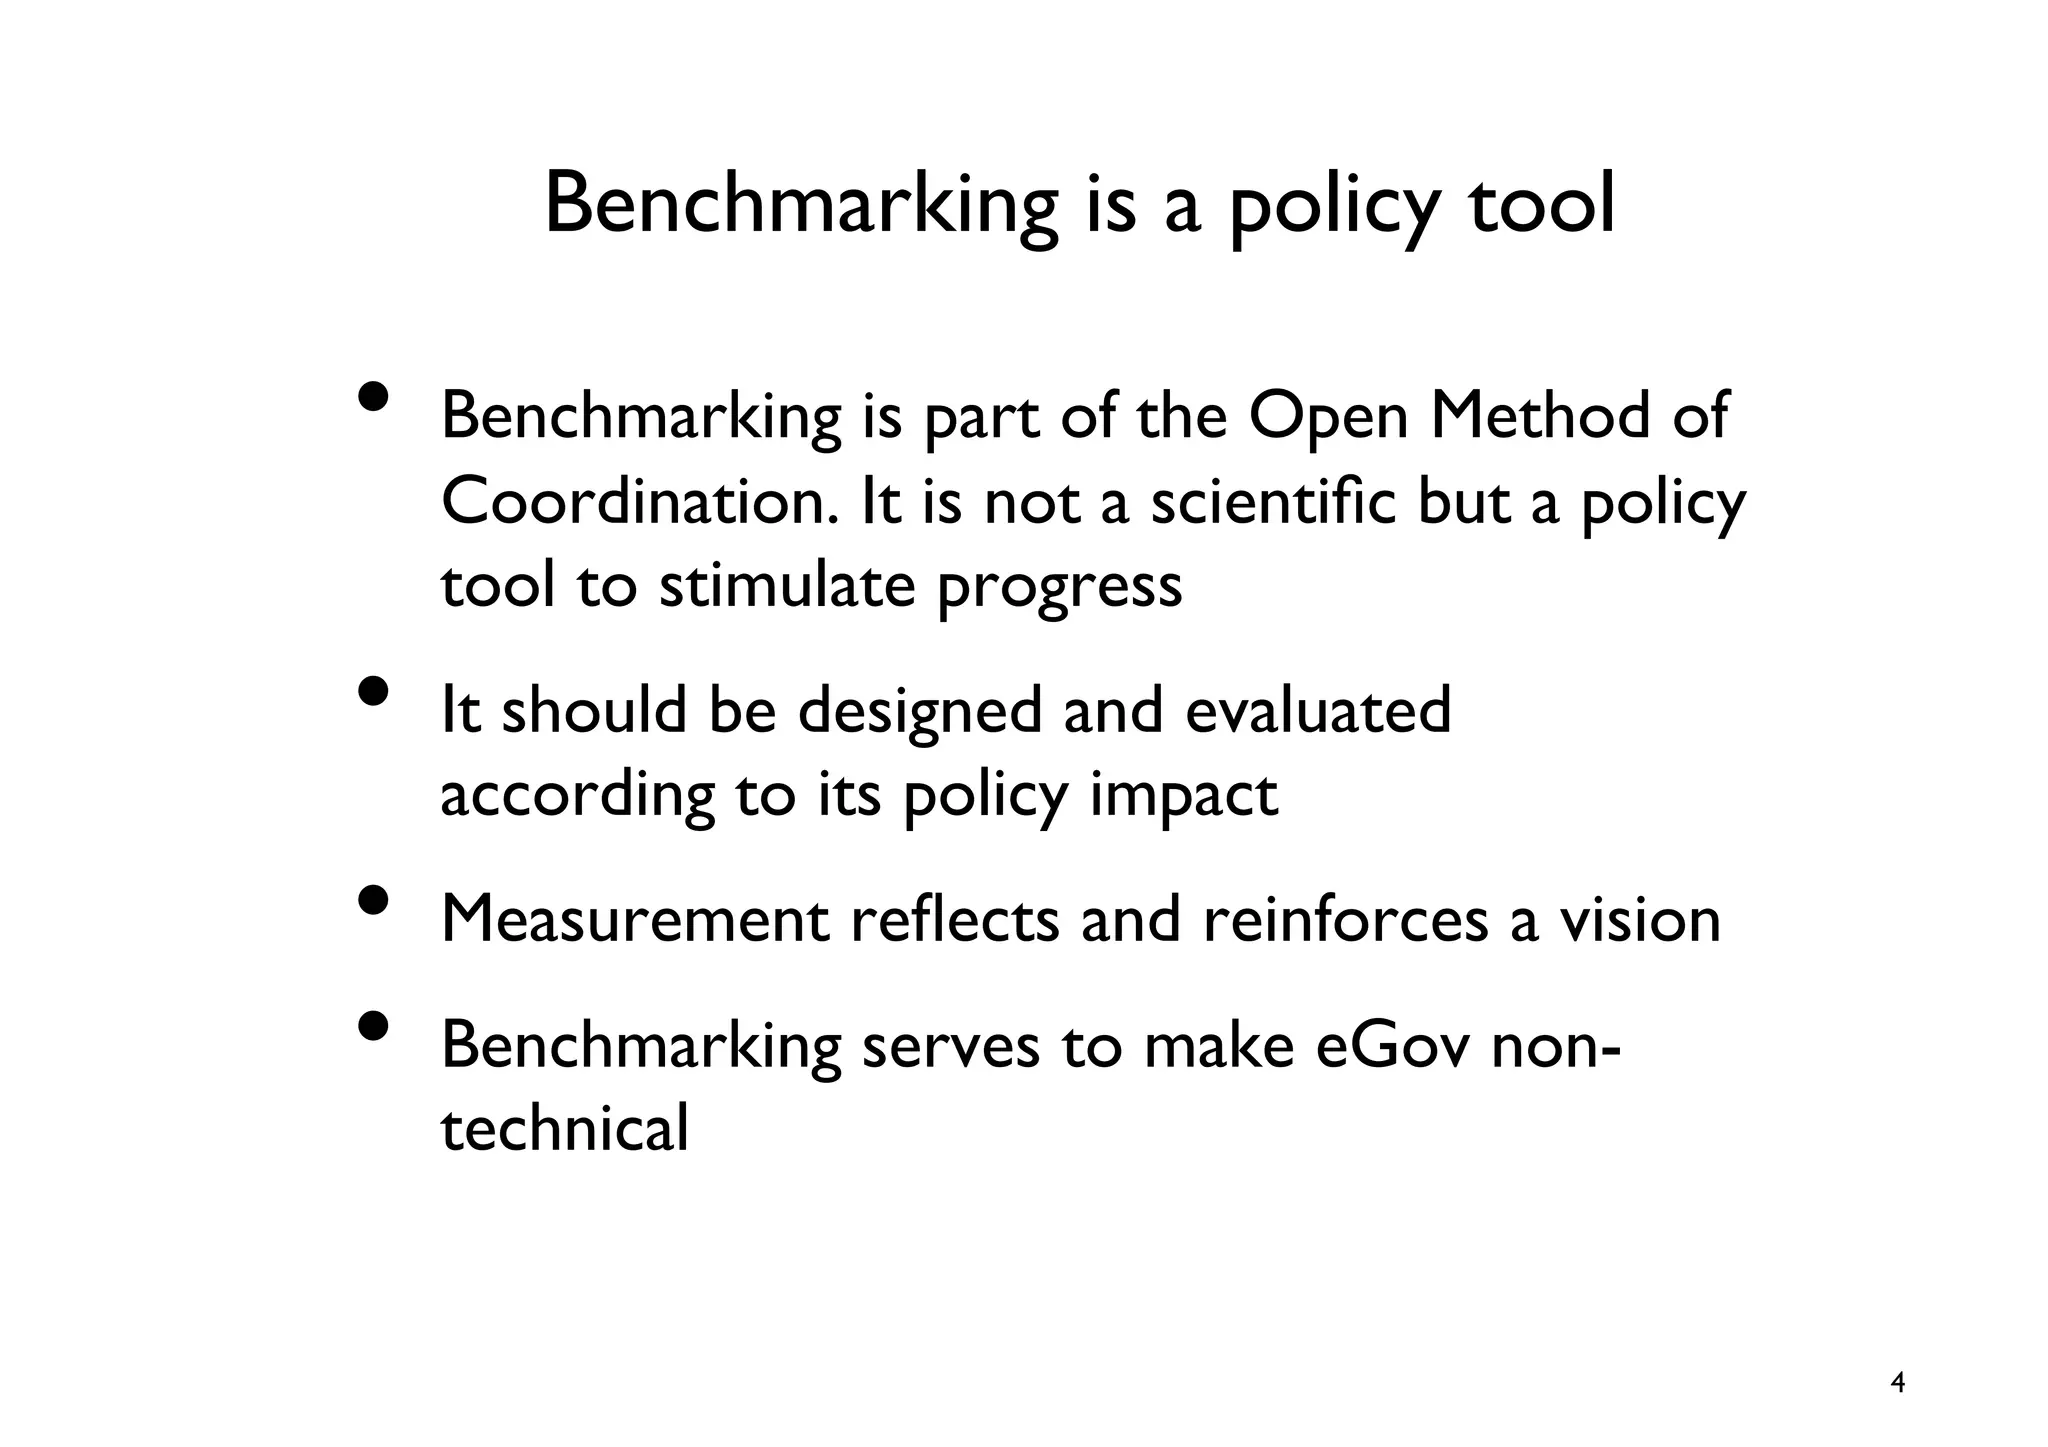
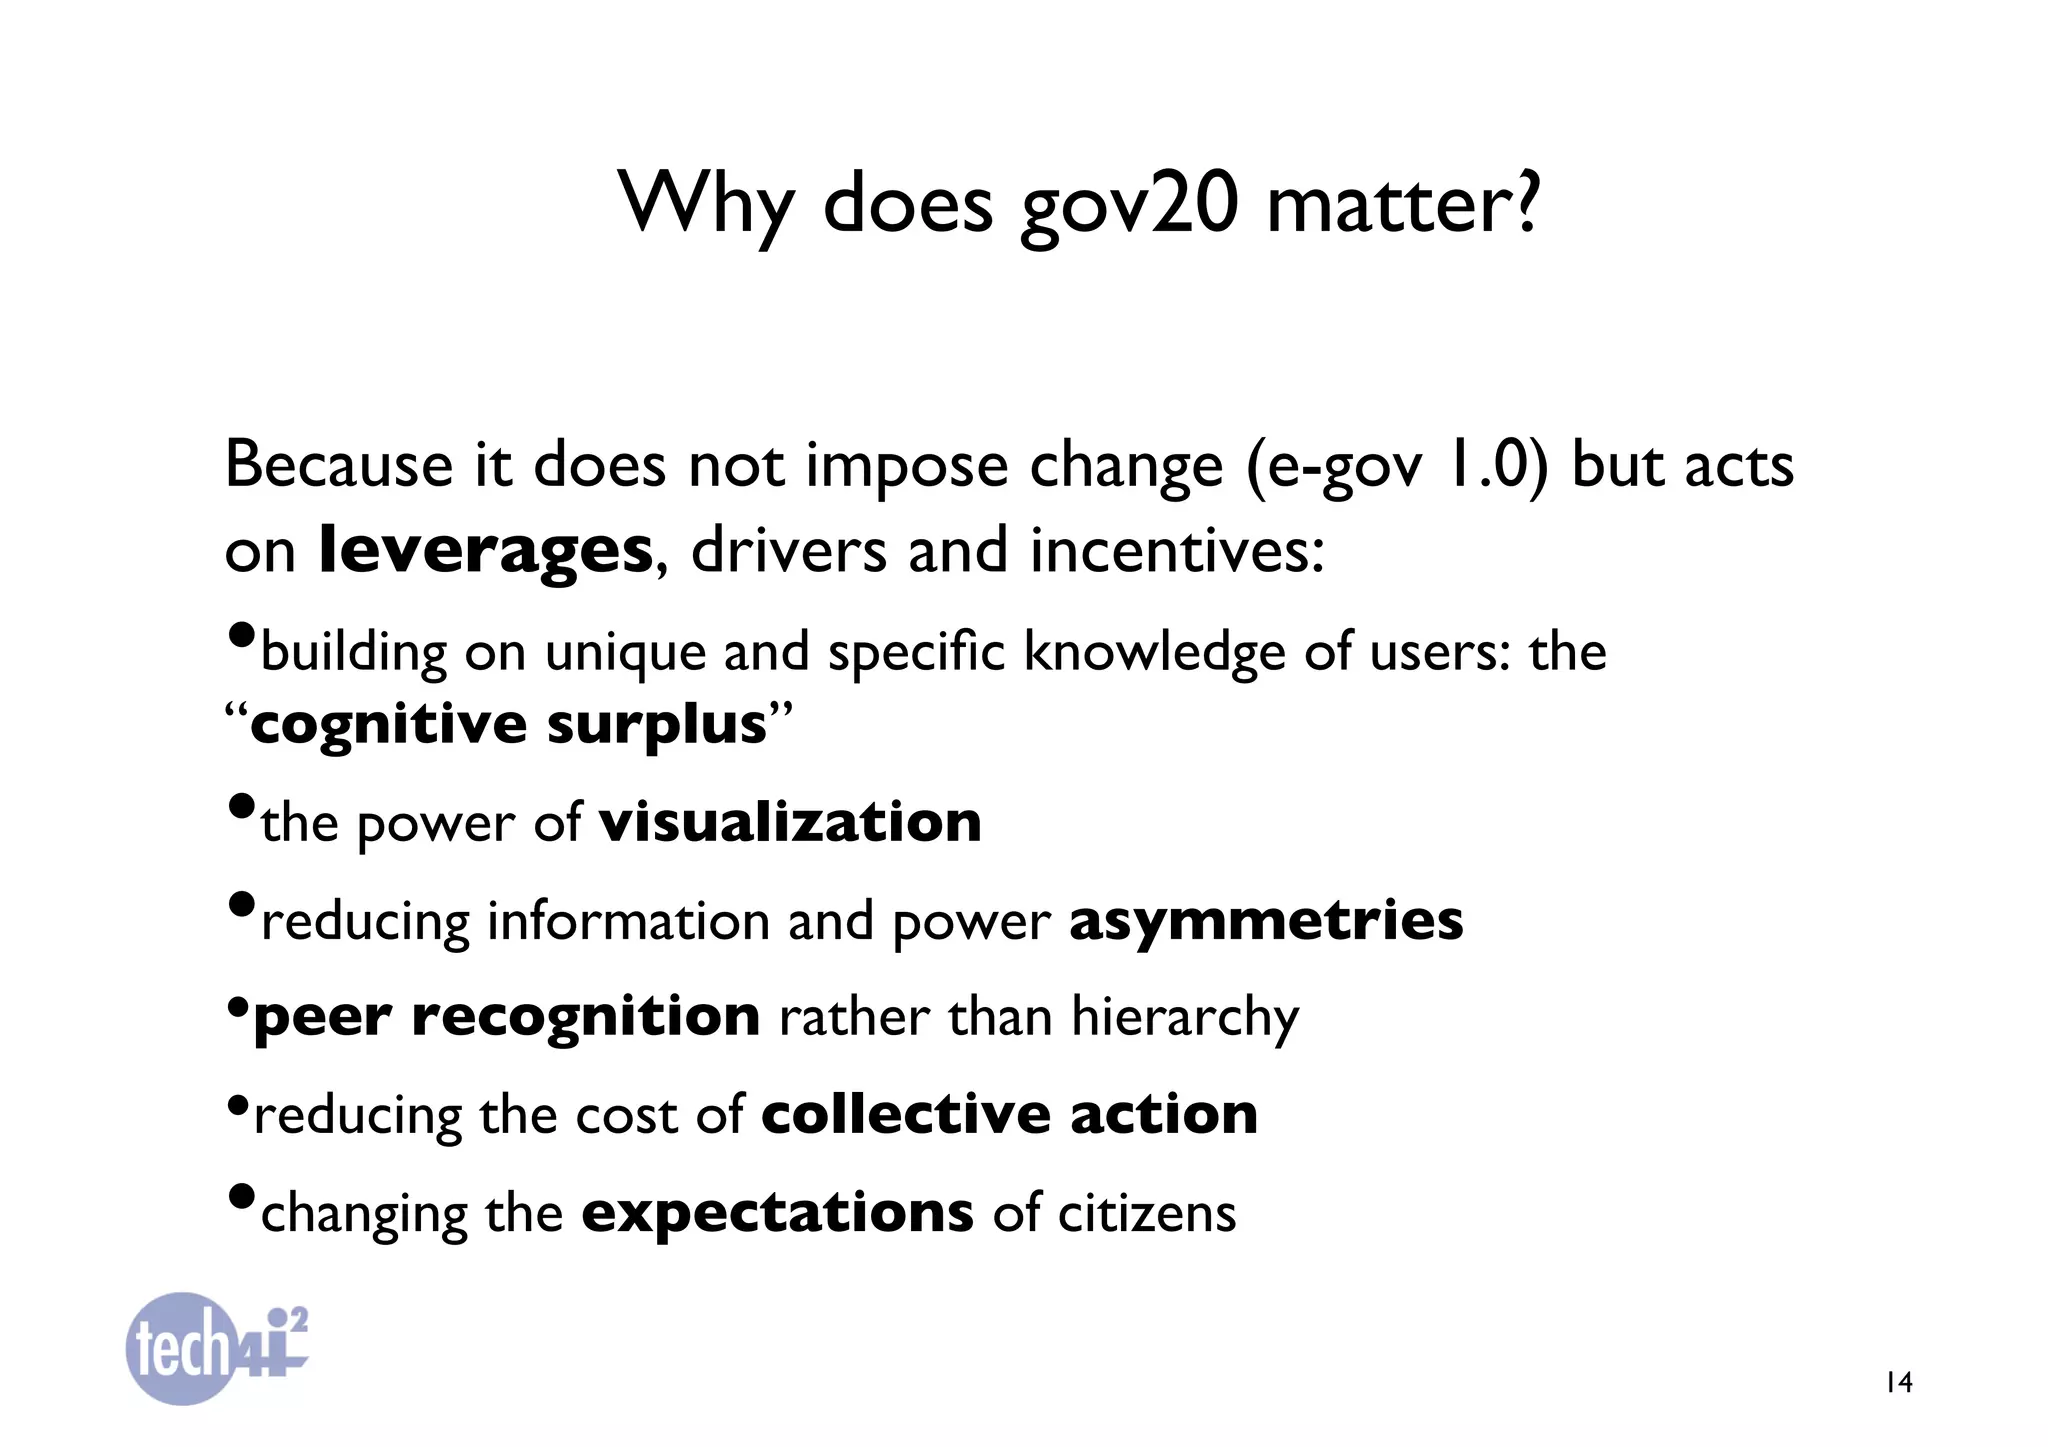
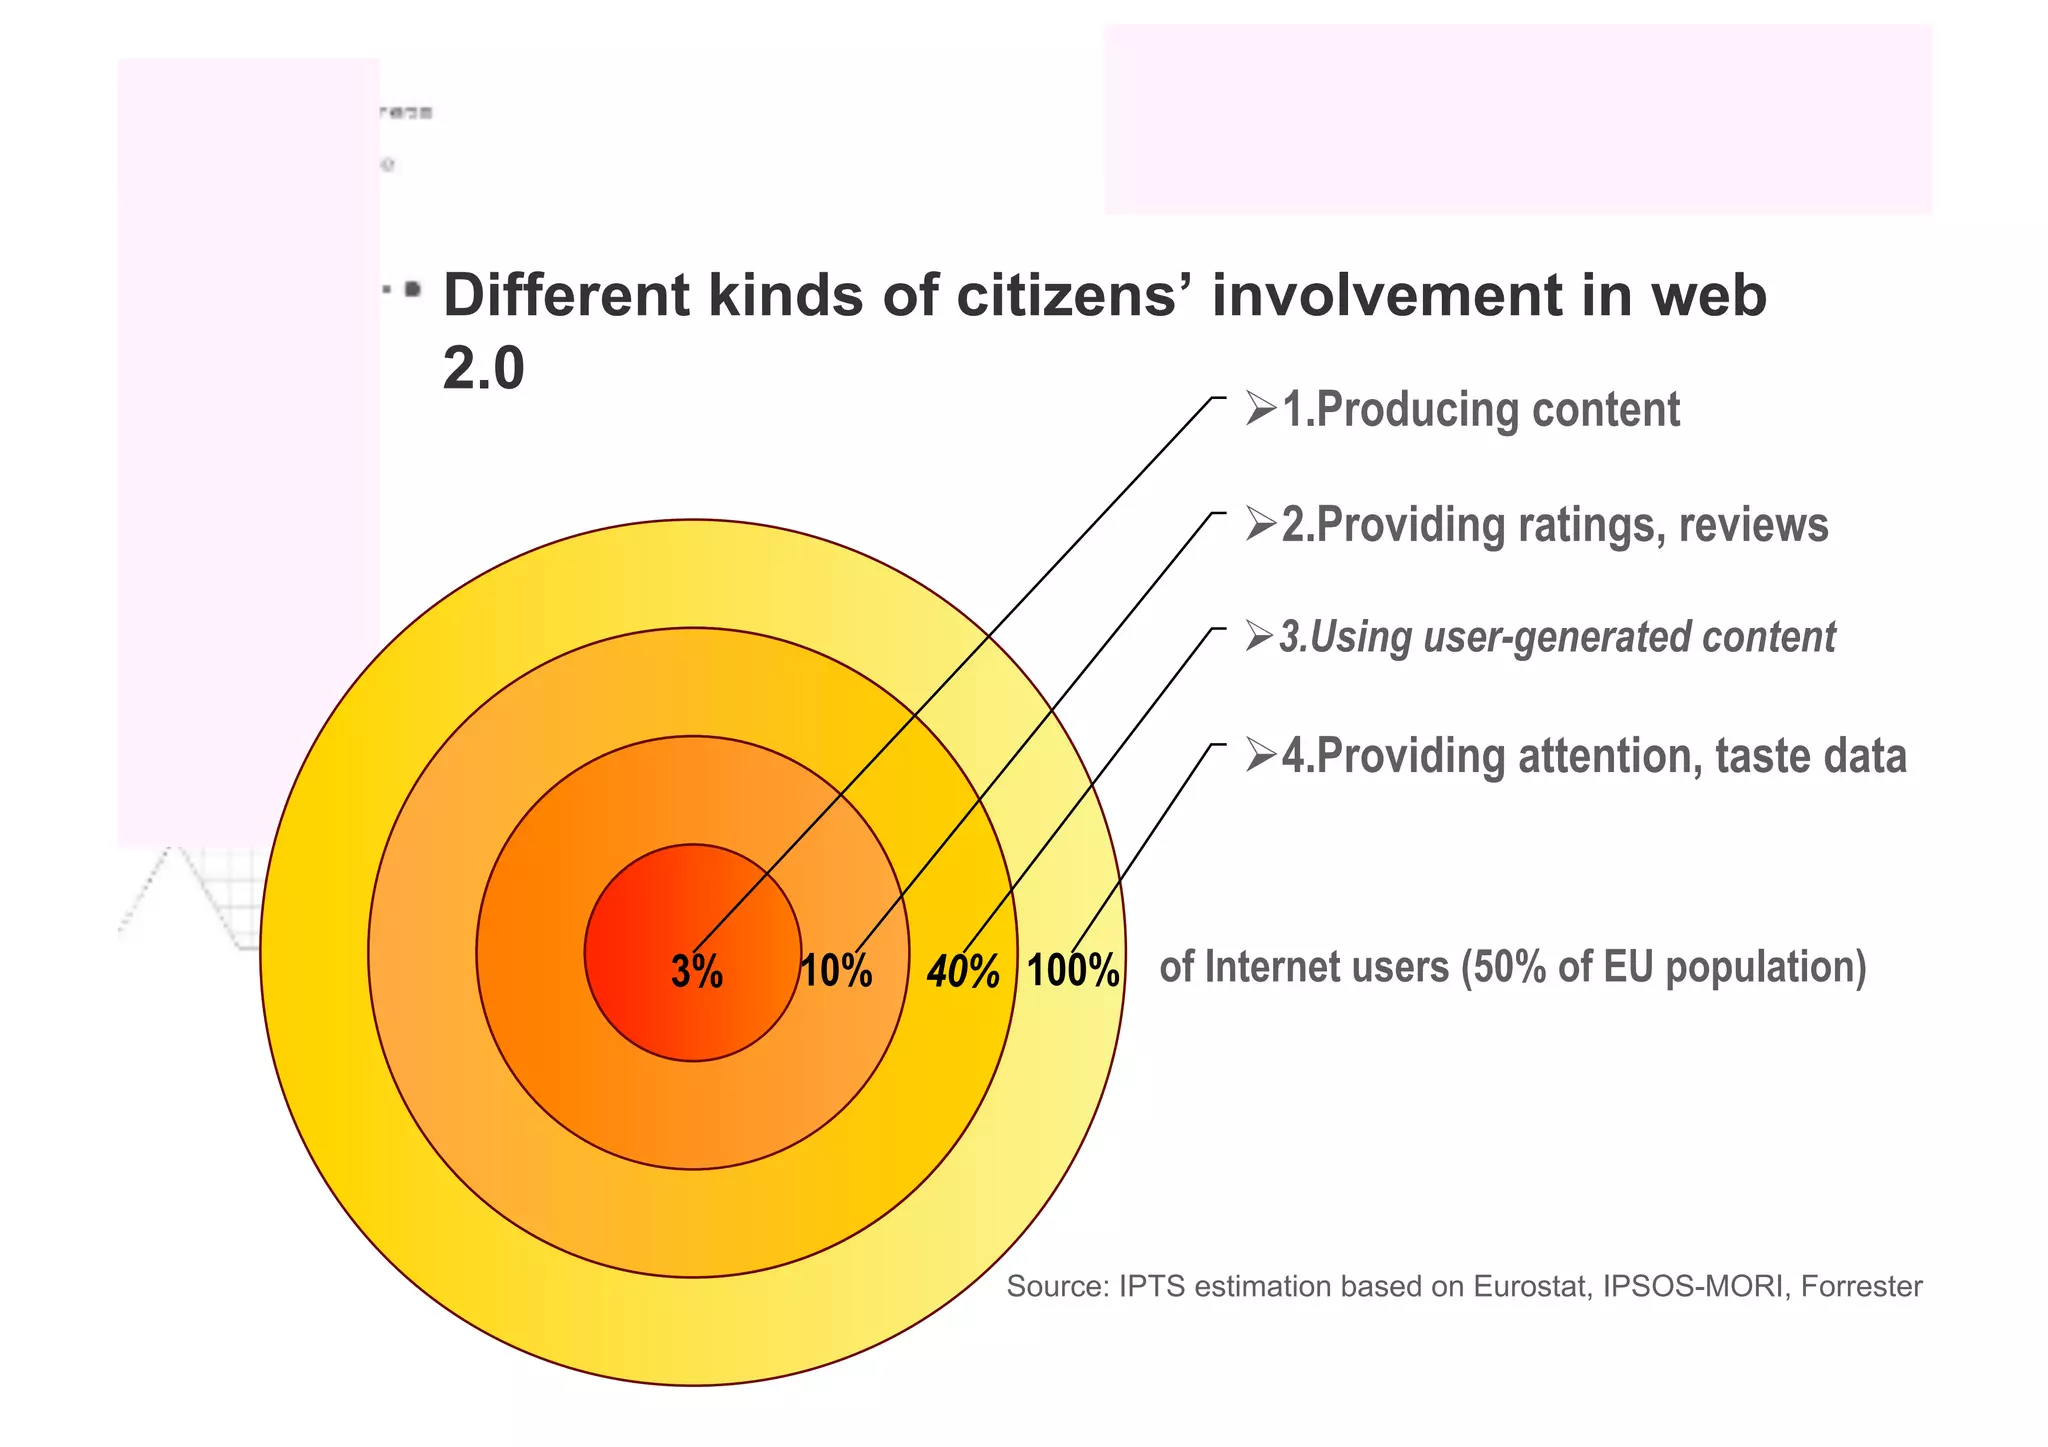
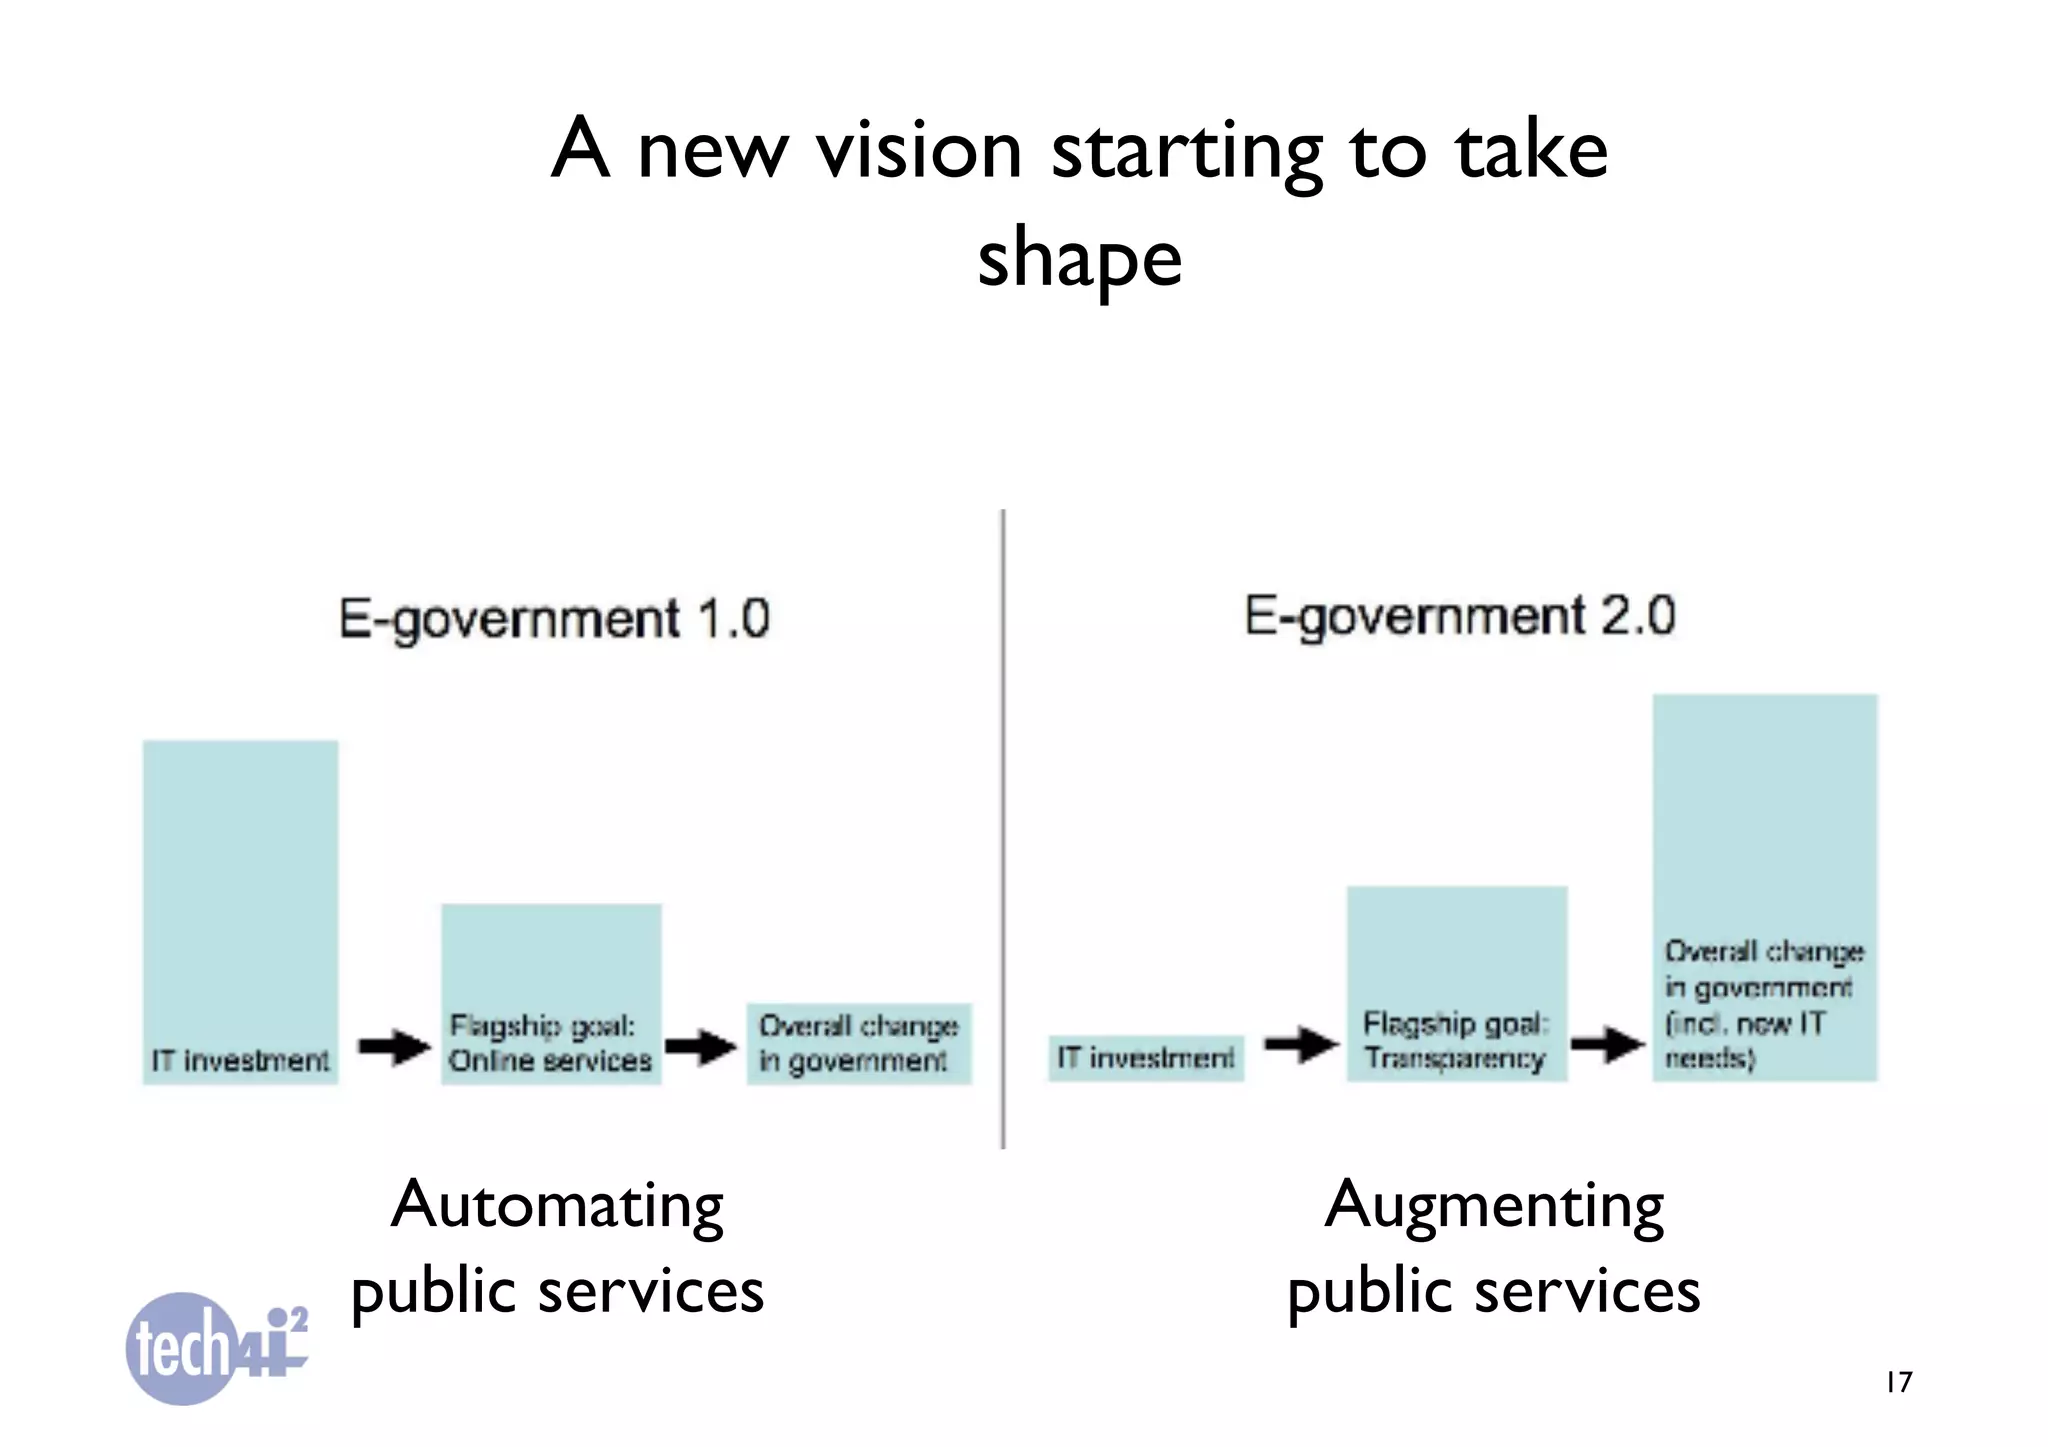
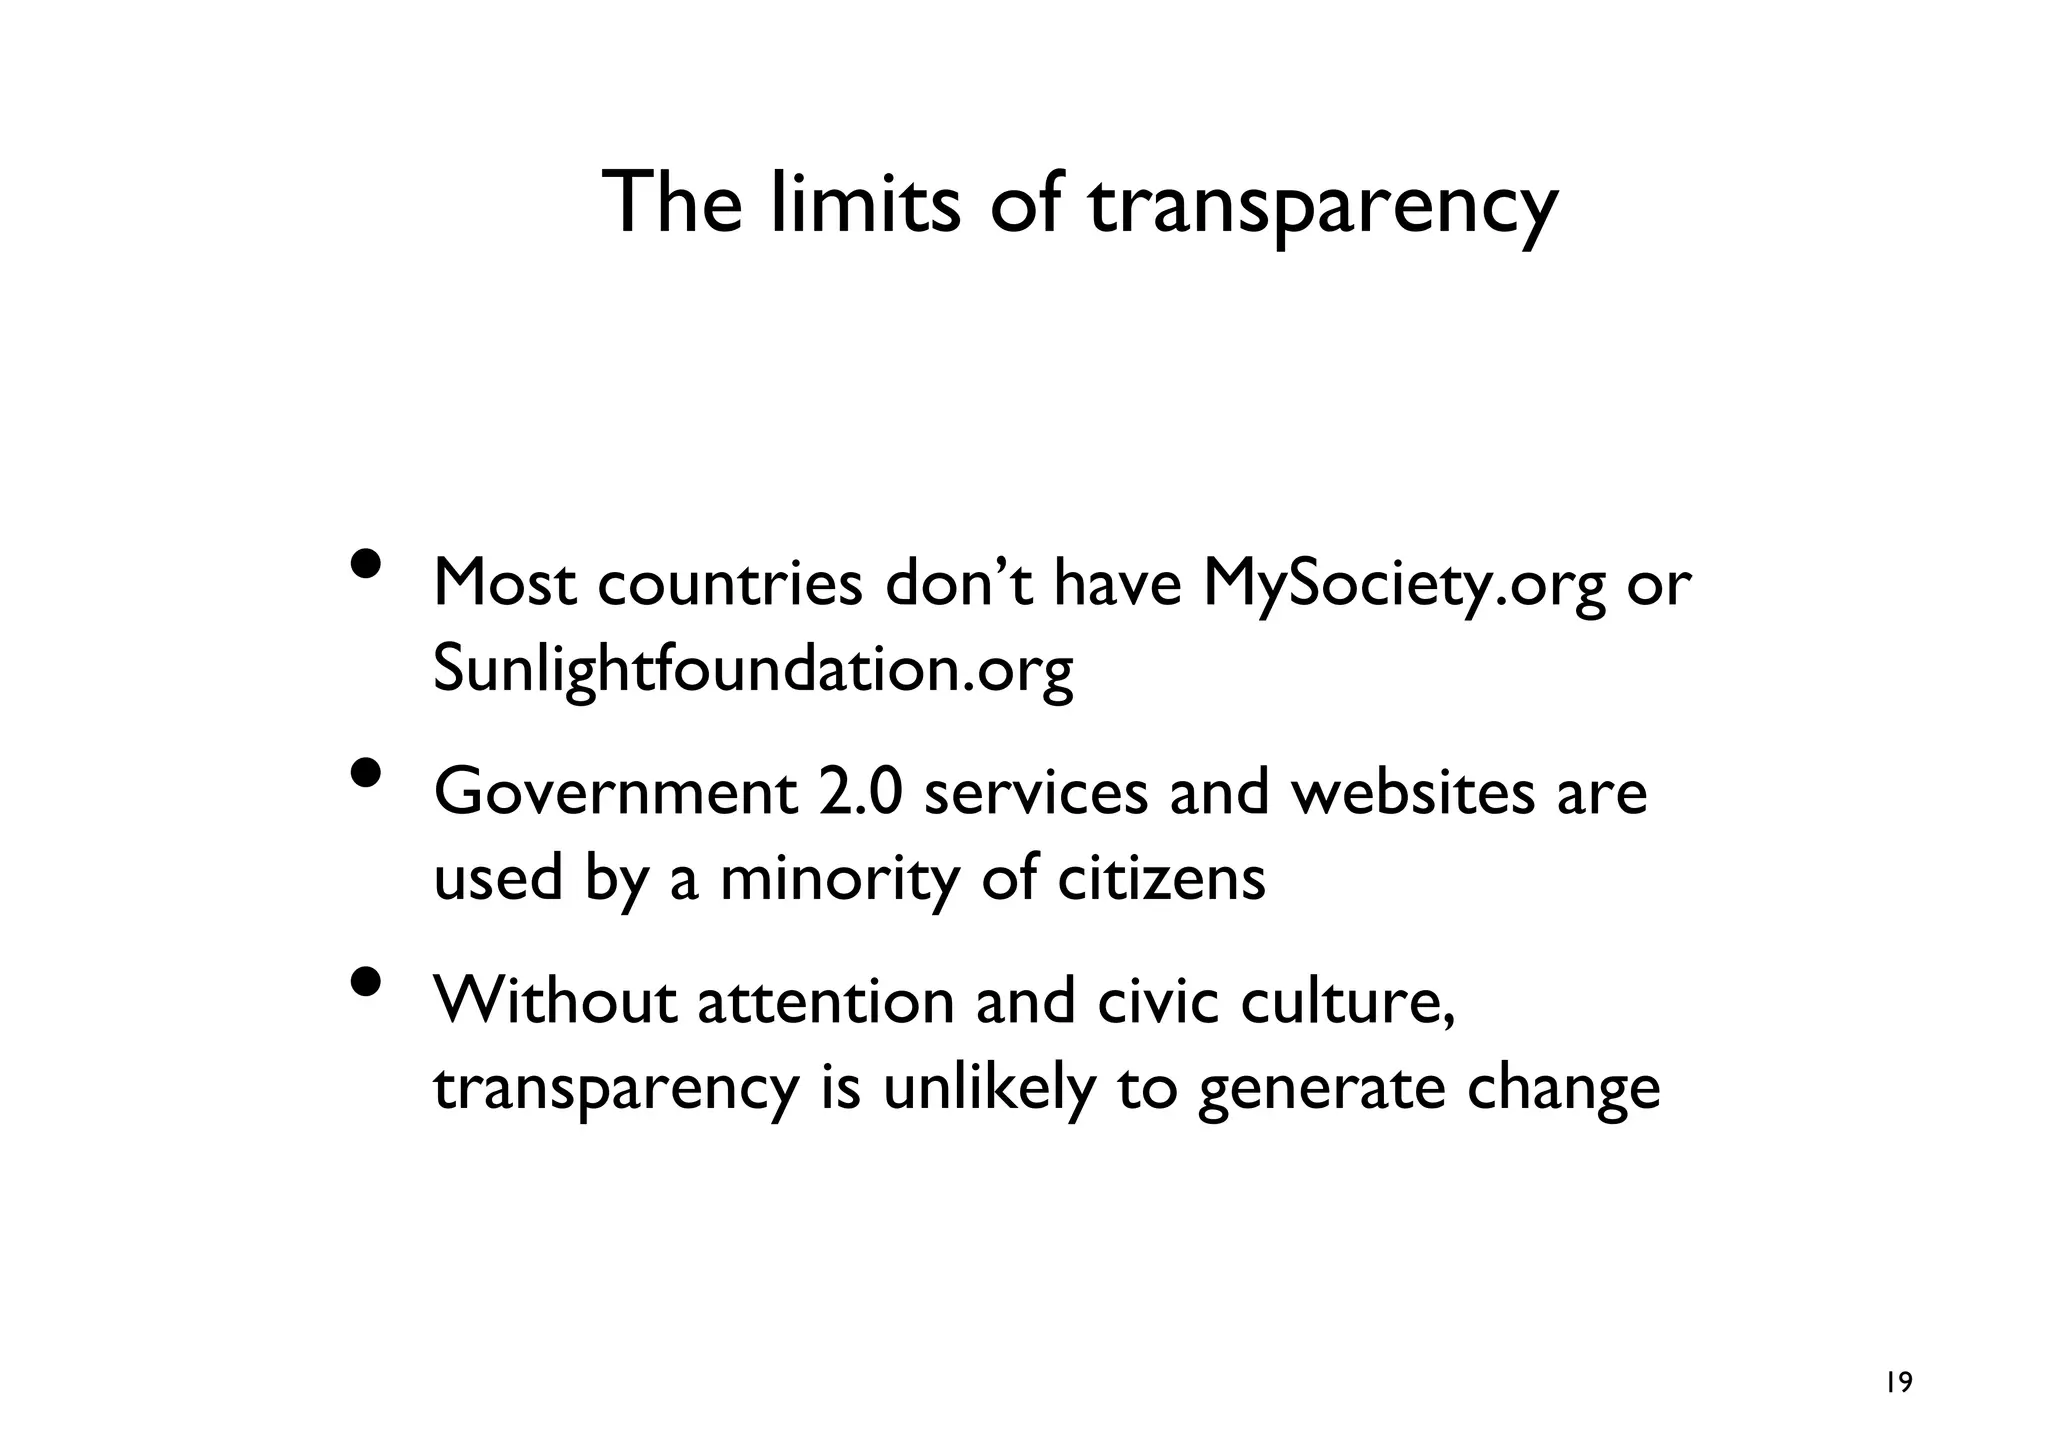
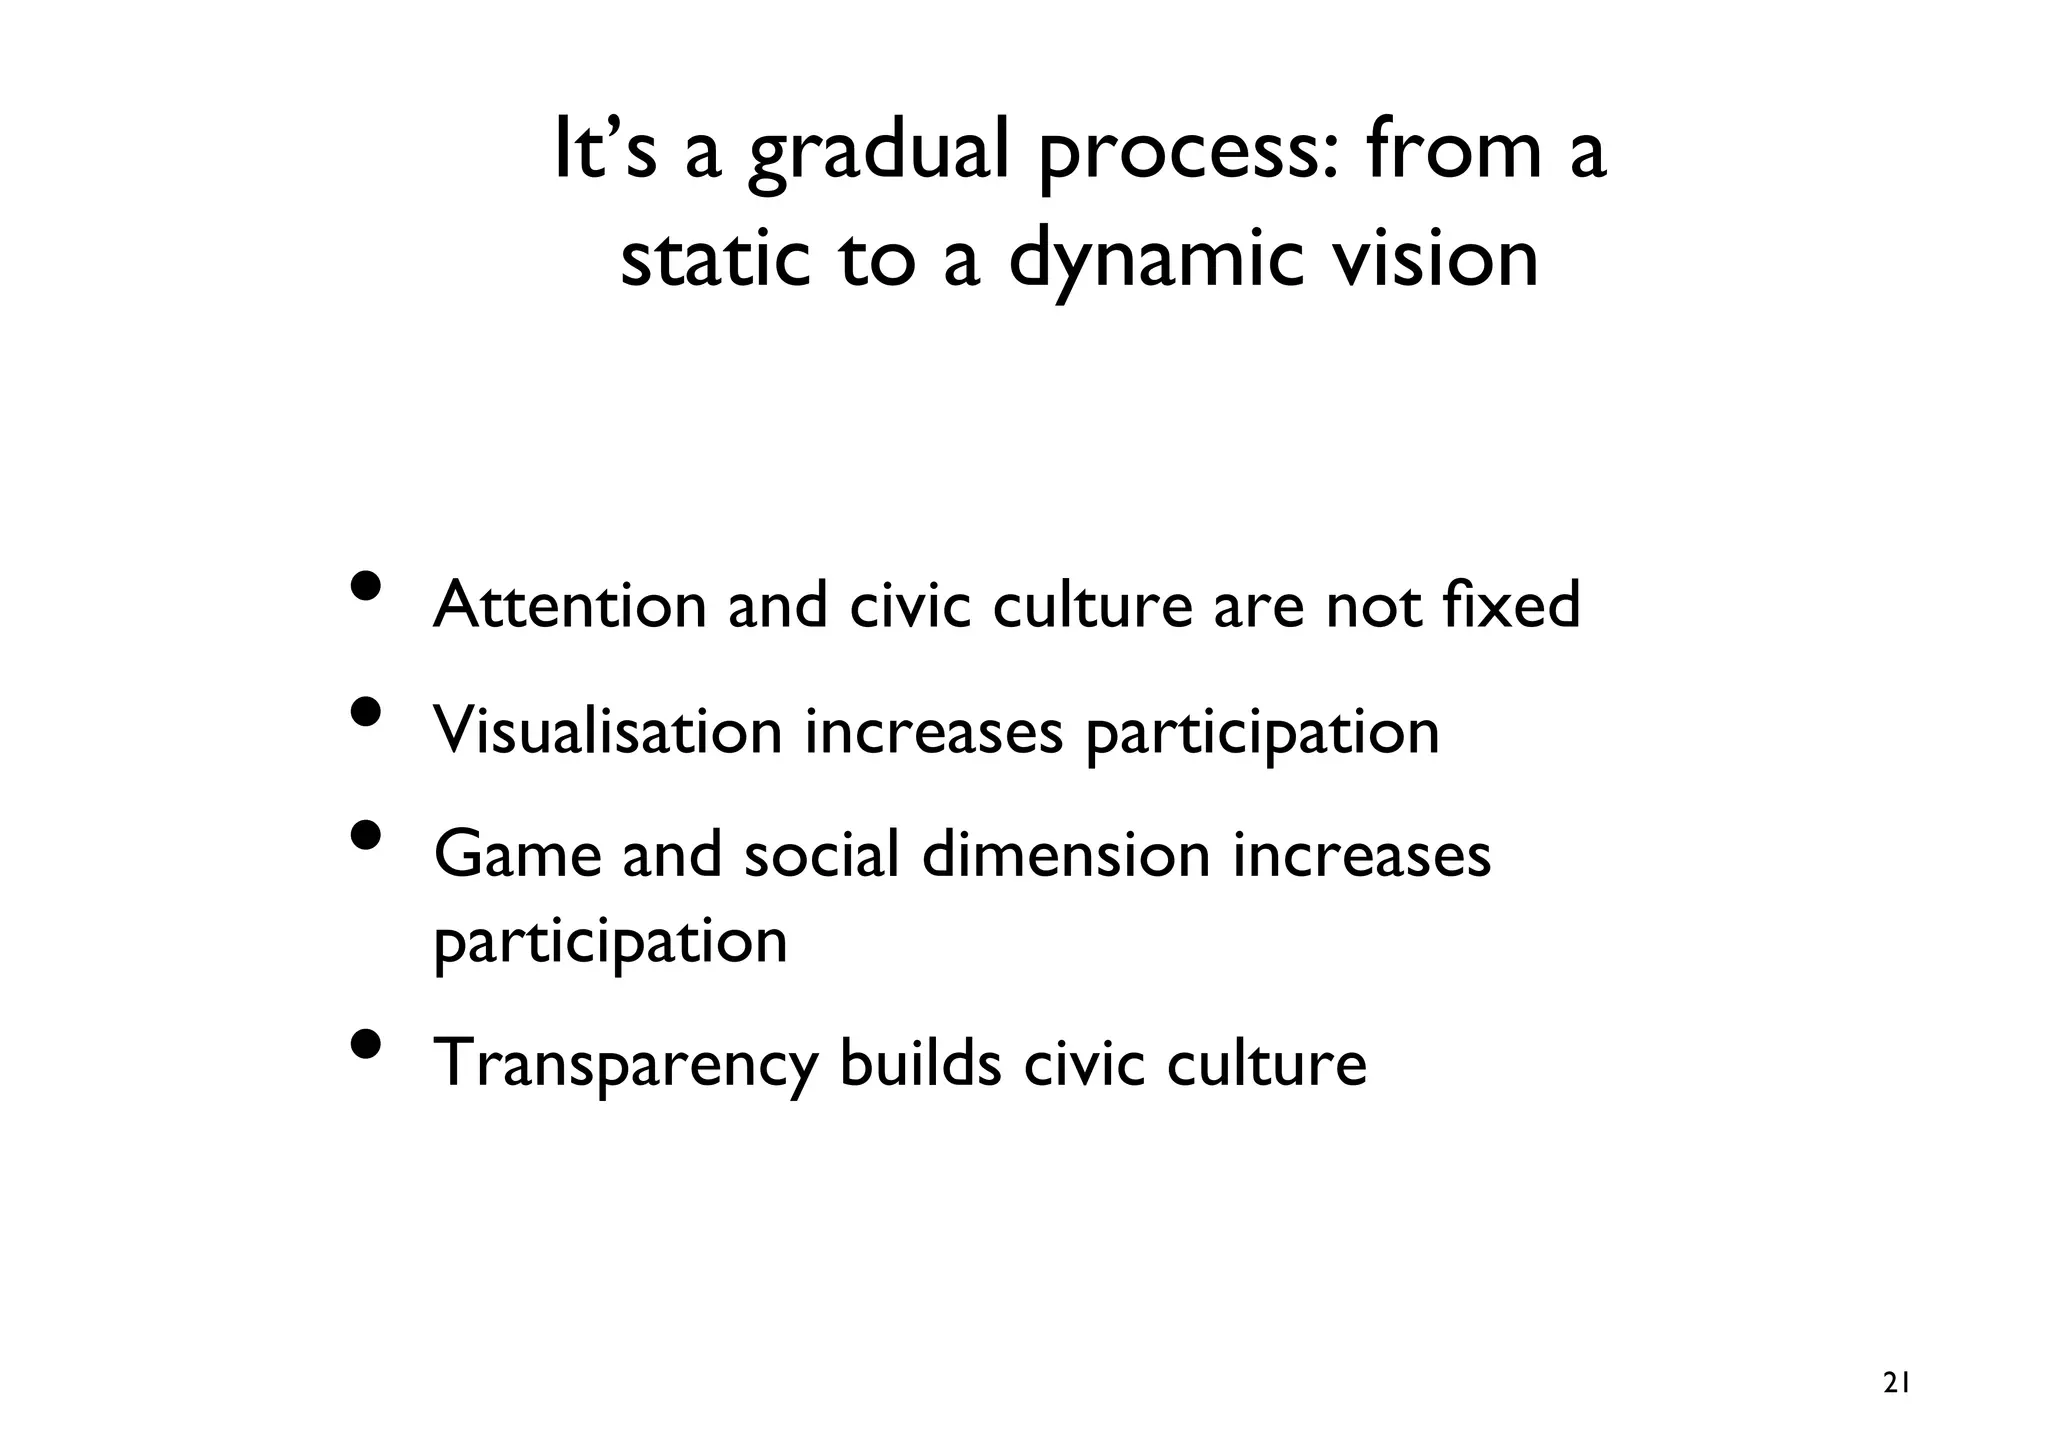
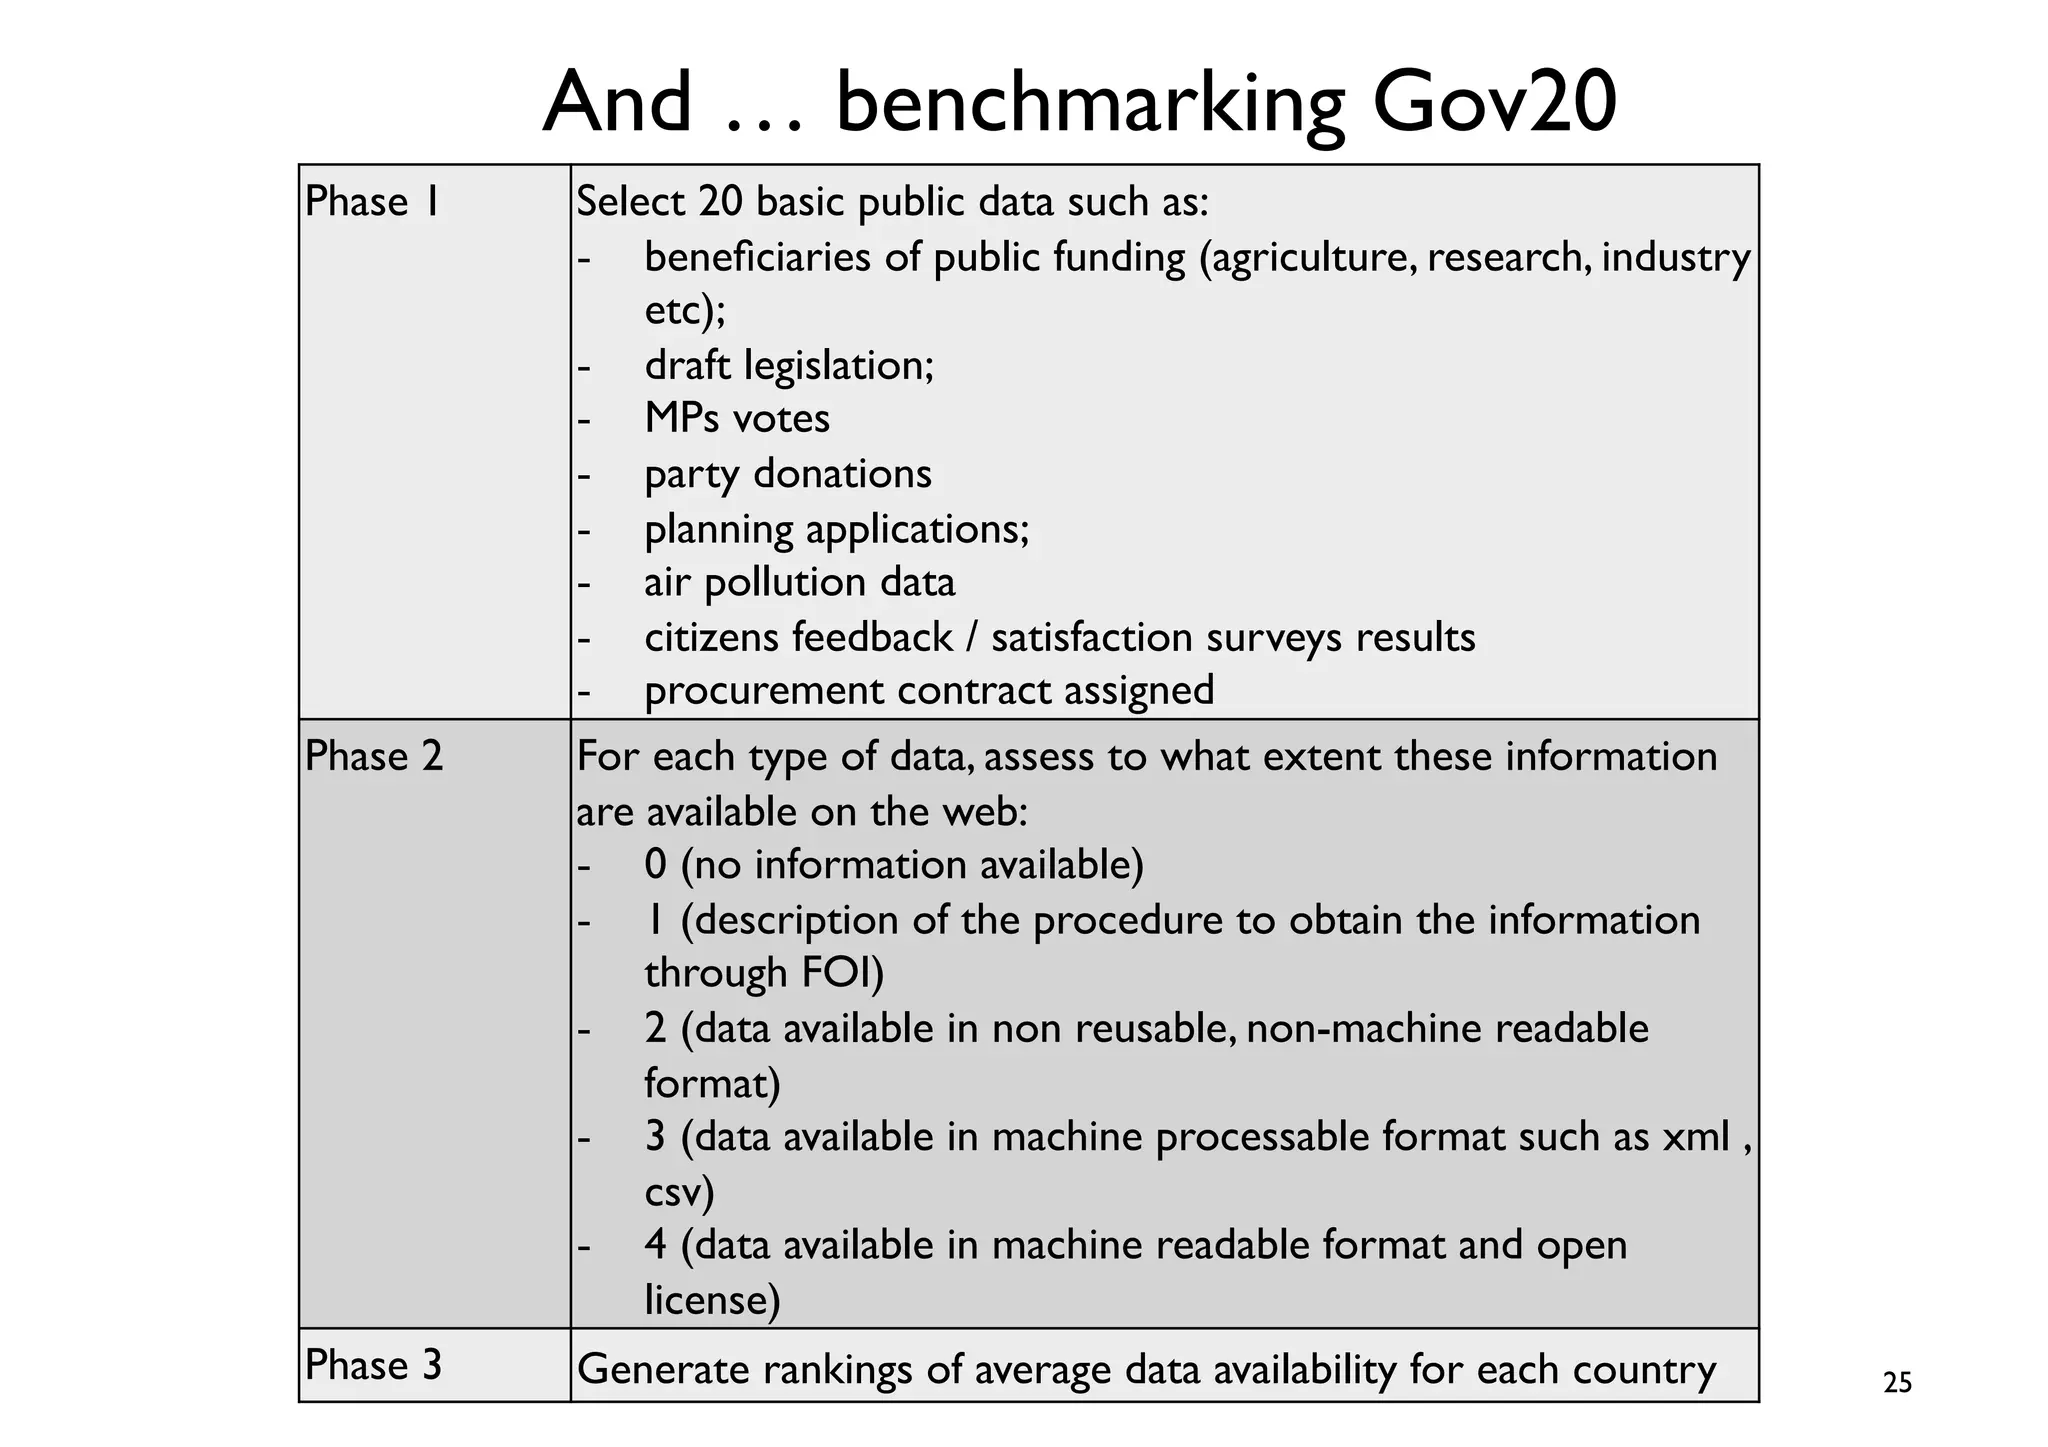
Measuring government 2.0:
                why and how


eGovMonet final conference	


David Osimo	

Tech4i2 ltd.	


                               1
Structure of the talk	


•  The purpose of measuring	

•  The case for government 2.0	

•  The limits of government 2.0	

•  How to measure government 2.0	

•  What next	


                                      2
Structure of the talk	


•  The purpose of measuring	

•  The case for government 2.0	

•  The limits of government 2.0	

•  How to measure government 2.0	

•  What next	


                                      3
Benchmarking is a policy tool	


•  Benchmarking is part of the Open Method of
   Coordination. It is not a scientific but a policy
   tool to stimulate progress	

•  It should be designed and evaluated
   according to its policy impact	

•  Measurement reflects and reinforces a vision	

•  Benchmarking serves to make eGov non-
   technical 	


                                                      4
The sweet spot of benchmarking	


                 Policy
               actionable	


                         Understan
       Robust	

                           dable	


                                      5
Welfare and
                 growth	


                         Effectiveness
Importance	


                            impact	

                                         Efficiency
                                          impact	

                                                                        Take-up	


                                                                 Services
                                                                  supply	


                                                      Expenditure	


                                            Reliability
Benchmarking Government 1.0	


                                 7
•  The purpose of measuring	

•  The case for government 2.0	

•  The limits of government 2.0	

•  How to measure government 2.0	

•  What next	


                                      8
So far ICT has not fundamentally
        changed government	


•  1990s: ICT expected
   to make government
   more transparent,
   efficient and user        Supply	

   Demand	

   oriented	


•  2005+: disillusion as
   burocracy not much
   different from Max
   Weber’s description	


                                                    9
Relevant for key government
                       activities	

         Back office	

                            Front office	


        Regulation	

                        Service delivery	

Cross-agency collaboration	

                 eParticipation	

 Knowledge management	

                    Law enforcement	

     Interoperability	

                Public sector information	

 Human resources mgmt	

                  Public communication	

   Public procurement	

             Transparency and accountability	


    source: “Web 2.0 in Government: Why and How? www.jrc.es	

                                                                          10
Maplight.org	


                  11
Jose Alonso, W3c
Why does gov20 matter?	


Because it does not impose change (e-gov 1.0) but acts
on leverages, drivers and incentives:	

• building on unique and specific knowledge of users: the
“cognitive surplus”	

• the power of visualization	

• reducing information and power asymmetries	

• peer recognition rather than hierarchy 	

• reducing the cost of collective action	

• changing the expectations of citizens	

                                                           14
Different kinds of citizens’ involvement in web
2.0
                                        1.Producing content

                                        2.Providing ratings, reviews

                                        3.Using user-generated content

                                        4.Providing attention, taste data


        3%   10%   40% 100% of Internet users (50% of EU population)


                       Source: IPTS estimation based on Eurostat, IPSOS-MORI, Forrester
“A problem shared 	

       is a problem halved 	

...and a pressure group created”	


           Dr. Paul Hodgkin	

     director PatientOpinion.org
A new vision starting to take
                   shape	


 Automating 	

              Augmenting	

public services	

          public services	

                                                 17
Jose Alonso, W3C guidelines
The limits of transparency	


•  Most countries don’t have MySociety.org or
   Sunlightfoundation.org	

•  Government 2.0 services and websites are
   used by a minority of citizens	

•  Without attention and civic culture,
   transparency is unlikely to generate change	


                                                    19
“with the ideal of naked transparency alone--our
  democracy, like the music industry and print
  journalism generally, is doomed. The Web will
  show us every possible influence. The most
  cynical will be the most salient. Limited attention
  span will assure that the most salient is the most
  stable. Unwarranted conclusions will be drawn,
  careers will be destroyed, alienation will grow.”	


Lawrence Lessig, 2009. Against Transparency
It’s a gradual process: from a
           static to a dynamic vision	


•  Attention and civic culture are not fixed	

•  Visualisation increases participation	

•  Game and social dimension increases
   participation	

•  Transparency builds civic culture	


                                                 21
How to get the full benefits of
         transparency: better
        government and more
         democratic societies	

•  Open data	

•  Competition for innovation: INCA awards	

•  Teaching civic hacking	

•  Raising the level of the debate	

•  And…	


                                                22
Open data raise the level of the
debate: the White House blog
And … benchmarking Gov20	

Phase 1	

   Select 20 basic public data such as:	

             -  beneficiaries of public funding (agriculture, research, industry
                 etc); 	

             -  draft legislation; 	

             -  MPs votes 	

             -  party donations 	

             -  planning applications; 	

             -  air pollution data 	

             -  citizens feedback / satisfaction surveys results	

             -  procurement contract assigned 	

Phase 2	

   For each type of data, assess to what extent these information
             are available on the web:	

             -  0 (no information available) 	

             -  1 (description of the procedure to obtain the information
                 through FOI) 	

             -  2 (data available in non reusable, non-machine readable
                 format) 	

             -  3 (data available in machine processable format such as xml ,
                 csv) 	

             -  4 (data available in machine readable format and open
                 license)	

Phase 3	

   Generate rankings of average data availability for each country	

   25
Conclusion	


•  Benchmarking is a policy tool	

•  Current benchmarking reflects an old vision
   of eGovernment	

•  Transparency as new flagship goal: helps
   providing better government and more
   democratic societies – 	

•  But only if accompanied by civic culture
What YOU can do
                What EU can do	

•  Open public data and create a public data
   catalogue	

•  Benchmarking to encourage open data	

•  Participate to INCA-EU 2010:
   competitions to stimulate social
   applications	

•  Civic education for citizens through civic
   hacking	


                                                27
Thank you	

                 david.osimo@tech4i2.com	

                             @osimod	

               http://egov20.wordpress.com	


                     Further information:	

Osimo, 2008. Web2.0 in government: why and how? www.jrc.es 	


Osimo, 2008. Benchmarking e-government in the web 2.0 era: what to
measure, and how. European Journal of ePractice, August 2008.	


                                                                     28

Egovmonet: benchmarking gov20

  • 1.
    Measuring government 2.0: why and how eGovMonet final conference David Osimo Tech4i2 ltd. 1
  • 2.
    Structure of thetalk •  The purpose of measuring •  The case for government 2.0 •  The limits of government 2.0 •  How to measure government 2.0 •  What next 2
  • 3.
    Structure of thetalk •  The purpose of measuring •  The case for government 2.0 •  The limits of government 2.0 •  How to measure government 2.0 •  What next 3
  • 4.
    Benchmarking is apolicy tool •  Benchmarking is part of the Open Method of Coordination. It is not a scientific but a policy tool to stimulate progress •  It should be designed and evaluated according to its policy impact •  Measurement reflects and reinforces a vision •  Benchmarking serves to make eGov non- technical 4
  • 5.
    The sweet spotof benchmarking Policy actionable Understan Robust dable 5
  • 6.
    Welfare and growth Effectiveness Importance impact Efficiency impact Take-up Services supply Expenditure Reliability
  • 7.
  • 8.
    •  The purposeof measuring •  The case for government 2.0 •  The limits of government 2.0 •  How to measure government 2.0 •  What next 8
  • 9.
    So far ICThas not fundamentally changed government •  1990s: ICT expected to make government more transparent, efficient and user Supply Demand oriented •  2005+: disillusion as burocracy not much different from Max Weber’s description 9
  • 10.
    Relevant for keygovernment activities Back office Front office Regulation Service delivery Cross-agency collaboration eParticipation Knowledge management Law enforcement Interoperability Public sector information Human resources mgmt Public communication Public procurement Transparency and accountability source: “Web 2.0 in Government: Why and How? www.jrc.es 10
  • 11.
  • 13.
  • 14.
    Why does gov20matter? Because it does not impose change (e-gov 1.0) but acts on leverages, drivers and incentives: • building on unique and specific knowledge of users: the “cognitive surplus” • the power of visualization • reducing information and power asymmetries • peer recognition rather than hierarchy • reducing the cost of collective action • changing the expectations of citizens 14
  • 15.
    Different kinds ofcitizens’ involvement in web 2.0  1.Producing content  2.Providing ratings, reviews  3.Using user-generated content  4.Providing attention, taste data 3% 10% 40% 100% of Internet users (50% of EU population) Source: IPTS estimation based on Eurostat, IPSOS-MORI, Forrester
  • 16.
    “A problem shared is a problem halved ...and a pressure group created” Dr. Paul Hodgkin director PatientOpinion.org
  • 17.
    A new visionstarting to take shape Automating Augmenting public services public services 17
  • 18.
    Jose Alonso, W3Cguidelines
  • 19.
    The limits oftransparency •  Most countries don’t have MySociety.org or Sunlightfoundation.org •  Government 2.0 services and websites are used by a minority of citizens •  Without attention and civic culture, transparency is unlikely to generate change 19
  • 20.
    “with the idealof naked transparency alone--our democracy, like the music industry and print journalism generally, is doomed. The Web will show us every possible influence. The most cynical will be the most salient. Limited attention span will assure that the most salient is the most stable. Unwarranted conclusions will be drawn, careers will be destroyed, alienation will grow.” Lawrence Lessig, 2009. Against Transparency
  • 21.
    It’s a gradualprocess: from a static to a dynamic vision •  Attention and civic culture are not fixed •  Visualisation increases participation •  Game and social dimension increases participation •  Transparency builds civic culture 21
  • 22.
    How to getthe full benefits of transparency: better government and more democratic societies •  Open data •  Competition for innovation: INCA awards •  Teaching civic hacking •  Raising the level of the debate •  And… 22
  • 24.
    Open data raisethe level of the debate: the White House blog
  • 25.
    And … benchmarkingGov20 Phase 1 Select 20 basic public data such as: -  beneficiaries of public funding (agriculture, research, industry etc); -  draft legislation; -  MPs votes -  party donations -  planning applications; -  air pollution data -  citizens feedback / satisfaction surveys results -  procurement contract assigned Phase 2 For each type of data, assess to what extent these information are available on the web: -  0 (no information available) -  1 (description of the procedure to obtain the information through FOI) -  2 (data available in non reusable, non-machine readable format) -  3 (data available in machine processable format such as xml , csv) -  4 (data available in machine readable format and open license) Phase 3 Generate rankings of average data availability for each country 25
  • 26.
    Conclusion •  Benchmarking isa policy tool •  Current benchmarking reflects an old vision of eGovernment •  Transparency as new flagship goal: helps providing better government and more democratic societies – •  But only if accompanied by civic culture
  • 27.
    What YOU cando What EU can do •  Open public data and create a public data catalogue •  Benchmarking to encourage open data •  Participate to INCA-EU 2010: competitions to stimulate social applications •  Civic education for citizens through civic hacking 27
  • 28.
    Thank you david.osimo@tech4i2.com @osimod http://egov20.wordpress.com Further information: Osimo, 2008. Web2.0 in government: why and how? www.jrc.es Osimo, 2008. Benchmarking e-government in the web 2.0 era: what to measure, and how. European Journal of ePractice, August 2008. 28