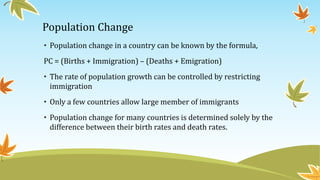
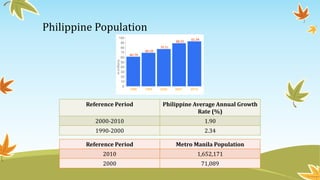
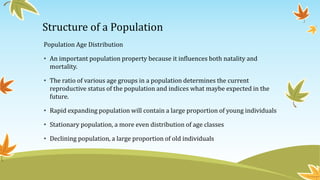
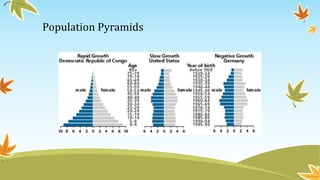
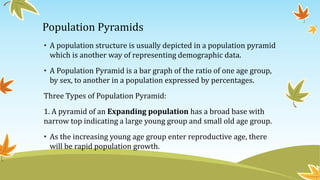
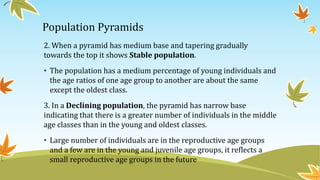
Ecosystem Structure
Raymond c. Baldonado
As a Generalization,
Each ecosystem is a complex functional entity within which there
is a constant exchange of matter and energy between different
components.
Ecosystems are not isolated entities but they are interconnected,
interdependent and interact.
Because of the complexity in organization, interaction,
interdependency and functioning of these systems, it may not be
easy to delimit the geographical boundaries of one ecosystem from
another.
As a Generalization,
Ecosystems are not static, that is, unchanging systems. It
undergoes change after sometime.
Ecosystems are never entirely stable but are in most cases delicate
and can very easily be disrupted.
Stability and Disruption of Ecosystems
Ecosystems maintain their overall stability by three major
mechanisms:
1. Controlling the energy flow through the system.
2. Controlling the rate of nutrients cycling within the system.
3. Maintaining a diversity of species and food webs so that the
stability is not affected seriously by loss od species or food web
links.
Physical and Biological Structure
• Physical structure is the most easily observed feature
• Form and structure of terrestrial ecosystems are determined by
the nature of vegetation
• Ecosystem can be viewed as distinct vegetation units
• Together with the animal population and habitat conditions they
constitute as ecological units
Physical Structure
A. Vertical Stratification
Forest
The distribution of different life forms of the plants – their size,
branching and leaves which influences and is influenced by
vertical gradient of light.
It consists of several layers of vegetation, each of which provides
habitat for animal life in the forest.
From top to bottom, Overstory – Canopy – Understory – Tree layer
– Shrub layer – Herb layer or Ground layer – Forest floor
Vertical Stratification in Forest
Vertical Stratification in Oceans/Seas
Vertical Stratification
Ocean/Seas
In open ocean, there are five major vertical strata:
1. Epipelagic or Photic zone/Surface layer
This is the layer where light penetrates
Generally reaches to 200 m and bordered by the collection of clines
(Thermocline, Halocline and Pycnocline)
2. Mesopelagic or Twilight zone
Depending on water clarity, some light may filter through, but there is not
enough for photosynthesis to occur
Stretches from 200-1000 m and bombarded by Chemoclines-Oxygen and
Salinity level
Vertical Stratification
Ocean/Seas
3. Bathypelagic or Midnight zone
Occur between 1000-4000 m
Many creature still live here
4. Abyssopelagic
Exists below 4000 m
5. Hadopelagic zone
Deep ocean trenches that open below the abyssal plain
Physical Structure
B. Horizontal stratification
The study of vegetation in concentric rings from the outer
boundary of the ecosystem toward the center.
This is another way of subdividing an ecosystem.
Differences in vegetation are caused by the climate and local
conditions.
This type of stratification is most noticeable around ponds and
bogs.
Horizontal Stratification in Pond
Zones in Horizontal Stratification
Ponds/Swamps
1. Epilimnion
The upper portion of the water mass in lakes and reservoirs
Have higher temperatures, higher air content and greater
penetration by the sun’s rays
Zone which has the highest biological activity
Zones in Horizontal Stratification
2. Hypolimnion
The lower part of the water mass
Water temperature and air content are lower and the light is dim
to dark
Biological activity is always lower than in the upper parts
3. Metalimnion
Found between the epilimnion and hypolimnion
Both the biological conditions in epilimnion and hypolimnion are
persisted
Zones in Horizontal Stratification
Inshore area of water, an area which is hollow covered by the epilimnion,
active in biological production is called the Littoral zone.
The bottom area covered by the hypolimnion, less productive than
littoral zone, mainly the offshore is called the Profundal zone.
The portion of the hollow covered by the metalimnion has no specific
characteristics because of the changes occurring in this region and is
usually treated as the littoral.
Zones in Horizontal Stratification
Lakes
Thermocline- the point at which the water
temperature begins to steadily drop off.
Halocline- boundary between oxic and anoxic
water and salinity gradient respectively.
Monimolimnion formed if the hypolimnion is deep
enough to never mix with the upper layers.
Zones in Horizontal Stratification
Ocean/Seas
Zones in Horizontal Stratification
Ocean/Seas
1. Littoral or Coastal zone- is the most affected by estuaries and
other inflow sources.
2. Sublittoral or Neritic/ Demersal zone- part of the coastal zone as
well where many coral reefs grow, where most benthic (bottom-
dwelling) organisms exist.
3. Bathyal, Abyssal and Hadal plains
Physical Structure
C. Edges and Ecotones
Occur when the transitional zone between two communities
provide habitat that can be used by members of both adjacent
communities.
 Edge- is the place where two or more vegetation types meet.
 Ecotone- is the transition zone between two structurally different
communities that does not only meet but integrate.
Edges and Ecotones
Biological Structure
A. Species Dominance
The control within the community over environmental conditions
influencing associated species by one or several species of plants
or animals, enforced by number, density or growth form.
Dominant species refers to single species or group of species that
biologically control an ecosystem or community or modify the
environment
The dominants may be the most numerous, possess the highest
biomass, preempt the most space and make the largest
contribution to energy flow or mineral cycling.
Dominant Species
Biological Structure
B. Species Diversity
Determines the number of different species occupying the same
area.
It involves two components:
1. Species richness- refers to the number of species occurring in a
certain community.
2. Species evenness- refers to the degree of equitability in the
distribution of individuals among group of species.
Biological Structure
Local diversity refer to the richness of species in a local area which
reflects the uniqueness of the local habitat.
Influenced by the Regional diversity, which is a product of climate
history, historical accidents and geographical positions of dispersal
barriers.
Global diversity which is influenced by both latitudinal and altitudinal
gradients.
C. Species Abundance
Associated with species diversity, it refers to the number of individuals
of a species in a given area.
Biological Structure
Exotic Species
 Exotic/Alien/Non-native/Introduced Species- species living outside its native
distributional range, which have arrived there by human activity, either
deliberate or accidental
• Have various effects on the local ecosystem
• It can become established and spread beyond the place of introduction and
termed as Invasive species.
• Some species have negative effect, no effect or only minor effect but there are
species that have been introduced intentionally to combat pests, they are called
Biocontrols
Exotic Species
Biological Structure
Keystone Species
 Keystone species- species that has a large effect on the
communities in which it occurs.
• It helps to maintain local biodiversity within a community either
by controlling populations of other species that would otherwise
dominate the community or by providing critical resources for a
wide range of species.
Keystone Species
Activity No. 4
Impact of Population
Explosion
Materials:
Manila paper
Pentel pen
Masking tape
Procedure:
• Each group will discuss and write in the manila paper the
answers to the following questions:
1. What are the consequences/impacts of population explosion
in a developing country like the Philippines?
2. Give suggestions on how to prevent rapid population growth.
3. Which do you think is the best strategy/way which is
applicable to our country?
• Each group will be given 5 minutes to present to the class their
outputs.
Population: Growth and
Regulation
Population
• A group of individuals of the same species occupying a certain
place at a particular time.
• Can be other groups within which individuals may exchange
genetic information occupying a particular space, has various
characteristics which, although, best expressed as statistical
functions, are, the unique possession of a group.
• In ecology, a population is the basic unit for management.
Management objectives are focused towards maintaining certain
levels of populations.
Effective Population
• This is the number of individuals of a population that participate in
breeding or reproduction within a particular population.
• The effective population is substantially lower than the actual
population because:
a. Non-reproductive individuals are not included in the effective
population, that is, young individuals as well as non-breeding adults
(sterile and very old individuals).
b. For animals, the sex ratio may be imbalanced because not all mature
individuals breed.
c. Social behavior of animals
Minimum Viable Population
• The minimum number of individuals of a population that will
persist in a viable state for given interval of time.
• This is a population that maintains its vigor and has the ability for
long-term persistence and adaptation.
• Has two concepts:
a. Genetic concept- based on the rate at which genetic variation in a
population is lost.
b. Demographic concept- connected with the probability of
complete extinction of a population through random
demographic forces
Minimum Viable Population
• Should have sufficient genetic variation to adapt to changing
environmental conditions.
• As the population is reduced in size or divided into small
populations, the frequency of inbreeding will increase.
• Inbred populations have less potential for adaptation to
environmental changes.
• Lethal alleles may come out and there may be increased mortality
in young individuals
Population Characteristics
Any population has characteristics or parameters that cannot be
applied to individuals. These are characteristics used to describe a
population only and include:
a. Size (numbers) or density
b. Age distribution (structure)
c. Sex distribution (structure)
Population Characteristics
Properties of Population:
1. Population size/density
2. Natality
3. Mortality
4. Age distribution
5. Biotic potential
6. Dispersion
7. Growth form
Genetic Properties:
1. Adaptiveness
2. Reproductiveness
3. Fitness
4. Persistence
Population Size/Density
1. Population size- is the basic characteristic which is simply the number of
individuals in a population.
2. Population density- is the number of individuals/biomass of a population per
unit area (or volume).
Pd = Number of individuals/Population biomass
Unit area/Volume
Two Types of population Density
1. Crude density- the number (or biomass) per unit total space
2. Specific density- the number (or biomass) per unit of habitat space
Natality
• It is the inherent ability of a population to increase
• The production of new individuals by birth, hatching, germinating
or fission
• Natality rate/Birth rate is the number of young produced per
individual per unit time
N = Number of individuals per unit time
Total number of population
Natality
Two Types of Population Natality:
1. Maximum/Absolute/Physiological natality- is the theoretical
maximum production of new individuals under ideal conditions.
2. 2. Ecological/ Realized natality- refers to population increase
under an actual or specific environmental condition
• Reproduction varies widely between species
Mortality
• Refers to death rate of individuals in the population
• Mortality rate/ Death rate is the number of deaths per individual per unit time
M = Number of individuals dying per unit of time
Total number of population
Two Types of Population Mortality:
1. Ecological/ Realized mortality- where there is a loss of individuals under given
environmental conditions.
2. Theoretical minimum mortality- a constant for a population which represents the
lost under ideal or non-limiting conditions.
• Survival rate has the greater interest than the death rate
SR = 1-M
Migration
• The rate of population change for a certain area is affected by movement of
people into (Immigration) and out to (Emigration) that area.
• Refers to the movement of the people from one place to another to reside
permanently for a certain period of time.
• Net migration rate refers to the difference between the number of people who
enter the country and the number of people who leave, per year per 1000
persons in the population.
NMT = Immigration-Emigration
Total population
Note: Calculate at midpoint of the year
Population Change
• Population change in a country can be known by the formula,
PC = (Births + Immigration) – (Deaths + Emigration)
• The rate of population growth can be controlled by restricting
immigration
• Only a few countries allow large member of immigrants
• Population change for many countries is determined solely by the
difference between their birth rates and death rates.
Philippine Population
Reference Period Philippine Average Annual Growth
Rate (%)
2000-2010 1.90
1990-2000 2.34
Reference Period Metro Manila Population
2010 1,652,171
2000 71,089
Structure of a Population
Population Age Distribution
• An important population property because it influences both natality and
mortality.
• The ratio of various age groups in a population determines the current
reproductive status of the population and indices what maybe expected in the
future.
• Rapid expanding population will contain a large proportion of young individuals
• Stationary population, a more even distribution of age classes
• Declining population, a large proportion of old individuals
Population Pyramids
Population Pyramids
• A population structure is usually depicted in a population pyramid
which is another way of representing demographic data.
• A Population Pyramid is a bar graph of the ratio of one age group,
by sex, to another in a population expressed by percentages.
Three Types of Population Pyramid:
1. A pyramid of an Expanding population has a broad base with
narrow top indicating a large young group and small old age group.
• As the increasing young age group enter reproductive age, there
will be rapid population growth.
Population Pyramids
2. When a pyramid has medium base and tapering gradually
towards the top it shows Stable population.
• The population has a medium percentage of young individuals and
the age ratios of one age group to another are about the same
except the oldest class.
3. In a Declining population, the pyramid has narrow base
indicating that there is a greater number of individuals in the middle
age classes than in the young and oldest classes.
• Large number of individuals are in the reproductive age groups
and a few are in the young and juvenile age groups, it reflects a
small reproductive age groups in the future

Ecosystem Structures

  • 1.
  • 2.
    As a Generalization, Eachecosystem is a complex functional entity within which there is a constant exchange of matter and energy between different components. Ecosystems are not isolated entities but they are interconnected, interdependent and interact. Because of the complexity in organization, interaction, interdependency and functioning of these systems, it may not be easy to delimit the geographical boundaries of one ecosystem from another.
  • 3.
    As a Generalization, Ecosystemsare not static, that is, unchanging systems. It undergoes change after sometime. Ecosystems are never entirely stable but are in most cases delicate and can very easily be disrupted.
  • 4.
    Stability and Disruptionof Ecosystems Ecosystems maintain their overall stability by three major mechanisms: 1. Controlling the energy flow through the system. 2. Controlling the rate of nutrients cycling within the system. 3. Maintaining a diversity of species and food webs so that the stability is not affected seriously by loss od species or food web links.
  • 5.
    Physical and BiologicalStructure • Physical structure is the most easily observed feature • Form and structure of terrestrial ecosystems are determined by the nature of vegetation • Ecosystem can be viewed as distinct vegetation units • Together with the animal population and habitat conditions they constitute as ecological units
  • 6.
    Physical Structure A. VerticalStratification Forest The distribution of different life forms of the plants – their size, branching and leaves which influences and is influenced by vertical gradient of light. It consists of several layers of vegetation, each of which provides habitat for animal life in the forest. From top to bottom, Overstory – Canopy – Understory – Tree layer – Shrub layer – Herb layer or Ground layer – Forest floor
  • 7.
  • 8.
  • 9.
    Vertical Stratification Ocean/Seas In openocean, there are five major vertical strata: 1. Epipelagic or Photic zone/Surface layer This is the layer where light penetrates Generally reaches to 200 m and bordered by the collection of clines (Thermocline, Halocline and Pycnocline) 2. Mesopelagic or Twilight zone Depending on water clarity, some light may filter through, but there is not enough for photosynthesis to occur Stretches from 200-1000 m and bombarded by Chemoclines-Oxygen and Salinity level
  • 10.
    Vertical Stratification Ocean/Seas 3. Bathypelagicor Midnight zone Occur between 1000-4000 m Many creature still live here 4. Abyssopelagic Exists below 4000 m 5. Hadopelagic zone Deep ocean trenches that open below the abyssal plain
  • 11.
    Physical Structure B. Horizontalstratification The study of vegetation in concentric rings from the outer boundary of the ecosystem toward the center. This is another way of subdividing an ecosystem. Differences in vegetation are caused by the climate and local conditions. This type of stratification is most noticeable around ponds and bogs.
  • 12.
  • 13.
    Zones in HorizontalStratification Ponds/Swamps 1. Epilimnion The upper portion of the water mass in lakes and reservoirs Have higher temperatures, higher air content and greater penetration by the sun’s rays Zone which has the highest biological activity
  • 14.
    Zones in HorizontalStratification 2. Hypolimnion The lower part of the water mass Water temperature and air content are lower and the light is dim to dark Biological activity is always lower than in the upper parts 3. Metalimnion Found between the epilimnion and hypolimnion Both the biological conditions in epilimnion and hypolimnion are persisted
  • 15.
    Zones in HorizontalStratification Inshore area of water, an area which is hollow covered by the epilimnion, active in biological production is called the Littoral zone. The bottom area covered by the hypolimnion, less productive than littoral zone, mainly the offshore is called the Profundal zone. The portion of the hollow covered by the metalimnion has no specific characteristics because of the changes occurring in this region and is usually treated as the littoral.
  • 16.
    Zones in HorizontalStratification Lakes Thermocline- the point at which the water temperature begins to steadily drop off. Halocline- boundary between oxic and anoxic water and salinity gradient respectively. Monimolimnion formed if the hypolimnion is deep enough to never mix with the upper layers.
  • 17.
    Zones in HorizontalStratification Ocean/Seas
  • 18.
    Zones in HorizontalStratification Ocean/Seas 1. Littoral or Coastal zone- is the most affected by estuaries and other inflow sources. 2. Sublittoral or Neritic/ Demersal zone- part of the coastal zone as well where many coral reefs grow, where most benthic (bottom- dwelling) organisms exist. 3. Bathyal, Abyssal and Hadal plains
  • 19.
    Physical Structure C. Edgesand Ecotones Occur when the transitional zone between two communities provide habitat that can be used by members of both adjacent communities.  Edge- is the place where two or more vegetation types meet.  Ecotone- is the transition zone between two structurally different communities that does not only meet but integrate.
  • 20.
  • 21.
    Biological Structure A. SpeciesDominance The control within the community over environmental conditions influencing associated species by one or several species of plants or animals, enforced by number, density or growth form. Dominant species refers to single species or group of species that biologically control an ecosystem or community or modify the environment The dominants may be the most numerous, possess the highest biomass, preempt the most space and make the largest contribution to energy flow or mineral cycling.
  • 22.
  • 23.
    Biological Structure B. SpeciesDiversity Determines the number of different species occupying the same area. It involves two components: 1. Species richness- refers to the number of species occurring in a certain community. 2. Species evenness- refers to the degree of equitability in the distribution of individuals among group of species.
  • 24.
    Biological Structure Local diversityrefer to the richness of species in a local area which reflects the uniqueness of the local habitat. Influenced by the Regional diversity, which is a product of climate history, historical accidents and geographical positions of dispersal barriers. Global diversity which is influenced by both latitudinal and altitudinal gradients. C. Species Abundance Associated with species diversity, it refers to the number of individuals of a species in a given area.
  • 25.
    Biological Structure Exotic Species Exotic/Alien/Non-native/Introduced Species- species living outside its native distributional range, which have arrived there by human activity, either deliberate or accidental • Have various effects on the local ecosystem • It can become established and spread beyond the place of introduction and termed as Invasive species. • Some species have negative effect, no effect or only minor effect but there are species that have been introduced intentionally to combat pests, they are called Biocontrols
  • 26.
  • 27.
    Biological Structure Keystone Species Keystone species- species that has a large effect on the communities in which it occurs. • It helps to maintain local biodiversity within a community either by controlling populations of other species that would otherwise dominate the community or by providing critical resources for a wide range of species.
  • 28.
  • 30.
  • 31.
    Impact of Population Explosion Materials: Manilapaper Pentel pen Masking tape Procedure: • Each group will discuss and write in the manila paper the answers to the following questions: 1. What are the consequences/impacts of population explosion in a developing country like the Philippines? 2. Give suggestions on how to prevent rapid population growth. 3. Which do you think is the best strategy/way which is applicable to our country? • Each group will be given 5 minutes to present to the class their outputs.
  • 32.
  • 33.
    Population • A groupof individuals of the same species occupying a certain place at a particular time. • Can be other groups within which individuals may exchange genetic information occupying a particular space, has various characteristics which, although, best expressed as statistical functions, are, the unique possession of a group. • In ecology, a population is the basic unit for management. Management objectives are focused towards maintaining certain levels of populations.
  • 34.
    Effective Population • Thisis the number of individuals of a population that participate in breeding or reproduction within a particular population. • The effective population is substantially lower than the actual population because: a. Non-reproductive individuals are not included in the effective population, that is, young individuals as well as non-breeding adults (sterile and very old individuals). b. For animals, the sex ratio may be imbalanced because not all mature individuals breed. c. Social behavior of animals
  • 35.
    Minimum Viable Population •The minimum number of individuals of a population that will persist in a viable state for given interval of time. • This is a population that maintains its vigor and has the ability for long-term persistence and adaptation. • Has two concepts: a. Genetic concept- based on the rate at which genetic variation in a population is lost. b. Demographic concept- connected with the probability of complete extinction of a population through random demographic forces
  • 36.
    Minimum Viable Population •Should have sufficient genetic variation to adapt to changing environmental conditions. • As the population is reduced in size or divided into small populations, the frequency of inbreeding will increase. • Inbred populations have less potential for adaptation to environmental changes. • Lethal alleles may come out and there may be increased mortality in young individuals
  • 37.
    Population Characteristics Any populationhas characteristics or parameters that cannot be applied to individuals. These are characteristics used to describe a population only and include: a. Size (numbers) or density b. Age distribution (structure) c. Sex distribution (structure)
  • 38.
    Population Characteristics Properties ofPopulation: 1. Population size/density 2. Natality 3. Mortality 4. Age distribution 5. Biotic potential 6. Dispersion 7. Growth form Genetic Properties: 1. Adaptiveness 2. Reproductiveness 3. Fitness 4. Persistence
  • 39.
    Population Size/Density 1. Populationsize- is the basic characteristic which is simply the number of individuals in a population. 2. Population density- is the number of individuals/biomass of a population per unit area (or volume). Pd = Number of individuals/Population biomass Unit area/Volume Two Types of population Density 1. Crude density- the number (or biomass) per unit total space 2. Specific density- the number (or biomass) per unit of habitat space
  • 40.
    Natality • It isthe inherent ability of a population to increase • The production of new individuals by birth, hatching, germinating or fission • Natality rate/Birth rate is the number of young produced per individual per unit time N = Number of individuals per unit time Total number of population
  • 41.
    Natality Two Types ofPopulation Natality: 1. Maximum/Absolute/Physiological natality- is the theoretical maximum production of new individuals under ideal conditions. 2. 2. Ecological/ Realized natality- refers to population increase under an actual or specific environmental condition • Reproduction varies widely between species
  • 42.
    Mortality • Refers todeath rate of individuals in the population • Mortality rate/ Death rate is the number of deaths per individual per unit time M = Number of individuals dying per unit of time Total number of population Two Types of Population Mortality: 1. Ecological/ Realized mortality- where there is a loss of individuals under given environmental conditions. 2. Theoretical minimum mortality- a constant for a population which represents the lost under ideal or non-limiting conditions. • Survival rate has the greater interest than the death rate SR = 1-M
  • 43.
    Migration • The rateof population change for a certain area is affected by movement of people into (Immigration) and out to (Emigration) that area. • Refers to the movement of the people from one place to another to reside permanently for a certain period of time. • Net migration rate refers to the difference between the number of people who enter the country and the number of people who leave, per year per 1000 persons in the population. NMT = Immigration-Emigration Total population Note: Calculate at midpoint of the year
  • 44.
    Population Change • Populationchange in a country can be known by the formula, PC = (Births + Immigration) – (Deaths + Emigration) • The rate of population growth can be controlled by restricting immigration • Only a few countries allow large member of immigrants • Population change for many countries is determined solely by the difference between their birth rates and death rates.
  • 45.
    Philippine Population Reference PeriodPhilippine Average Annual Growth Rate (%) 2000-2010 1.90 1990-2000 2.34 Reference Period Metro Manila Population 2010 1,652,171 2000 71,089
  • 46.
    Structure of aPopulation Population Age Distribution • An important population property because it influences both natality and mortality. • The ratio of various age groups in a population determines the current reproductive status of the population and indices what maybe expected in the future. • Rapid expanding population will contain a large proportion of young individuals • Stationary population, a more even distribution of age classes • Declining population, a large proportion of old individuals
  • 47.
  • 48.
    Population Pyramids • Apopulation structure is usually depicted in a population pyramid which is another way of representing demographic data. • A Population Pyramid is a bar graph of the ratio of one age group, by sex, to another in a population expressed by percentages. Three Types of Population Pyramid: 1. A pyramid of an Expanding population has a broad base with narrow top indicating a large young group and small old age group. • As the increasing young age group enter reproductive age, there will be rapid population growth.
  • 49.
    Population Pyramids 2. Whena pyramid has medium base and tapering gradually towards the top it shows Stable population. • The population has a medium percentage of young individuals and the age ratios of one age group to another are about the same except the oldest class. 3. In a Declining population, the pyramid has narrow base indicating that there is a greater number of individuals in the middle age classes than in the young and oldest classes. • Large number of individuals are in the reproductive age groups and a few are in the young and juvenile age groups, it reflects a small reproductive age groups in the future