Downloaded 442 times

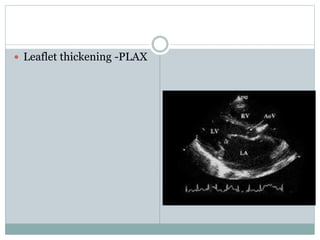
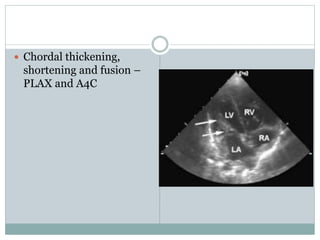
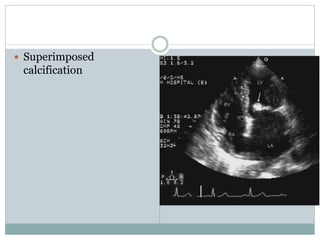
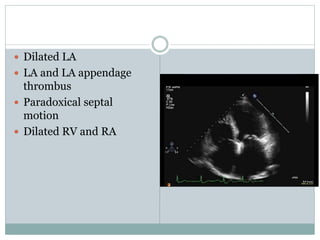
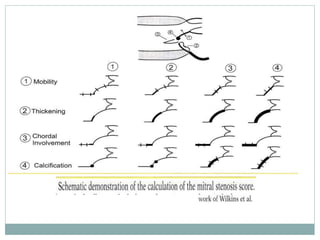
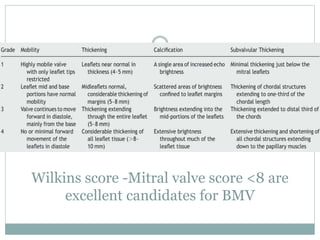
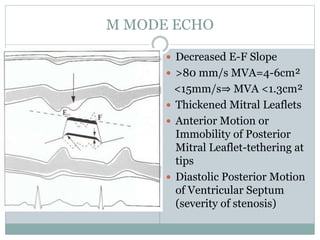
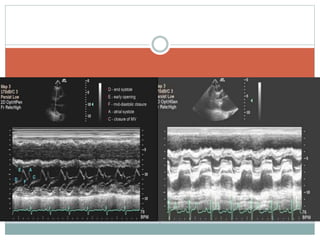
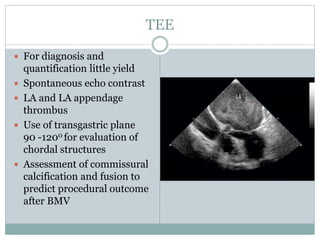
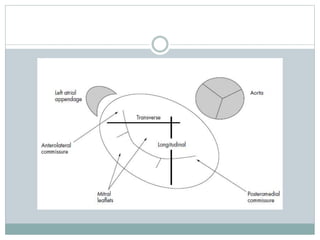
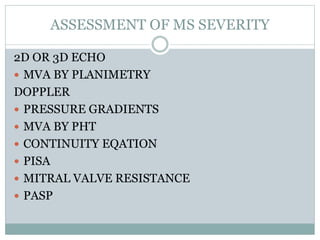
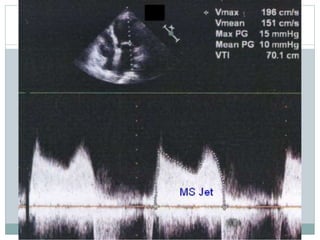
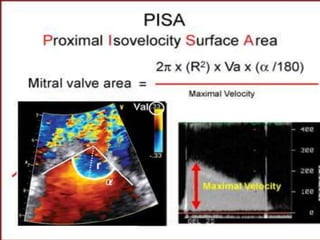
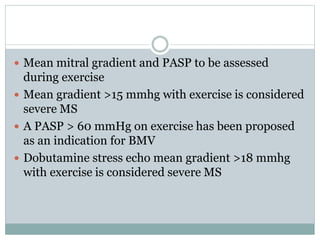
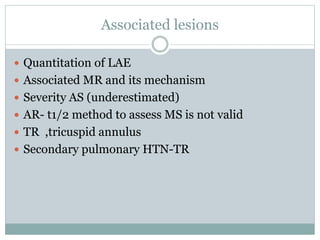
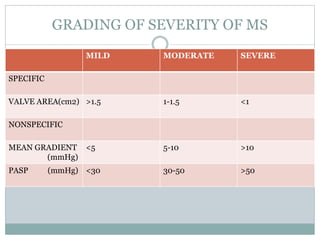
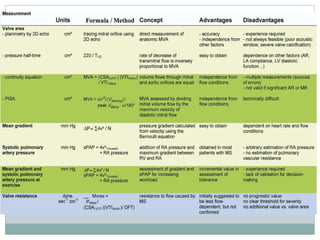


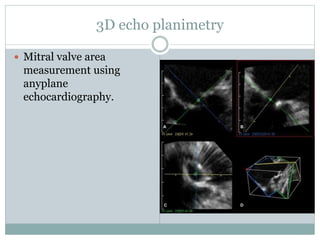
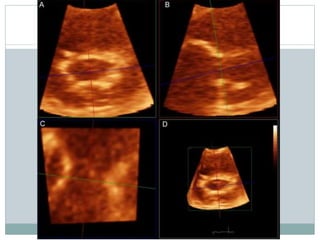

This document discusses the echocardiographic assessment of mitral stenosis (MS). It describes the causes and anatomical features of different types of MS and the use of 2D, M-mode, Doppler, and 3D echocardiography to evaluate the severity of MS. Key findings that can be assessed include mitral valve area, pressure gradients, flow velocities, and the effects of MS on cardiac chambers and function. Severity is graded based on parameters such as mitral valve area, mean gradient, and pulmonary artery pressure. Stress echocardiography may help unmask symptoms in questionable cases.


