Downloaded 194 times

![Step 5: Measure the Isovolumic Relaxation Time
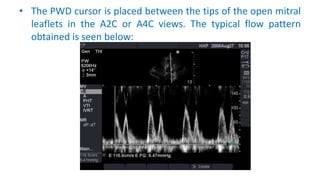
• Pulsed Doppler is used to show the time interval between aortic valve
closure and mitral valve opening (the isovolumic relaxation time [IVRT])
• The IVRT normally 50 to 100 ms, is prolonged with impaired relaxation but
is shortened with severe diastolic dysfunction and reduced compliance
• Measurement of isovolumic relaxation time (IVRT) by placing the PW
Doppler sample volume in between LV inflow and outflow (B) to
simultaneously display the end of aortic ejection and the onset of mitral E-
wave velocity (C)](https://image.slidesharecdn.com/assessmentofdiastolicfunction-170403122117/85/Assessment-of-diastolic-function-by-echo-19-320.jpg)
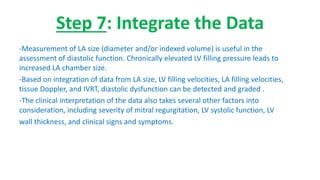
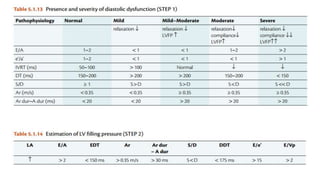
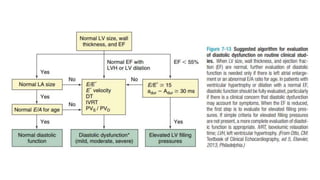
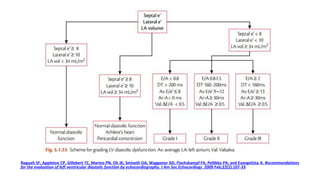
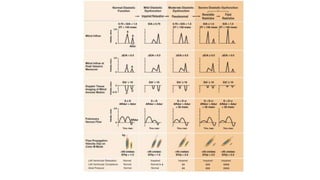


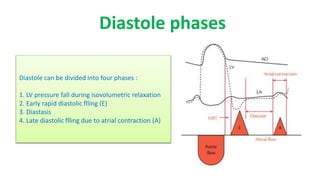
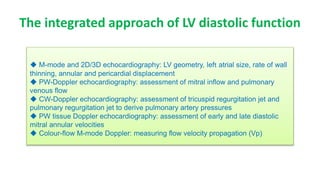
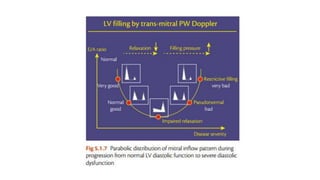
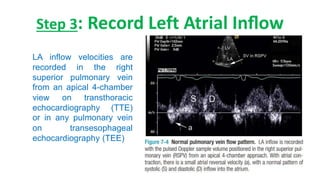
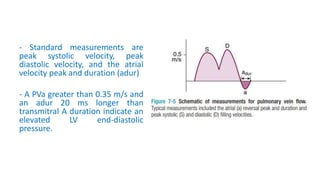
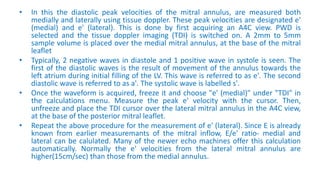
This document outlines the integrated echocardiographic approach for assessing left ventricular diastolic function. It describes the four phases of diastole and how pulsed-wave, tissue, and color Doppler can be used to evaluate parameters like mitral inflow velocities, pulmonary vein flow, tissue velocities, and isovolumic relaxation time. By integrating measurements of left atrial size, ventricular filling velocities, annular velocities, and other Doppler data, diastolic dysfunction can be detected and graded.