Downloaded 227 times

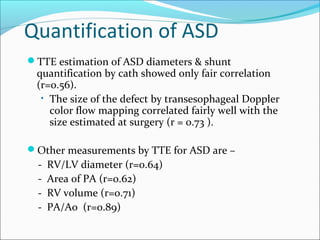
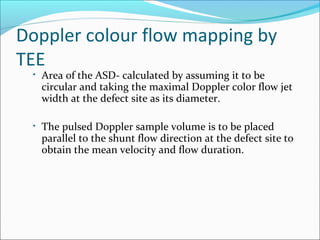
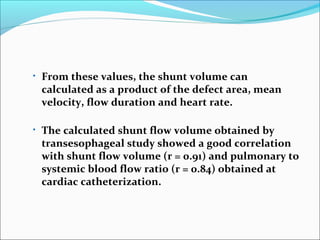
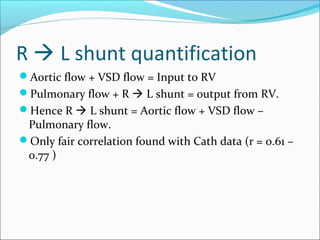

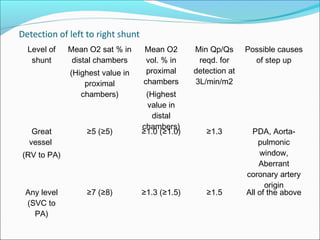
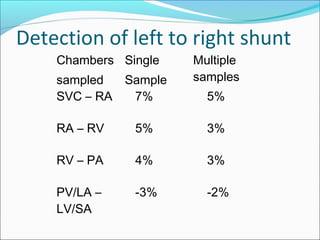
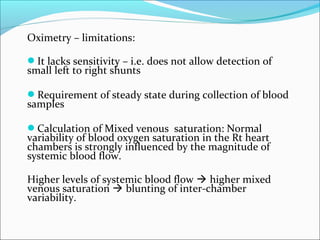
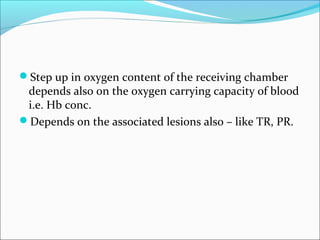


This document discusses various methods for quantifying intracardiac shunts in patients with congenital heart lesions. It describes invasive oximetry and indicator dilution techniques as well as noninvasive Doppler echocardiography methods. For echocardiography, it outlines techniques for quantifying left-to-right shunts using pulmonary and aortic flow measurements, as well as a simplified method using diameter ratios. It also discusses limitations and sources of error for these quantification methods.


