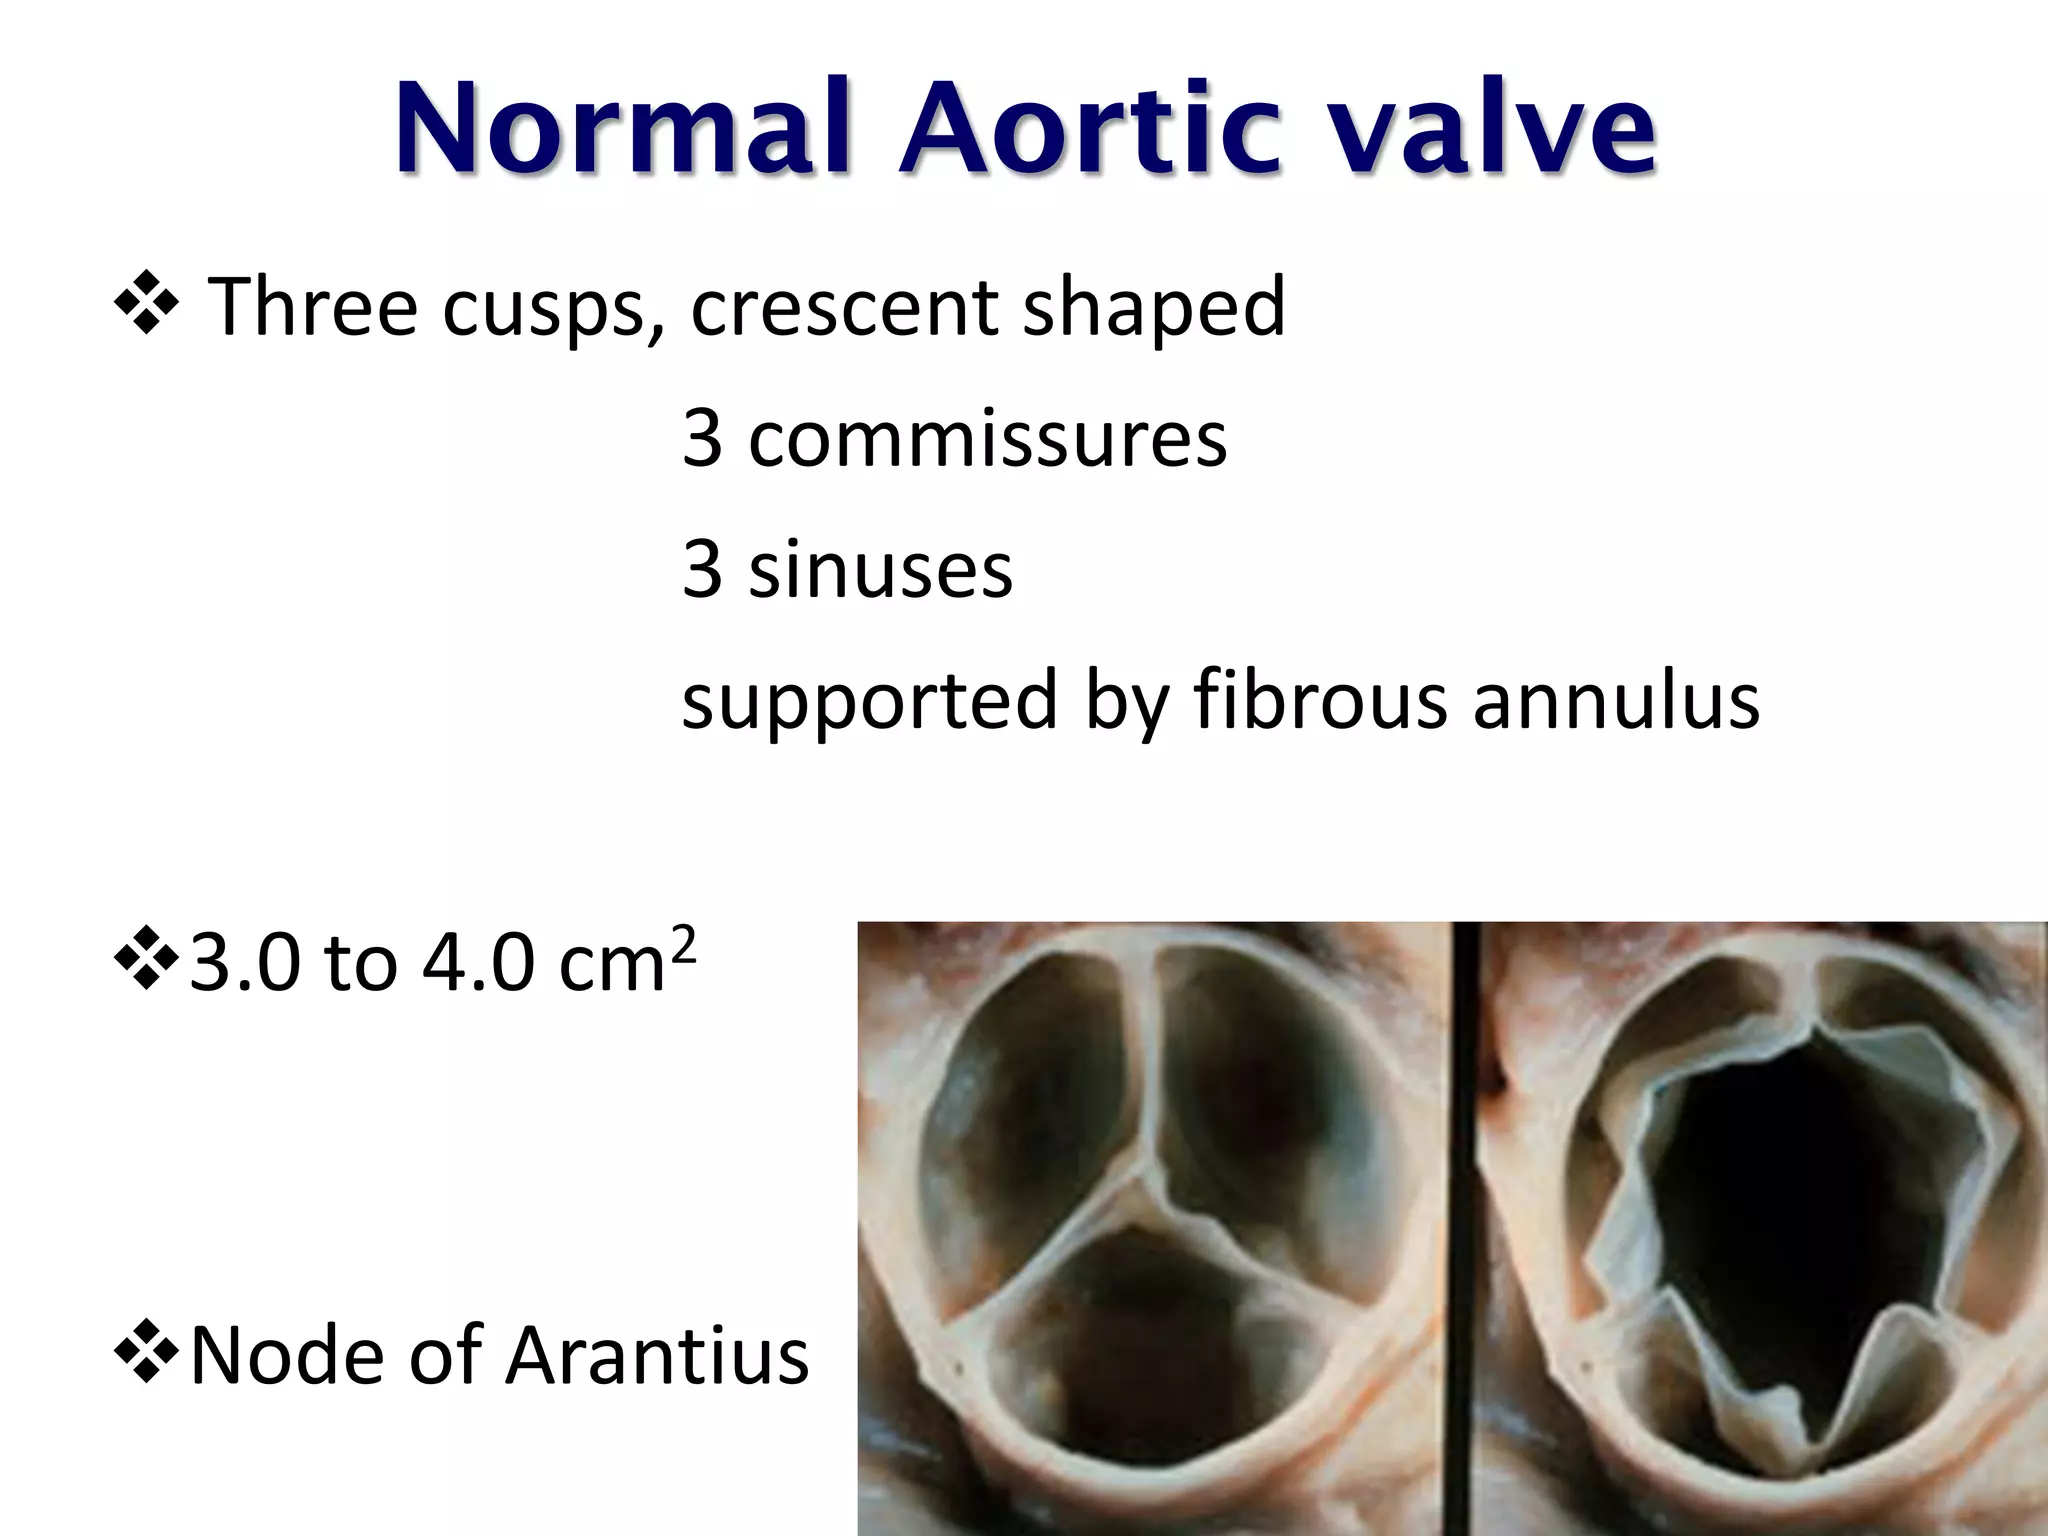
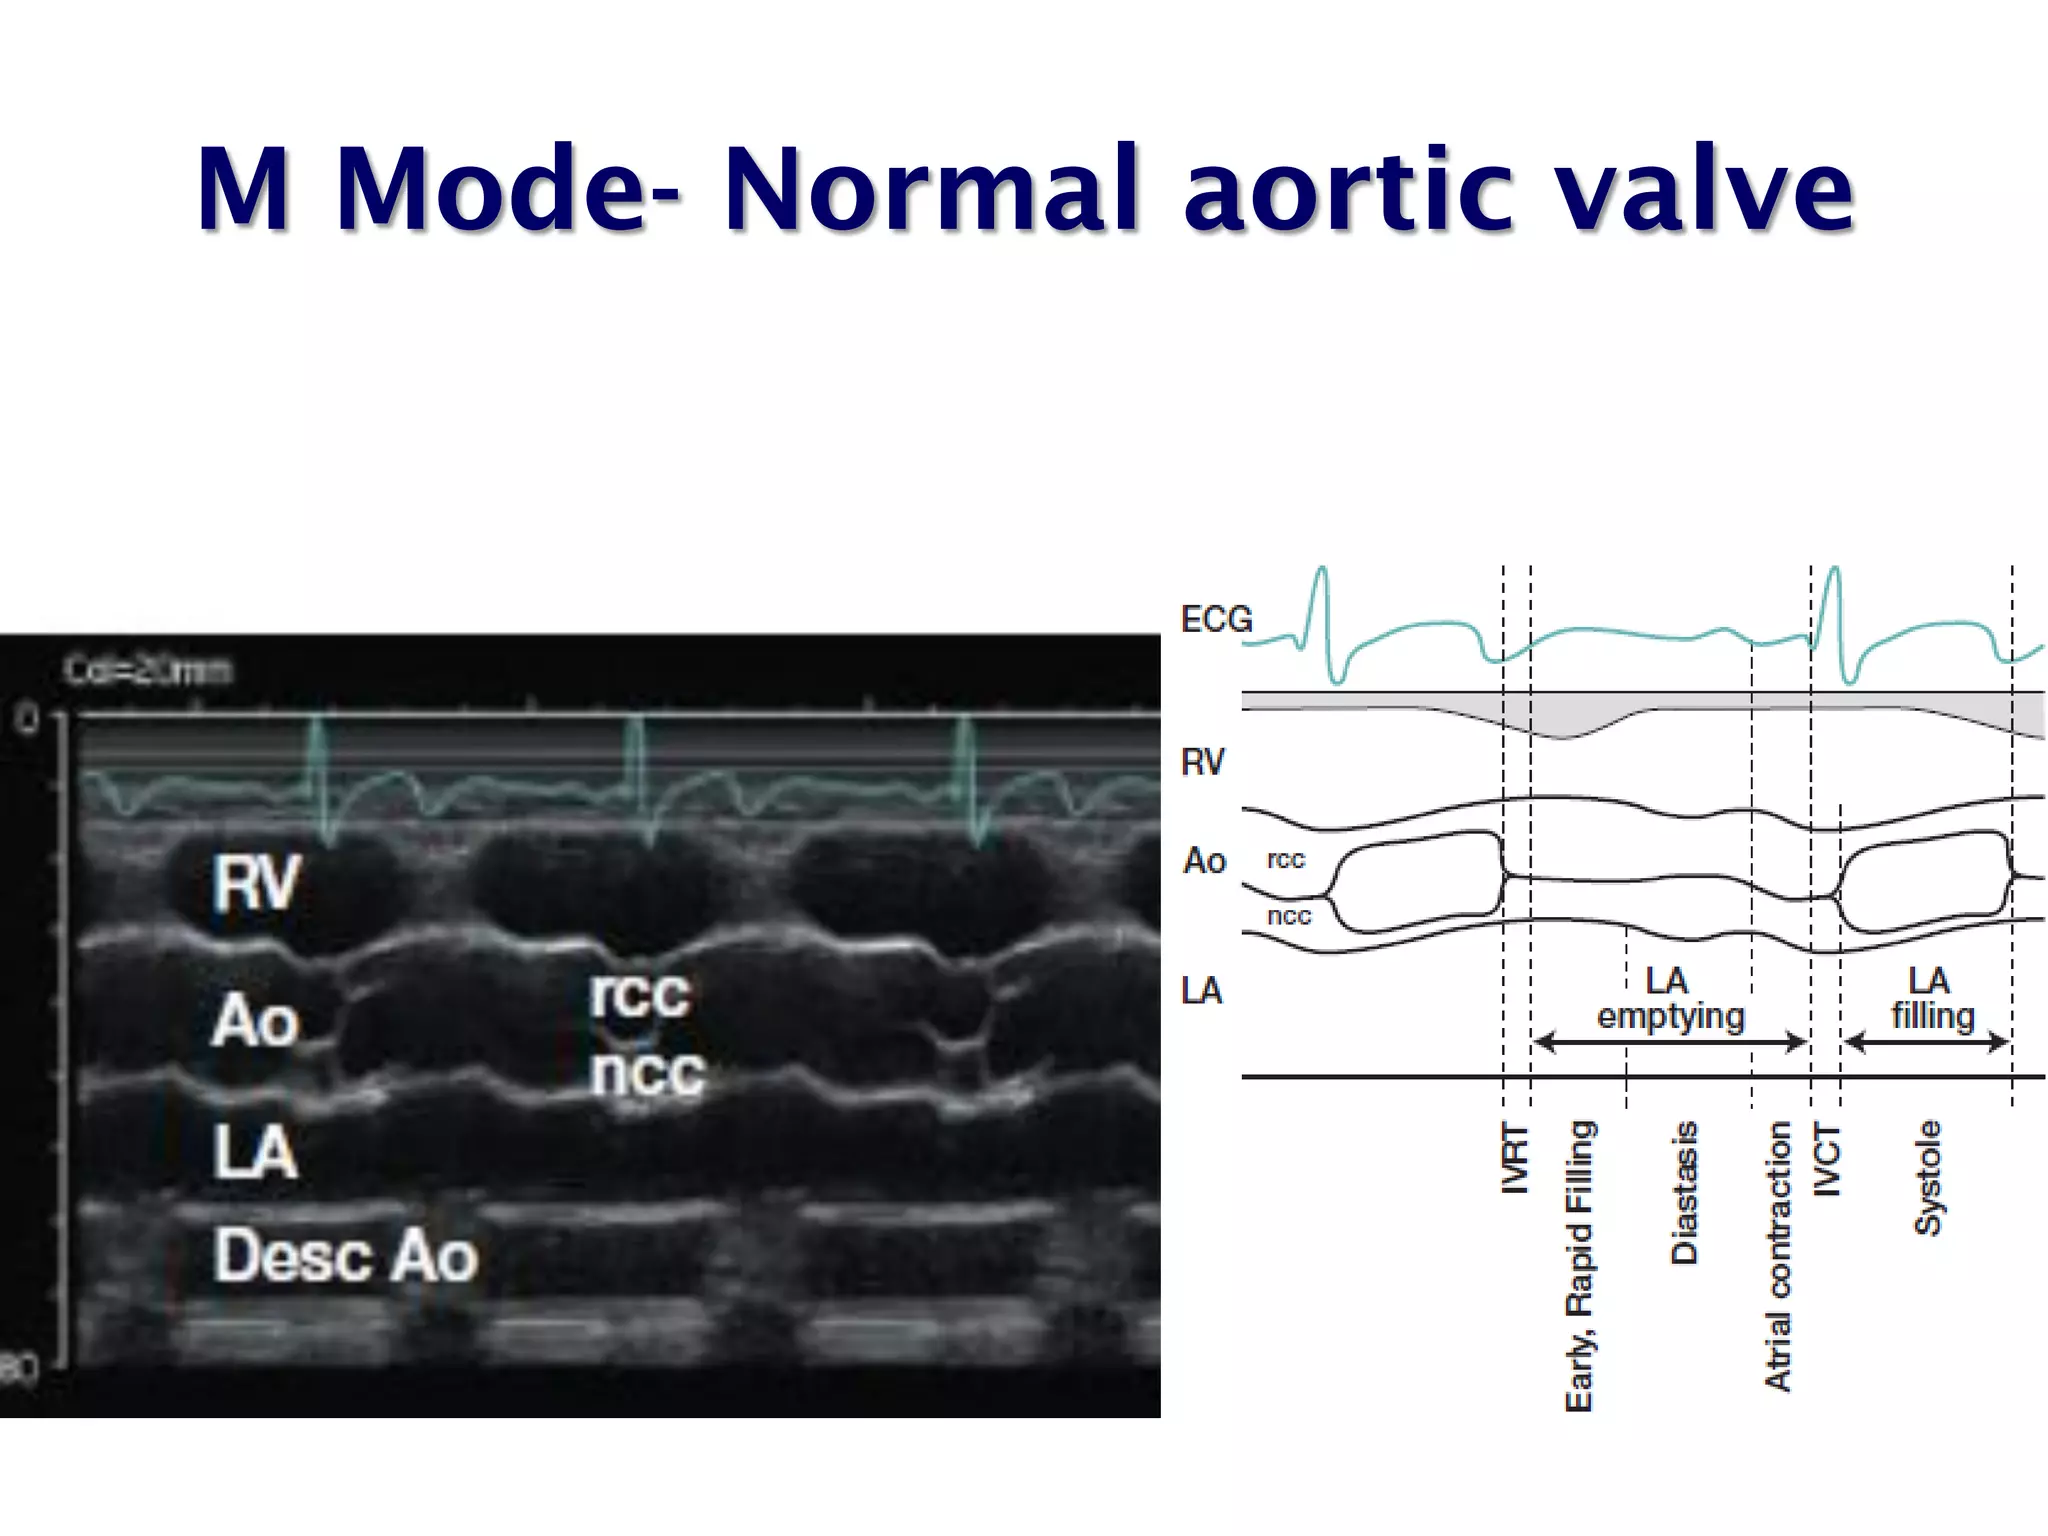
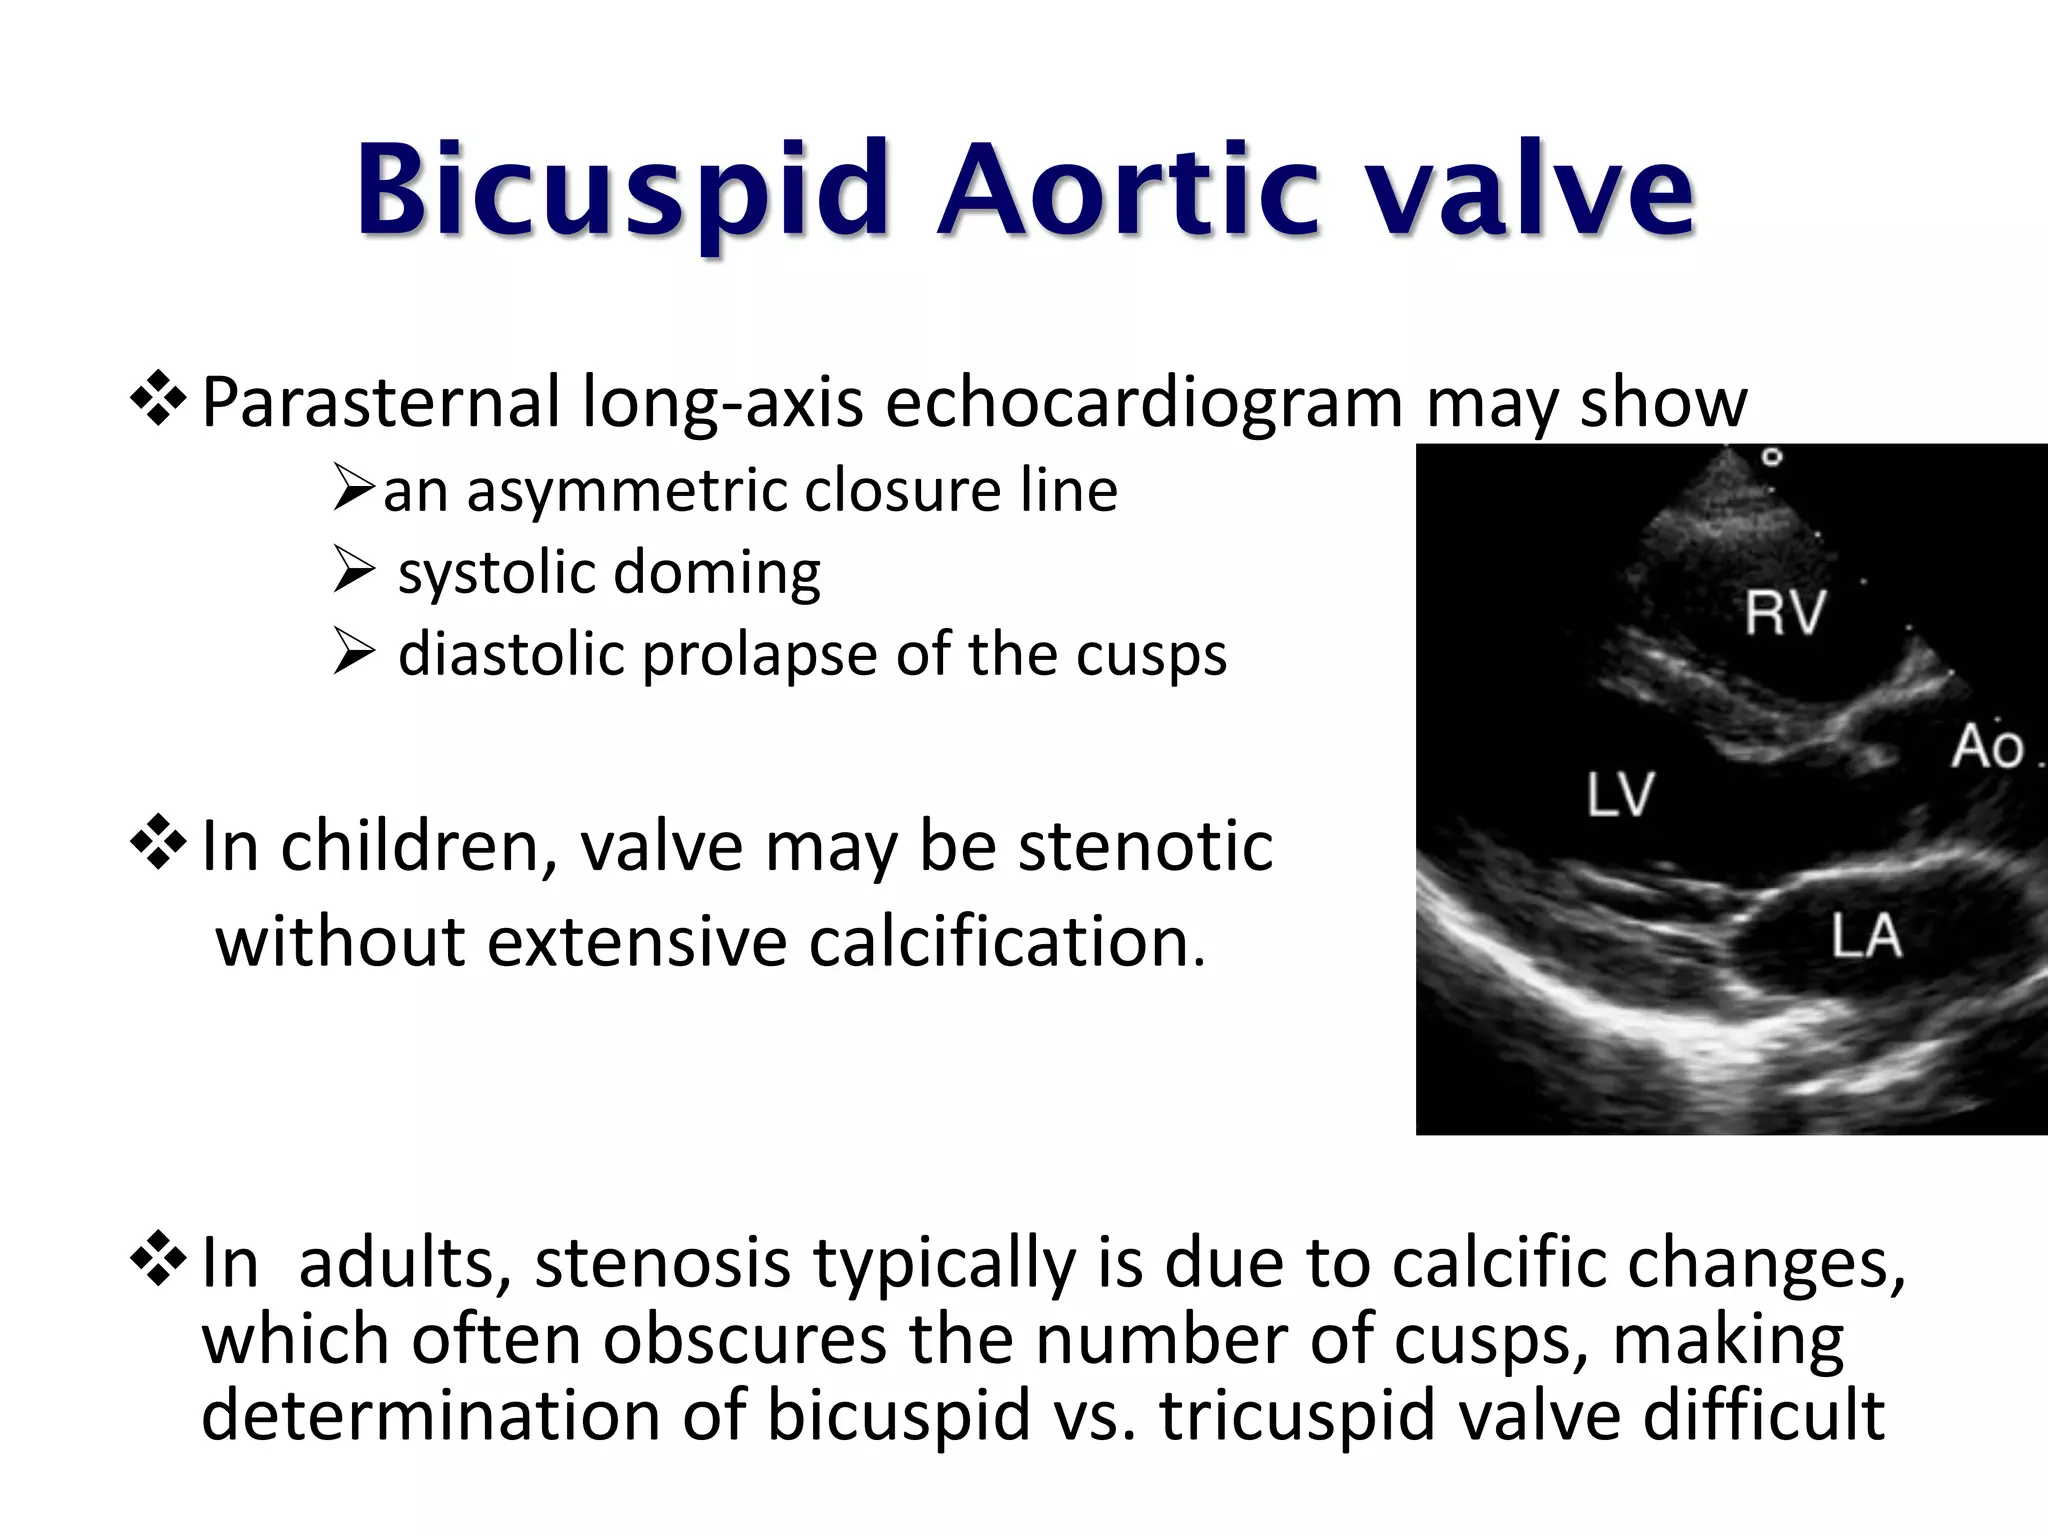
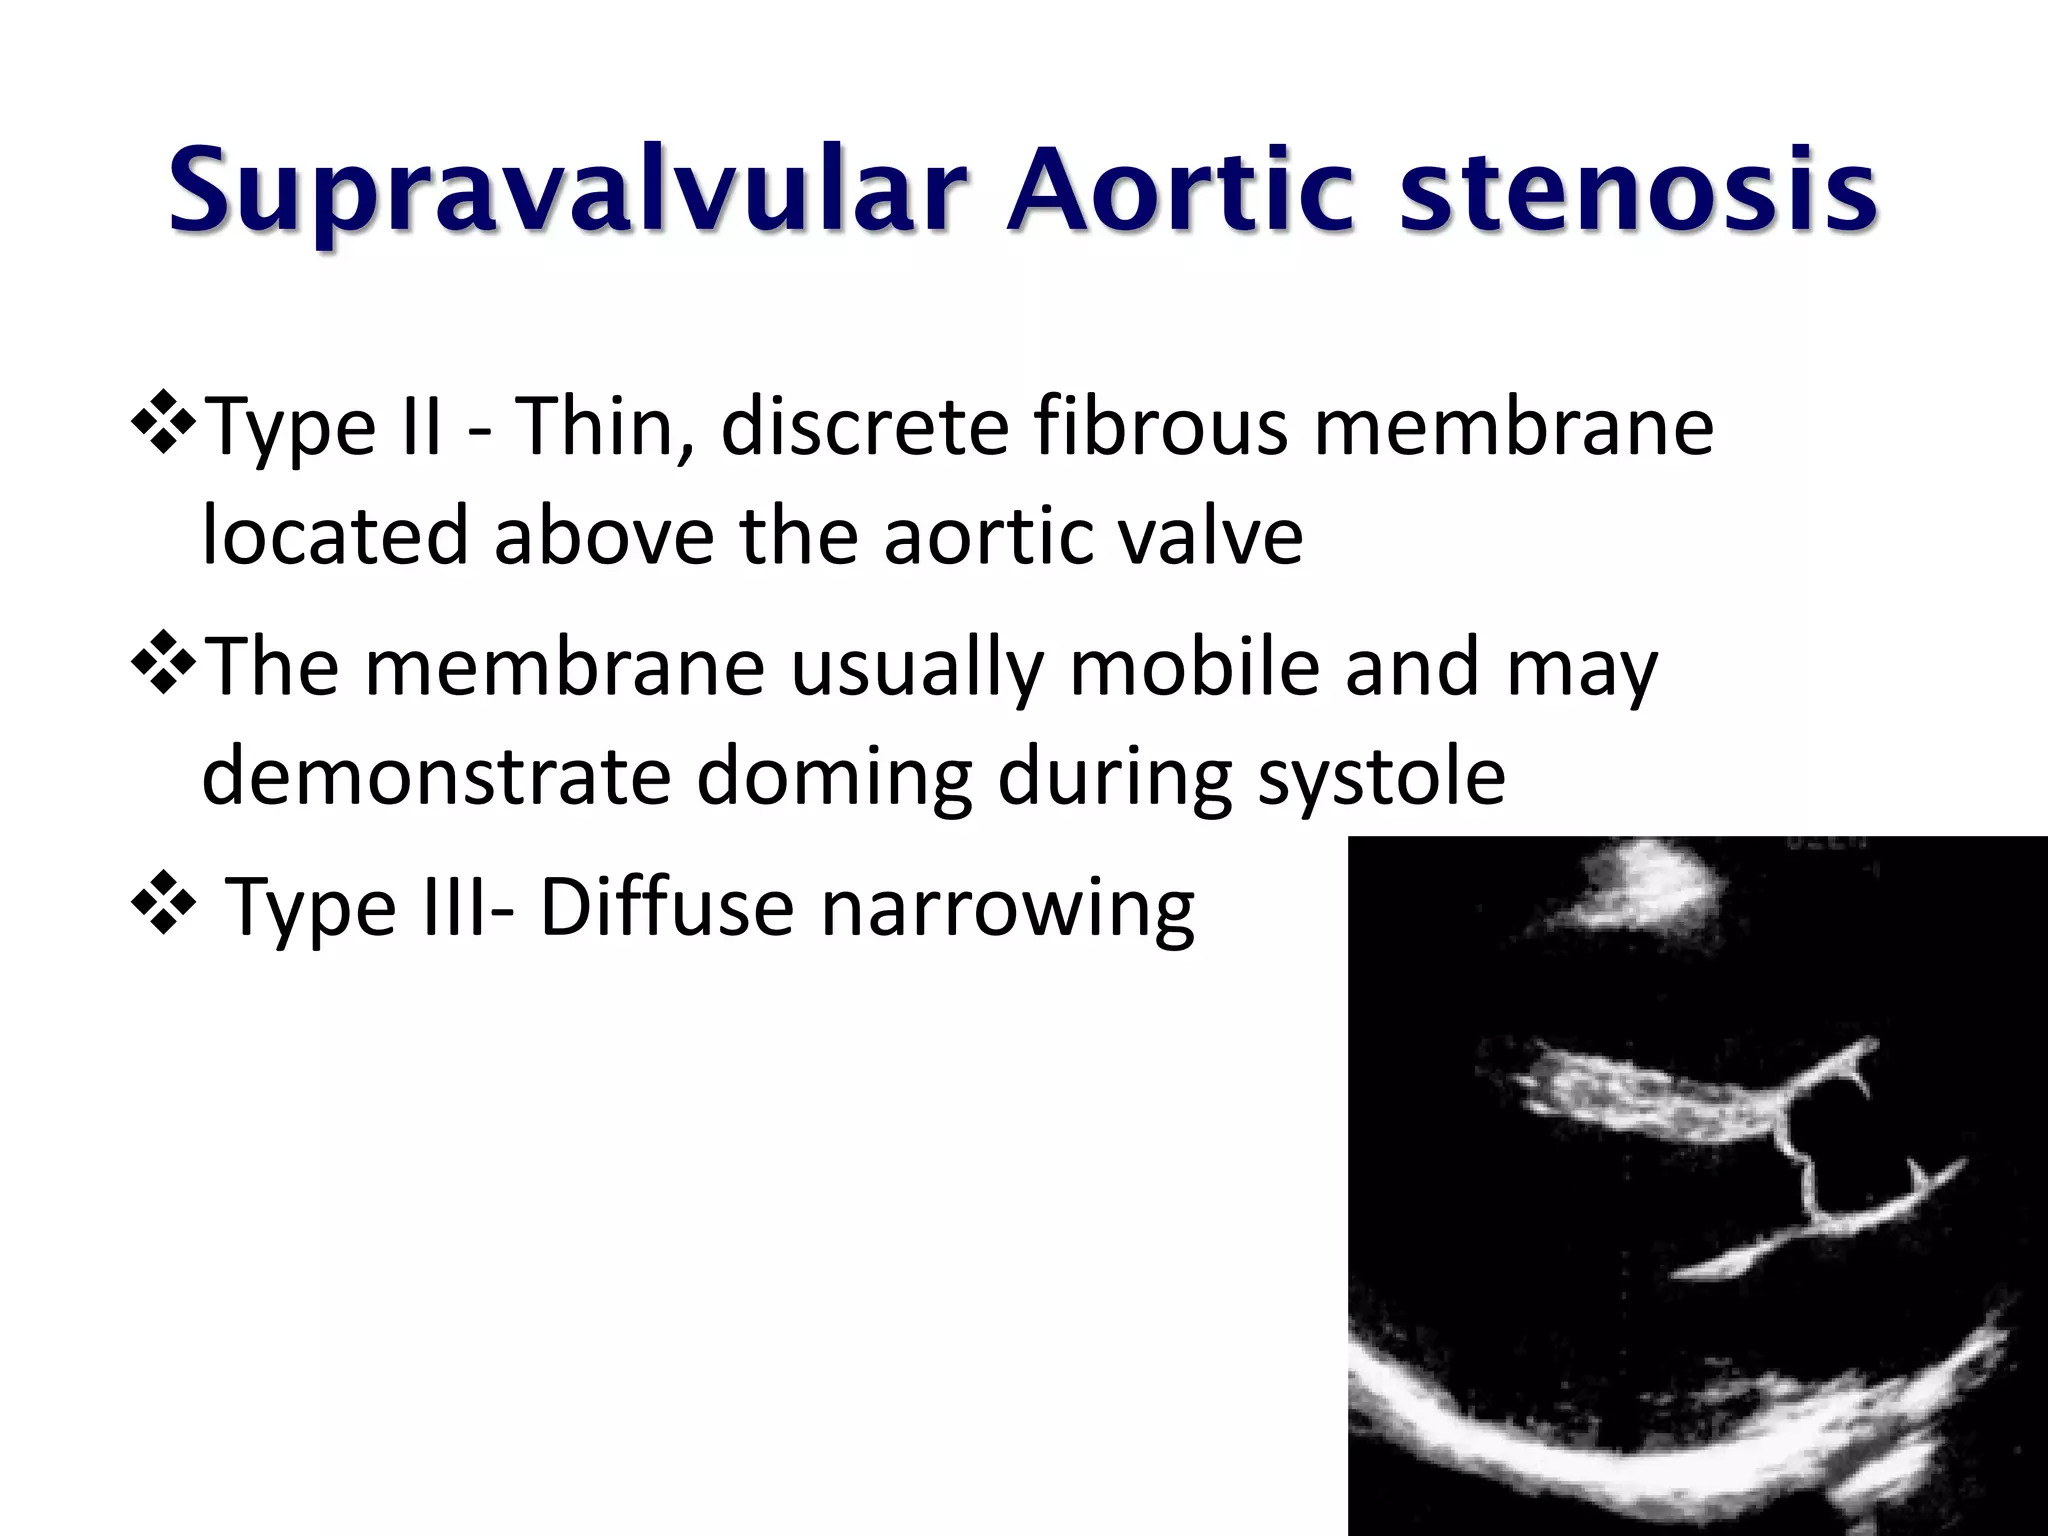
This document discusses the echocardiographic assessment of aortic valve stenosis. It begins by describing the normal aortic valve anatomy. It then discusses various 2D and Doppler echocardiographic views used to evaluate the aortic valve. The main causes of aortic stenosis and their anatomical presentations are described. The key Doppler parameters used to assess stenosis severity are peak aortic jet velocity, mean pressure gradient, and aortic valve area calculated using the continuity equation. Stress echocardiography with dobutamine is discussed for assessing patients with low-flow, low-gradient aortic stenosis. The limitations of echocardiography in evaluating aortic stenosis are also reviewed.
Echo assesment of Aortic Stenosis and Regurgitationdrpraveen1986
A simple ppt presentation on echo assesment of AS and AR. Don forget to leave a comment if u find this ppt useful. - Dr. Praveen Babu, Vijaya HOspital, Chennai
Echo assesment of Aortic Stenosis and Regurgitationdrpraveen1986
A simple ppt presentation on echo assesment of AS and AR. Don forget to leave a comment if u find this ppt useful. - Dr. Praveen Babu, Vijaya HOspital, Chennai
preop TEE assessment of atrial septal defect is very important for making decision for device closure, properly assessed adequate rims of ASD will reduce risk of device embolization to almost nil.
Tom Selleck Health: A Comprehensive Look at the Iconic Actor’s Wellness Journeygreendigital
Tom Selleck, an enduring figure in Hollywood. has captivated audiences for decades with his rugged charm, iconic moustache. and memorable roles in television and film. From his breakout role as Thomas Magnum in Magnum P.I. to his current portrayal of Frank Reagan in Blue Bloods. Selleck's career has spanned over 50 years. But beyond his professional achievements. fans have often been curious about Tom Selleck Health. especially as he has aged in the public eye.
Follow us on: Pinterest
Introduction
Many have been interested in Tom Selleck health. not only because of his enduring presence on screen but also because of the challenges. and lifestyle choices he has faced and made over the years. This article delves into the various aspects of Tom Selleck health. exploring his fitness regimen, diet, mental health. and the challenges he has encountered as he ages. We'll look at how he maintains his well-being. the health issues he has faced, and his approach to ageing .
Early Life and Career
Childhood and Athletic Beginnings
Tom Selleck was born on January 29, 1945, in Detroit, Michigan, and grew up in Sherman Oaks, California. From an early age, he was involved in sports, particularly basketball. which played a significant role in his physical development. His athletic pursuits continued into college. where he attended the University of Southern California (USC) on a basketball scholarship. This early involvement in sports laid a strong foundation for his physical health and disciplined lifestyle.
Transition to Acting
Selleck's transition from an athlete to an actor came with its physical demands. His first significant role in "Magnum P.I." required him to perform various stunts and maintain a fit appearance. This role, which he played from 1980 to 1988. necessitated a rigorous fitness routine to meet the show's demands. setting the stage for his long-term commitment to health and wellness.
Fitness Regimen
Workout Routine
Tom Selleck health and fitness regimen has evolved. adapting to his changing roles and age. During his "Magnum, P.I." days. Selleck's workouts were intense and focused on building and maintaining muscle mass. His routine included weightlifting, cardiovascular exercises. and specific training for the stunts he performed on the show.
Selleck adjusted his fitness routine as he aged to suit his body's needs. Today, his workouts focus on maintaining flexibility, strength, and cardiovascular health. He incorporates low-impact exercises such as swimming, walking, and light weightlifting. This balanced approach helps him stay fit without putting undue strain on his joints and muscles.
Importance of Flexibility and Mobility
In recent years, Selleck has emphasized the importance of flexibility and mobility in his fitness regimen. Understanding the natural decline in muscle mass and joint flexibility with age. he includes stretching and yoga in his routine. These practices help prevent injuries, improve posture, and maintain mobilit
NVBDCP.pptx Nation vector borne disease control programSapna Thakur
NVBDCP was launched in 2003-2004 . Vector-Borne Disease: Disease that results from an infection transmitted to humans and other animals by blood-feeding arthropods, such as mosquitoes, ticks, and fleas. Examples of vector-borne diseases include Dengue fever, West Nile Virus, Lyme disease, and malaria.
These lecture slides, by Dr Sidra Arshad, offer a quick overview of physiological basis of a normal electrocardiogram.
Learning objectives:
1. Define an electrocardiogram (ECG) and electrocardiography
2. Describe how dipoles generated by the heart produce the waveforms of the ECG
3. Describe the components of a normal electrocardiogram of a typical bipolar leads (limb II)
4. Differentiate between intervals and segments
5. Enlist some common indications for obtaining an ECG
Study Resources:
1. Chapter 11, Guyton and Hall Textbook of Medical Physiology, 14th edition
2. Chapter 9, Human Physiology - From Cells to Systems, Lauralee Sherwood, 9th edition
3. Chapter 29, Ganong’s Review of Medical Physiology, 26th edition
4. Electrocardiogram, StatPearls - https://www.ncbi.nlm.nih.gov/books/NBK549803/
5. ECG in Medical Practice by ABM Abdullah, 4th edition
6. ECG Basics, http://www.nataliescasebook.com/tag/e-c-g-basics
Title: Sense of Smell
Presenter: Dr. Faiza, Assistant Professor of Physiology
Qualifications:
MBBS (Best Graduate, AIMC Lahore)
FCPS Physiology
ICMT, CHPE, DHPE (STMU)
MPH (GC University, Faisalabad)
MBA (Virtual University of Pakistan)
Learning Objectives:
Describe the primary categories of smells and the concept of odor blindness.
Explain the structure and location of the olfactory membrane and mucosa, including the types and roles of cells involved in olfaction.
Describe the pathway and mechanisms of olfactory signal transmission from the olfactory receptors to the brain.
Illustrate the biochemical cascade triggered by odorant binding to olfactory receptors, including the role of G-proteins and second messengers in generating an action potential.
Identify different types of olfactory disorders such as anosmia, hyposmia, hyperosmia, and dysosmia, including their potential causes.
Key Topics:
Olfactory Genes:
3% of the human genome accounts for olfactory genes.
400 genes for odorant receptors.
Olfactory Membrane:
Located in the superior part of the nasal cavity.
Medially: Folds downward along the superior septum.
Laterally: Folds over the superior turbinate and upper surface of the middle turbinate.
Total surface area: 5-10 square centimeters.
Olfactory Mucosa:
Olfactory Cells: Bipolar nerve cells derived from the CNS (100 million), with 4-25 olfactory cilia per cell.
Sustentacular Cells: Produce mucus and maintain ionic and molecular environment.
Basal Cells: Replace worn-out olfactory cells with an average lifespan of 1-2 months.
Bowman’s Gland: Secretes mucus.
Stimulation of Olfactory Cells:
Odorant dissolves in mucus and attaches to receptors on olfactory cilia.
Involves a cascade effect through G-proteins and second messengers, leading to depolarization and action potential generation in the olfactory nerve.
Quality of a Good Odorant:
Small (3-20 Carbon atoms), volatile, water-soluble, and lipid-soluble.
Facilitated by odorant-binding proteins in mucus.
Membrane Potential and Action Potential:
Resting membrane potential: -55mV.
Action potential frequency in the olfactory nerve increases with odorant strength.
Adaptation Towards the Sense of Smell:
Rapid adaptation within the first second, with further slow adaptation.
Psychological adaptation greater than receptor adaptation, involving feedback inhibition from the central nervous system.
Primary Sensations of Smell:
Camphoraceous, Musky, Floral, Pepperminty, Ethereal, Pungent, Putrid.
Odor Detection Threshold:
Examples: Hydrogen sulfide (0.0005 ppm), Methyl-mercaptan (0.002 ppm).
Some toxic substances are odorless at lethal concentrations.
Characteristics of Smell:
Odor blindness for single substances due to lack of appropriate receptor protein.
Behavioral and emotional influences of smell.
Transmission of Olfactory Signals:
From olfactory cells to glomeruli in the olfactory bulb, involving lateral inhibition.
Primitive, less old, and new olfactory systems with different path
Pulmonary Thromboembolism - etilogy, types, medical- Surgical and nursing man...VarunMahajani
Disruption of blood supply to lung alveoli due to blockage of one or more pulmonary blood vessels is called as Pulmonary thromboembolism. In this presentation we will discuss its causes, types and its management in depth.
Recomendações da OMS sobre cuidados maternos e neonatais para uma experiência pós-natal positiva.
Em consonância com os ODS – Objetivos do Desenvolvimento Sustentável e a Estratégia Global para a Saúde das Mulheres, Crianças e Adolescentes, e aplicando uma abordagem baseada nos direitos humanos, os esforços de cuidados pós-natais devem expandir-se para além da cobertura e da simples sobrevivência, de modo a incluir cuidados de qualidade.
Estas diretrizes visam melhorar a qualidade dos cuidados pós-natais essenciais e de rotina prestados às mulheres e aos recém-nascidos, com o objetivo final de melhorar a saúde e o bem-estar materno e neonatal.
Uma “experiência pós-natal positiva” é um resultado importante para todas as mulheres que dão à luz e para os seus recém-nascidos, estabelecendo as bases para a melhoria da saúde e do bem-estar a curto e longo prazo. Uma experiência pós-natal positiva é definida como aquela em que as mulheres, pessoas que gestam, os recém-nascidos, os casais, os pais, os cuidadores e as famílias recebem informação consistente, garantia e apoio de profissionais de saúde motivados; e onde um sistema de saúde flexível e com recursos reconheça as necessidades das mulheres e dos bebês e respeite o seu contexto cultural.
Estas diretrizes consolidadas apresentam algumas recomendações novas e já bem fundamentadas sobre cuidados pós-natais de rotina para mulheres e neonatos que recebem cuidados no pós-parto em unidades de saúde ou na comunidade, independentemente dos recursos disponíveis.
É fornecido um conjunto abrangente de recomendações para cuidados durante o período puerperal, com ênfase nos cuidados essenciais que todas as mulheres e recém-nascidos devem receber, e com a devida atenção à qualidade dos cuidados; isto é, a entrega e a experiência do cuidado recebido. Estas diretrizes atualizam e ampliam as recomendações da OMS de 2014 sobre cuidados pós-natais da mãe e do recém-nascido e complementam as atuais diretrizes da OMS sobre a gestão de complicações pós-natais.
O estabelecimento da amamentação e o manejo das principais intercorrências é contemplada.
Recomendamos muito.
Vamos discutir essas recomendações no nosso curso de pós-graduação em Aleitamento no Instituto Ciclos.
Esta publicação só está disponível em inglês até o momento.
Prof. Marcus Renato de Carvalho
www.agostodourado.com
Lung Cancer: Artificial Intelligence, Synergetics, Complex System Analysis, S...Oleg Kshivets
RESULTS: Overall life span (LS) was 2252.1±1742.5 days and cumulative 5-year survival (5YS) reached 73.2%, 10 years – 64.8%, 20 years – 42.5%. 513 LCP lived more than 5 years (LS=3124.6±1525.6 days), 148 LCP – more than 10 years (LS=5054.4±1504.1 days).199 LCP died because of LC (LS=562.7±374.5 days). 5YS of LCP after bi/lobectomies was significantly superior in comparison with LCP after pneumonectomies (78.1% vs.63.7%, P=0.00001 by log-rank test). AT significantly improved 5YS (66.3% vs. 34.8%) (P=0.00000 by log-rank test) only for LCP with N1-2. Cox modeling displayed that 5YS of LCP significantly depended on: phase transition (PT) early-invasive LC in terms of synergetics, PT N0—N12, cell ratio factors (ratio between cancer cells- CC and blood cells subpopulations), G1-3, histology, glucose, AT, blood cell circuit, prothrombin index, heparin tolerance, recalcification time (P=0.000-0.038). Neural networks, genetic algorithm selection and bootstrap simulation revealed relationships between 5YS and PT early-invasive LC (rank=1), PT N0—N12 (rank=2), thrombocytes/CC (3), erythrocytes/CC (4), eosinophils/CC (5), healthy cells/CC (6), lymphocytes/CC (7), segmented neutrophils/CC (8), stick neutrophils/CC (9), monocytes/CC (10); leucocytes/CC (11). Correct prediction of 5YS was 100% by neural networks computing (area under ROC curve=1.0; error=0.0).
CONCLUSIONS: 5YS of LCP after radical procedures significantly depended on: 1) PT early-invasive cancer; 2) PT N0--N12; 3) cell ratio factors; 4) blood cell circuit; 5) biochemical factors; 6) hemostasis system; 7) AT; 8) LC characteristics; 9) LC cell dynamics; 10) surgery type: lobectomy/pneumonectomy; 11) anthropometric data. Optimal diagnosis and treatment strategies for LC are: 1) screening and early detection of LC; 2) availability of experienced thoracic surgeons because of complexity of radical procedures; 3) aggressive en block surgery and adequate lymph node dissection for completeness; 4) precise prediction; 5) adjuvant chemoimmunoradiotherapy for LCP with unfavorable prognosis.
ARTIFICIAL INTELLIGENCE IN HEALTHCARE.pdfAnujkumaranit
Artificial intelligence (AI) refers to the simulation of human intelligence processes by machines, especially computer systems. It encompasses tasks such as learning, reasoning, problem-solving, perception, and language understanding. AI technologies are revolutionizing various fields, from healthcare to finance, by enabling machines to perform tasks that typically require human intelligence.
Report Back from SGO 2024: What’s the Latest in Cervical Cancer?bkling
Are you curious about what’s new in cervical cancer research or unsure what the findings mean? Join Dr. Emily Ko, a gynecologic oncologist at Penn Medicine, to learn about the latest updates from the Society of Gynecologic Oncology (SGO) 2024 Annual Meeting on Women’s Cancer. Dr. Ko will discuss what the research presented at the conference means for you and answer your questions about the new developments.
Acute scrotum is a general term referring to an emergency condition affecting the contents or the wall of the scrotum.
There are a number of conditions that present acutely, predominantly with pain and/or swelling
A careful and detailed history and examination, and in some cases, investigations allow differentiation between these diagnoses. A prompt diagnosis is essential as the patient may require urgent surgical intervention
Testicular torsion refers to twisting of the spermatic cord, causing ischaemia of the testicle.
Testicular torsion results from inadequate fixation of the testis to the tunica vaginalis producing ischemia from reduced arterial inflow and venous outflow obstruction.
The prevalence of testicular torsion in adult patients hospitalized with acute scrotal pain is approximately 25 to 50 percent
9. Aortic stenosis- Causes
Most common :-
Bicuspid aortic valve with calcification
Senile or Degenerative calcific AS
Rheumatic AS
Less common:-
Congenital
Type 2 Hyperlipoproteinemia
Onchronosis
10. Anatomic evaluation
Combination of short and long axis images to
identify
Number of leaflets
Describe leaf mobility, thickness, calcification
Combination of imaging and doppler allows
the determination of the level of obstruction;
subvalvular, valvular, or supravalvular.
Transesophageal echocardiography may be
helpful when image quality is suboptimal.
11. Calcific Aortic Stenosis
Nodular calcific masses on aortic side of cusps
No commissural fusion
Free edges of cusps are not involved
stellate-shaped systolic orifice
13. Calcific Aortic Stenosis
Parasternal short-axis
view showing calcified
aortic valve leaflets.
Immobility of the cusps
results in only a slit like
aortic valve orifice in
systole
14. Bicuspid Aortic valve
Fusion of the right and left coronary cusps (80%)
Fusion of the right and non-coronary cusps(20%)
Schaefer BM et al. Am J Cardiol 2007;99:686–90
Schaefer BM et al.Heart 2008;94:1634–1638.
15. Bicuspid Aortic valve
Two cusps are seen in systole with only two
commissures framing an elliptical systolic
orifice(the fish mouth appearance).
Diastolic images may mimic a tricuspid valve
when a raphe is present.
16. Bicuspid Aortic valve
Parasternal long-axis echocardiogram may show
an asymmetric closure line
systolic doming
diastolic prolapse of the cusps
In children, valve may be stenotic
without extensive calcification.
In adults, stenosis typically is due to calcific changes,
which often obscures the number of cusps, making
determination of bicuspid vs. tricuspid valve difficult
17. Calcific Aortic Stenosis
Calcification of a bicuspid or tricuspid valve, the severity
can be graded semi-quantitatively as
0 1+ 2+ 3+ 4+
Schaefer BM et al.Heart 2008;94:1634–1638.
The degree of valve calcification is a predictor of clinical
outcome. Rosenhek R et al. N Engl J Med 2000;343:611–7.
19. Rheumatic aortic stenosis
Characterized by
Commissural fusion
Triangular systolic orifice
thickening & calcification
Accompanied by rheumatic mitral valve
changes.
20. Rheumatic aortic stenosis
Parasternal short axis view showing commissural
fusion, leaflet thickening and calcification, small
triangular systolic orifice
21. Subvalvular aortic stenosis
(1) Thin discrete membrane consisting of
endocardial fold and fibrous tissue
(2) A fibromuscular ridge
(3) Diffuse tunnel-like narrowing of the LVOT
(4) accessory or anomalous mitral valve tissue.
22. Supravalvular Aortic stenosis
Type I - Thick, fibrous ring above the aortic
valve with less mobility and has the easily
identifiable 'hourglass' appearance of the aorta.
23. Supravalvular Aortic stenosis
Type II - Thin, discrete fibrous membrane
located above the aortic valve
The membrane usually mobile and may
demonstrate doming during systole
Type III- Diffuse narrowing
25. Doppler assessment of AS
The primary haemodynamic parameters
recommended (EAE/ASE Recommendations for
Clinical Practice 2008)
Peak transvalvular velocity
Mean transvalvular gradient
Valve area by continuity equation.
26. Peak transvalvular velocity
Continuous-wave Doppler ultrasound
Multiple acoustic windows
Apical and suprasternal or right parasternal
most frequently yield the highest velocity
rarely subcostal or supraclavicular windows
may be required
Three or more beats are averaged in sinus
rhythm, with irregular rhythms at least 5
consecutive beats
27. Peak transvalvular velocity
AS jet velocity is defined as the highest velocity signal
obtained from any window after a careful examination
Any deviation from a parallel intercept angle results in
velocity underestimation
The degree of underestimation is 5% or less if the
intercept angle is within 15⁰ of parallel.
‘Angle correction’ should not be used because it is likely
to introduce more error given the unpredictable jet
direction.
28. Peak transvalvular velocity
The velocity scale adjusted so the spectral doppler signal
fills on the vertical axis, and with a time scale on the x-axis
of 100 mm/s
Wall filters are set at a high level and gain is decreased to
optimize identification of the velocity curve.
Grey scale is used
A smooth velocity curve with a dense outer edge and clear
maximum velocity should be recorded
29. Peak transvalvular velocity
The shape of the CW Doppler velocity curve is helpful
in distinguishing the level and severity of obstruction.
With severe obstruction, maximum
velocity occurs later in systole and the
curve is more rounded in shape
With mild obstruction, the peak
is in early systole with a triangular
shape of the velocity curve
30. Peak transvalvular velocity
The shape of the CWD velocity curve also can be
helpful in determining whether the obstruction is
fixed or dynamic
Dynamic sub aortic obstruction
shows a characteristic late-
peaking velocity curve, often with
a concave upward curve in
early systole
31. Mean transvalvular gradient
The difference in pressure between the left
ventricle and aorta in systole
Gradients are calculated from velocity
information
The relationship between peak and mean
gradient depends on the shape of the velocity
curve.
32. Mean transvalvular gradient
Bernoulli equations
ΔP =4v²
The maximum gradient is calculated from
maximum velocity
ΔP max =4v² max
The mean gradient is calculated by averaging
the instantaneous gradients over the ejection
period
33. Mean transvalvular gradient
The simplified Bernoulli equation assumes
that the proximal velocity can be ignored
When the proximal velocity is over 1.5 m/s or
the aortic velocity is ,3.0 m/s, the proximal
velocity should be included in the Bernoulli
equation ΔP max =4 (v² max- v2proximal)
34. Sources of error for pressure
gradient calculations
Malalignment of jet and ultrasound beam.
Recording of MR jet
35. Sources of error for pressure
gradient calculations
Neglect of an elevated proximal velocity.
Any underestimation of aortic velocity results in
an even greater underestimation in gradients,
due to the squared relationship between velocity
and pressure difference
The accuracy of the Bernoulli equation to
quantify AS pressure gradients is well established
36. Pressure recovery
The conversion of potential energy to kinetic
energy across a narrowed valve results in a
high velocity and a drop in pressure.
Distal to the orifice, flow decelerates again.
Kinetic energy will be reconverted into
potential energy with a corresponding
increase in pressure, the so-called PR
37. Pressure recovery
Pressure recovery is greatest in stenosis with
gradual distal widening
Aortic stenosis with its abrupt widening from
the small orifice to the larger aorta has an
unfavorable geometry for pressure recovery
PR= 4v²× 2EOA/AoA (1-EOA/AoA)
38. Comparing pressure gradients calculated from
doppler velocities to pressures measured at
cardiac catheterization.
39. Comparing pressure gradients calculated from
doppler velocities to pressures measured at
cardiac catheterization.
Currie PJ et al. Circulation 1985;71:1162-1169
41. Aortic valve area
Aortic valve area
Continuity equation concept that the stroke
volume ejected through the LV outflow tract all
passes through the stenotic orifice
AVA= CSA LVOT×VTILVOT / VTIAV
Calculation of continuity-equation valve area
requires three measurements
AS jet velocity by CWD
LVOT diameter for calculation of a circular CSA
LVOT velocity recorded with pulsed Doppler.
42. Aortic valve area
Continuity equation
LVOT diameter and velocity should be measured at the
same distance from the aortic valve.
When the PW sample volume is optimally positioned,
the recording shows a smooth velocity curve with a
well-defined peak.
43. Aortic valve area
Continuity equation
The VTI is measured by tracing the dense modal
velocity throughout systole
LVOT diameter is measured from the inner edge to
inner edge of the septal endocardium, and the
anterior mitral leaflet in mid-systole
44. Aortic valve area-Continuity equation
Level of Evidence
Well validated - clinical & experimental studies.
Zoghbi WA et al. Circulation 1986;73:452-9.
Oh JK et al. J Am Coll Cardiol 1988;11:1227-34.
Measures the effective valve area, the weight
of the evidence now supports the concept that
effective, not anatomic, orifice area is the
primary predictor of clinical outcome.
Baumgartner et al. J Am Society Echo 2009; 22,1 , 1-23.
45. Limitations of continuity-
equation valve area
Intra- and interobserver variability
AS jet and LVOT velocity 3 to4%.
LVOT diameter 5% to 8%.
When sub aortic flow velocities are abnormal
SV calculation at this site are not accurate
Sample volume placement near to septum or
anterior mitral leaflet
46. Limitations of continuity-
equation valve area
Observed changes in valve area with changes
in flow rate
AS and normal LV function, the effects of flow
rate are minimal
This effect may be significant in presence
concurrent LV dysfunction.
47. Left ventricular systolic
dysfunction
Low-flow low-gradient AS includes the
following conditions:
Effective orifice area < 1.0 Cm2
LV ejection fraction < 40%
Mean pressure gradient < 30–40 mmHg
Severe AS and severely reduced LVEF
represent 5% of AS patients
Vahanian A et al. Eur Heart J 2007;28:230–68.
48. Dobutamine stress Echo
Provides information on the changes in aortic
velocity, mean gradient, and valve area as flow rate
increases.
Measure of the contractile response to dobutamine
Helpful to differentiate two clinical situations
Severe AS causing LV systolic dysfunction
Moderate AS with another cause of LV dysfunction
49. Dobutamine stress Echo
A low dose starting at 2.5 or 5 ủg/kg/min with
an incremental increase in the infusion every 3–
5 min to a maximum dose of 10–20 ủg/kg/min
The infusion should be stopped as soon as
Positive result is obtained
Heart rate begins to rise more than 10–20 bpm
over baseline or exceeds 100bpm
50. Dobutamine stress Echo
Role in decision-making in adults with AS is
controversial and the findings recommend as
reliable are
Stress findings of severe stenosis
AVA<1cm²
Jet velocity>4m/s
Mean gradient>40mm of Hg
Nishimura RA et al. Circulation 2002;106:809-13.
Lack of contractile reserve-
Failure of LVEF to ↑ by 20% is a poor prognostic sign
Monin JL et al. Circulation 2003;108:319-24..
51. Serial measurements
During follow-up any significant changes in
results should be checked in detail:
Make sure that aortic jet velocity is recorded from
the same window with the same quality (always
report the window where highest velocities can be
recorded).
when AVA changes, look for changes in the
different components incorporated in the
equation.
LVOT size rarely changes over time in adults.
53. Simplified continuity
equation.
Based on the concept that in native aortic
valve stenosis the shape of the velocity curve
in the outflow tract and aorta is similar so that
the ratio of LVOT to aortic jet VTI is nearly
identical to the ratio of the LVOT to aortic jet
maximum velocity.
AVA= CSA LVOT×VLVOT / VAV
This method is less well accepted because
results are more variable than using VTIs in
the equation.
54. Velocity ratio
Another approach to reducing error related to
LVOT diameter measurements is removing CSA
from the simplified continuity equation.
This dimensionless velocity ratio expresses the size
of the valvular effective area as a proportion of the
CSA of the LVOT.
Velocity ratio= VLVOT/VAV
In the absence of valve stenosis, the velocity ratio
approaches 1, with smaller numbers indicating
more severe stenosis.
55. Aortic valve area -Planimetry
Planimetry may be an acceptable alternative
when Doppler estimation of flow velocities is
unreliable
Planimetry may be inaccurate when valve
calcification causes shadows or reverberations
limiting identification of the orifice
Doppler-derived mean-valve area correlated
better with maximal anatomic area than with
mean-anatomic area.
Marie Arsenault, et al. J. Am. Coll. Cardiol. 1998;32;1931-1937
57. Experimental descriptors
of stenosis severity
(Level 3 EAE/ASE Recommendations -not
recommended for routine clinical use)
58. Valve resistance
Relatively flow-independent measure of stenosis
severity
Depends on the ratio of mean pressure gradient
and mean flow rate
Resistance = (ΔPmean /Qmean) × 1333
There is a close relationship between aortic valve
resistance and valve area
The advantage over continuity equation not
established
59. Left ventricular stroke work loss
Left ventricle expends work during systole to
keep the aortic valve open and to eject blood
into the aorta
SWL(%) = (100×ΔPmean)/ ΔPmean+SBP
A cutoff value more than 25% effectively
discriminated between patients experiencing
a good and poor outcome.
Kristian Wachtell. Euro Heart J.Suppl. (2008) 10 ( E), E16–E22
60. Energy loss index
Damien Garcia.et al. Circulation. 2000;101:765-771.
Fluid energy loss across stenotic aortic valves is
influenced by factors other than the valve effective
orifice area .
An experimental model was designed to measure
EOA and energy loss in 2 fixed stenoses and 7
bioprosthetic valves for different flow rates and 2
different aortic sizes (25 and 38 mm).
EOA and energy loss is influenced by both flow rate
and AA and that the energy loss is systematically
higher (15±2%) in the large aorta.
Damien Garcia.et al. Circulation. 2000;101:765-771.
61. Energy loss index
Damien Garcia.et al. Circulation. 2000;101:765-771.
Energy loss coefficient (EOA × AA)/(AA - EOA) accurately
predicted the energy loss in all situations .
It is more closely related to the increase in left ventricular
workload than EOA.
To account for varying flow rates, the coefficient was indexed for
body surface area in a retrospective study of 138 patients with
moderate or severe aortic stenosis.
The energy loss index measured by Doppler echocardiography
was superior to the EOA in predicting the end points
An energy loss index #0.52 cm2/m2 was the best predictor of
diverse outcomes (positive predictive value of 67%).
62. Classification of AS severity
(a ESC & bAHA/ACC Guidelines)
Aortic Sclerosis Mild Moderate Severe
Aortic jet velocity (m/s) ≤ 2.5 m/s 2.6 -2.9 3.0 - 4 >4
Mean gradient (mm Hg) < 20b(<30a) 20 – 40b (30 -50a) > 40
AVA (cm²) > 1.5 1.0 - 1.5 < 1.0
Indexed AVA (cm²/m²) > 0.85 0.60 – 0.85 < 0.6
Velocity ratio > 0.50 0.25 – 0.50 < 0.25
64. Effect of concurrent conditions ……
Left ventricular systolic dysfunction
Left ventricular hypertrophy
Small ventricular cavity & small LV ejects a
small SV so that, even in severe AS the AS
velocity and mean gradient may be lower than
expected.
Continuity-equation valve area is accurate in
this situation
65. Effect of concurrent conditions contd…
Hypertension
35–45% of patients
primarily affect flow and gradients but less AVA
measurements
Control of blood pressure is recommended
The echocardiographic report should always
include a blood pressure measurement
66. Effect of concurrent conditions contd…
Aortic regurgitation
About 80% of adults with AS also have aortic
regurgitation
High transaortic volume flow rate, maximum
velocity, and mean gradient will be higher than
expected for a given valve area
In this situation, reporting accurate quantitative
data for the severity of both stenosis and
regurgitation
67. Effect of concurrent conditions contd…
Mitral valve disease
With severe MR, transaortic flow rate may be
low resulting in a low gradient .Valve area
calculations remain accurate in this setting
A high-velocity MR jet may be mistaken for the
AS jet. Timing of the signal is the most reliable
way to distinguish
68. Effect of concurrent conditions contd…
High cardiac output
Relatively high gradients in the presence of
mild or moderate AS
The shape of the CWD spectrum with a very
early peak may help to quantify the severity
correctly
Ascending aorta
Aortic root dilation
Coarctation of aorta
69. M Mode- Aortic Stenosis
Maximal aortic cusp separation (MACS)
Vertical distance between right CC and non CC
during systole
Aortic valve area MACS Measurement Predictive value
Normal AVA >2Cm2 Normal MACS >15mm 100%
AVA>1.0 > 12mm 96%
AVA< 0.75 < 8mm 97%
Gray area 8-12 mm …..
DeMaria A N et al. Circulation.Suppl II. 58:232,1978
71. M Mode- Aortic Stenosis
Limitations
Single dimension
Asymmetrical AV involvement
Calcification / thickness
↓ LV systolic function
↓ CO status
72. Approach
Valve anatomy, etiology
Exclude other LVOTO
Stenosis severity – jet velocity
mean pressure gradient
AVA – continuity equation
LV – dimensions/hypertrophy/EF/diastolic fn
Aorta- aortic diameter/ assess COA
AR – quantification if more than mild
MR- mechanism & severity
Pulmonary pressure
73.
74. MCQ -1
Which is false about Severe AS?
a) Aortic jet velocity > 4 m/s
b) Velocity ratio > 0.50
c) Indexed AVA < 0.6 cm²/m²
d) Mean gradient > 40 mm Hg
e) None of the above
75. MCQ-2
By definition Low-flow low-gradient AS
includes the following conditions except
a) Anatomic orifice area < 1.0 Cm2
b) LV ejection fraction < 40%
c) Mean pressure gradient < 30–40 mmHg
d) None
76. MCQ-3
Characteristic feature of calcific aortic stenosis
is ………….
a) Nodular calcific masses on ventricular side of
cusps
b) Calcium deposition at free edges of the cusp
c) Commissural fusion
d) None of the above
77. MCQ- 4
False about Maximal aortic cusp separation?
a) MACS of normal aortic valve is >15 mm
b) AVA <0.75 corresponds to MACS <8mm
c) Vertical distance between right CC and non CC
during systole
d) Gray area is 8-12mm
e) None of the above
78. MCQ 5
All are true about standard dobutamine stress
echocardiography for evaluation of AS severity in setting
of LV dysfunction except?
A) Uses low dose of dobutamine starting at 2.5 or 5ủg/kg/min
B) Maximum dose of dobutamine used is 10–20 ủg/kg/min
C) The infusion should be stopped when the heart rate
begins to rise more than 10–20 bpm over baseline
D) Failure of LVEF to ↑ by 40% is a poor prognostic sign
e) None of the above
79. MCQ 6
In a patient with aortic valve area of 0.6 sq
cm(not a low flow low gradient AS) continuous
wave Doppler velocity will be:
a) 1-2 m/sec
b) 2-3 m/sec
c) 3-4 m/sec
d) > 4 m/sec
80. MCQ-7
True about doppler assessment of AS is all
except ?
a) With severe obstruction, maximum velocity
occurs later in systole
b) Angle correction is likely to reduce errors in
measuring peak transvalvular gradient
a) Apical and suprasternal windows most
frequently yield the highest velocity
c) None of the above
81. MCQ-8
True a bout Bicuspid valve is?
a) Fusion of the right and non-coronary cusps occurs in
80% of cases
b) Fusion of the right and non-coronary cusps is more
commonly associated with mitral vale myxomatous
disease
c) Parasternal short axis view in diastole always
demonstrate bicuspid anatomy
d) Calcification usually occurs along the edges of cusp
82. MCQ -9
True about Supravalvular aortic stenosis is all?
a) Type 2 shows doming in systole
b) Type 3 hourglass appearance of aorta
c) Type 1is thin discrete fibrous membrane
d) Type 3 is localized disease just above aortic
valve
83. MCQ- 10
All are true except
a) accuracy of the Bernoulli equation to quantify AS
pressure gradients is well established
b) The relationship between peak and mean gradient
depends on the shape of the velocity curve.
c) Gradients are calculated from velocity information
d) Dynamic sub aortic obstruction shows a characteristic
early peaking velocity curve
e) None
84. MCQ -1
Which is false about Severe AS?
a) Aortic jet velocity > 4 m/s
b) Velocity ratio > 0.50
c) Indexed AVA < 0.6 cm²/m²
d) Mean gradient > 40 mm Hg
e) None of the above
85. MCQ-2
By definition Low-flow low-gradient AS
includes the following conditions except
a) Anatomic orifice area < 1.0 Cm2
b) LV ejection fraction < 40%
c) Mean pressure gradient < 30–40 mmHg
d) None
86. MCQ-3
Characteristic feature of calcific aortic stenosis
is ………….
a) Nodular calcific masses on ventricular side of
cusps
b) Calcium deposition at free edges of the cusp
c) Commissural fusion is common and early
d) None of the above
87. MCQ- 4
False about Maximal aortic cusp separation?
a) MACS of normal aortic valve is >15 mm
b) AVA <0.75 corresponds to MACS <8mm
c) Vertical distance between right CC and non CC
during systole
d) Gray area is 8-12mm
e) None of the above
88. MCQ 5
All are true about standard dobutamine stress
echocardiography for evaluation of AS severity in setting
of LV dysfunction except?
A) Uses low dose of dobutamine starting at 2.5 or 5ủg/kg/min
B) Maximum dose of dobutamine used is 10–20 ủg/kg/min
C) The infusion should be stopped when the heart rate
begins to rise more than 10–20 bpm over baseline
D) Failure of LVEF to ↑ by 40% is a poor prognostic sign
e) None of the above
89. MCQ 6
In a patient with aortic valve area of 0.6 sq
cm(not a low flow low gradient AS) continuous
wave Doppler velocity will be:
a) 1-2 m/sec
b) 2-3 m/sec
c) 3-4 m/sec
d) > 4 m/sec
90. MCQ-7
True about doppler assessment of AS is all
except ?
a) With severe obstruction, maximum velocity
occurs later in systole
b) Angle correction is likely to reduce errors in
measuring peak transvalvular gradient
a) Apical and suprasternal windows most
frequently yield the highest velocity
c) None of the above
91. MCQ-8
True a bout Bicuspid valve is?
a) Fusion of the right and non-coronary cusps occurs in
80% of cases
b) Fusion of the right and non-coronary cusps is more
commonly associated with mitral vale myxomatous
disease
c) Parasternal short axis view in diastole always
demonstrate bicuspid anatomy
d) Calcification usually starts along the edges of cusp
92. MCQ -9
True about Supravalvular aortic stenosis is all?
a) Type 2 shows doming in systole
b) Type 3 shows hourglass appearance of aorta
c) Type 1 is thin discrete fibrous membrane
d) Type 3 is localized disease just above aortic
valve
93. MCQ- 10
All are true except
a) accuracy of the Bernoulli equation to quantify AS
pressure gradients is well established
b) The relationship between peak and mean gradient
depends on the shape of the velocity curve.
c) Gradients are calculated from velocity information
d) Dynamic sub aortic obstruction shows a characteristic
early peaking velocity curve
e) None