Downloaded 329 times
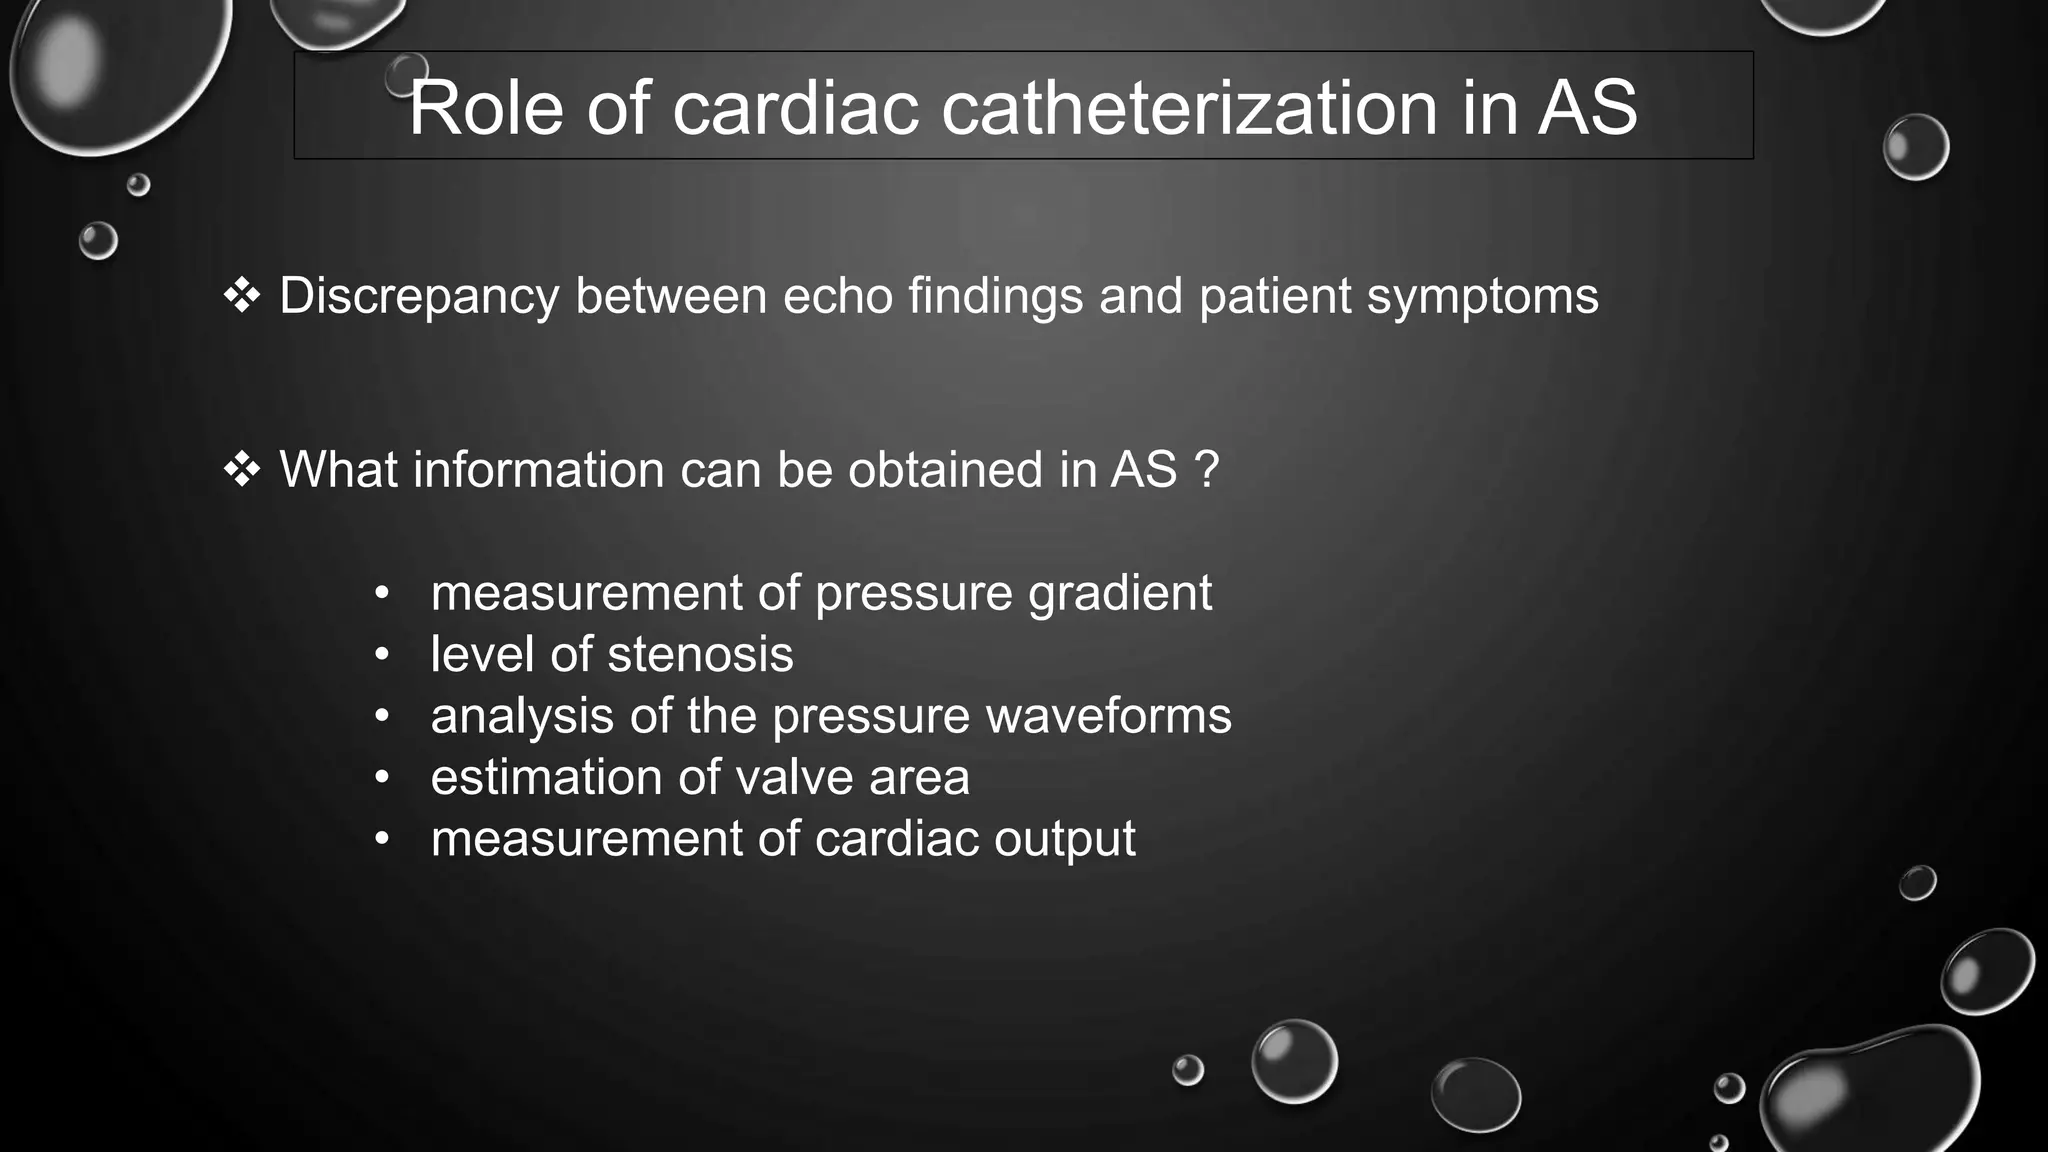
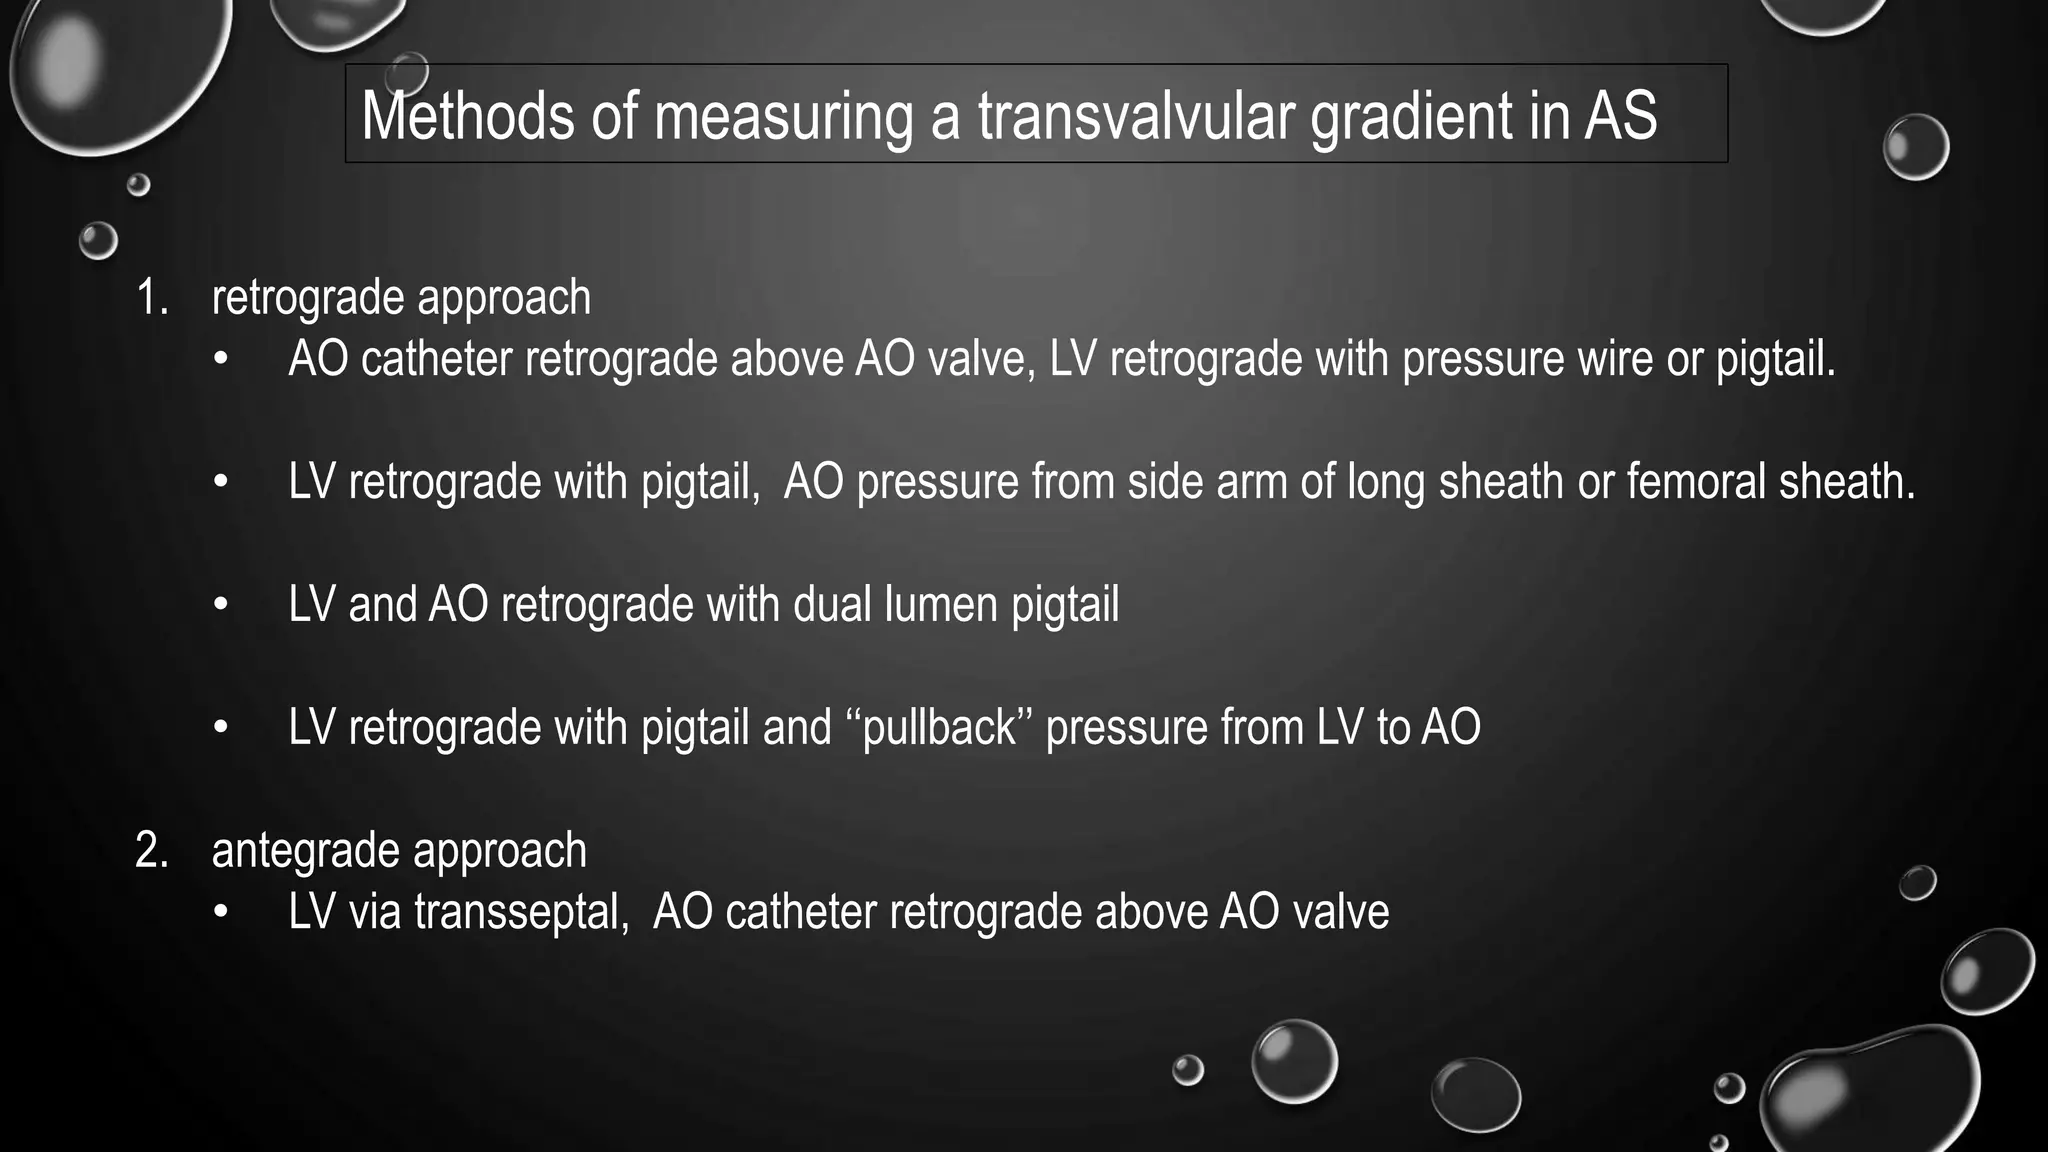
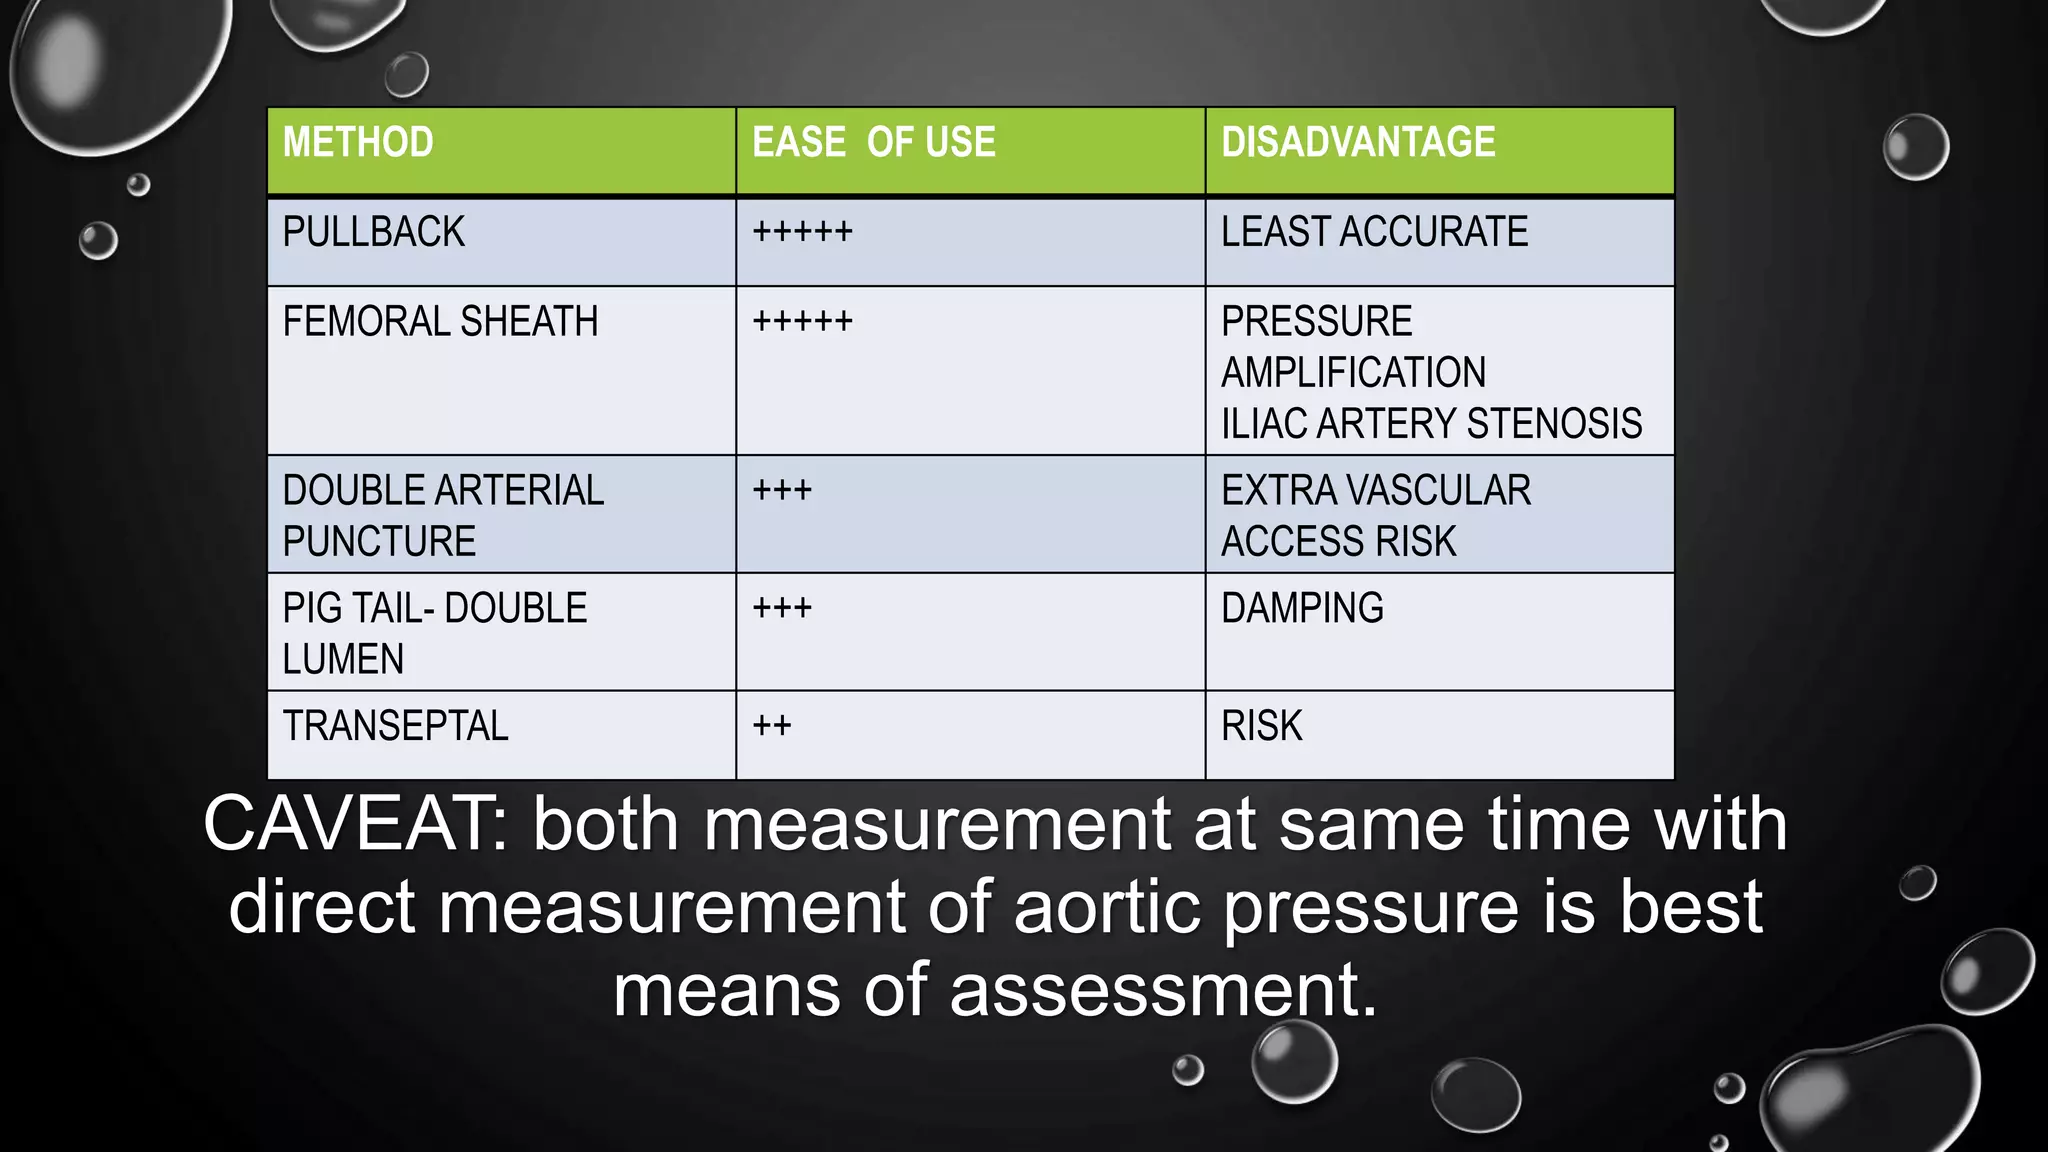
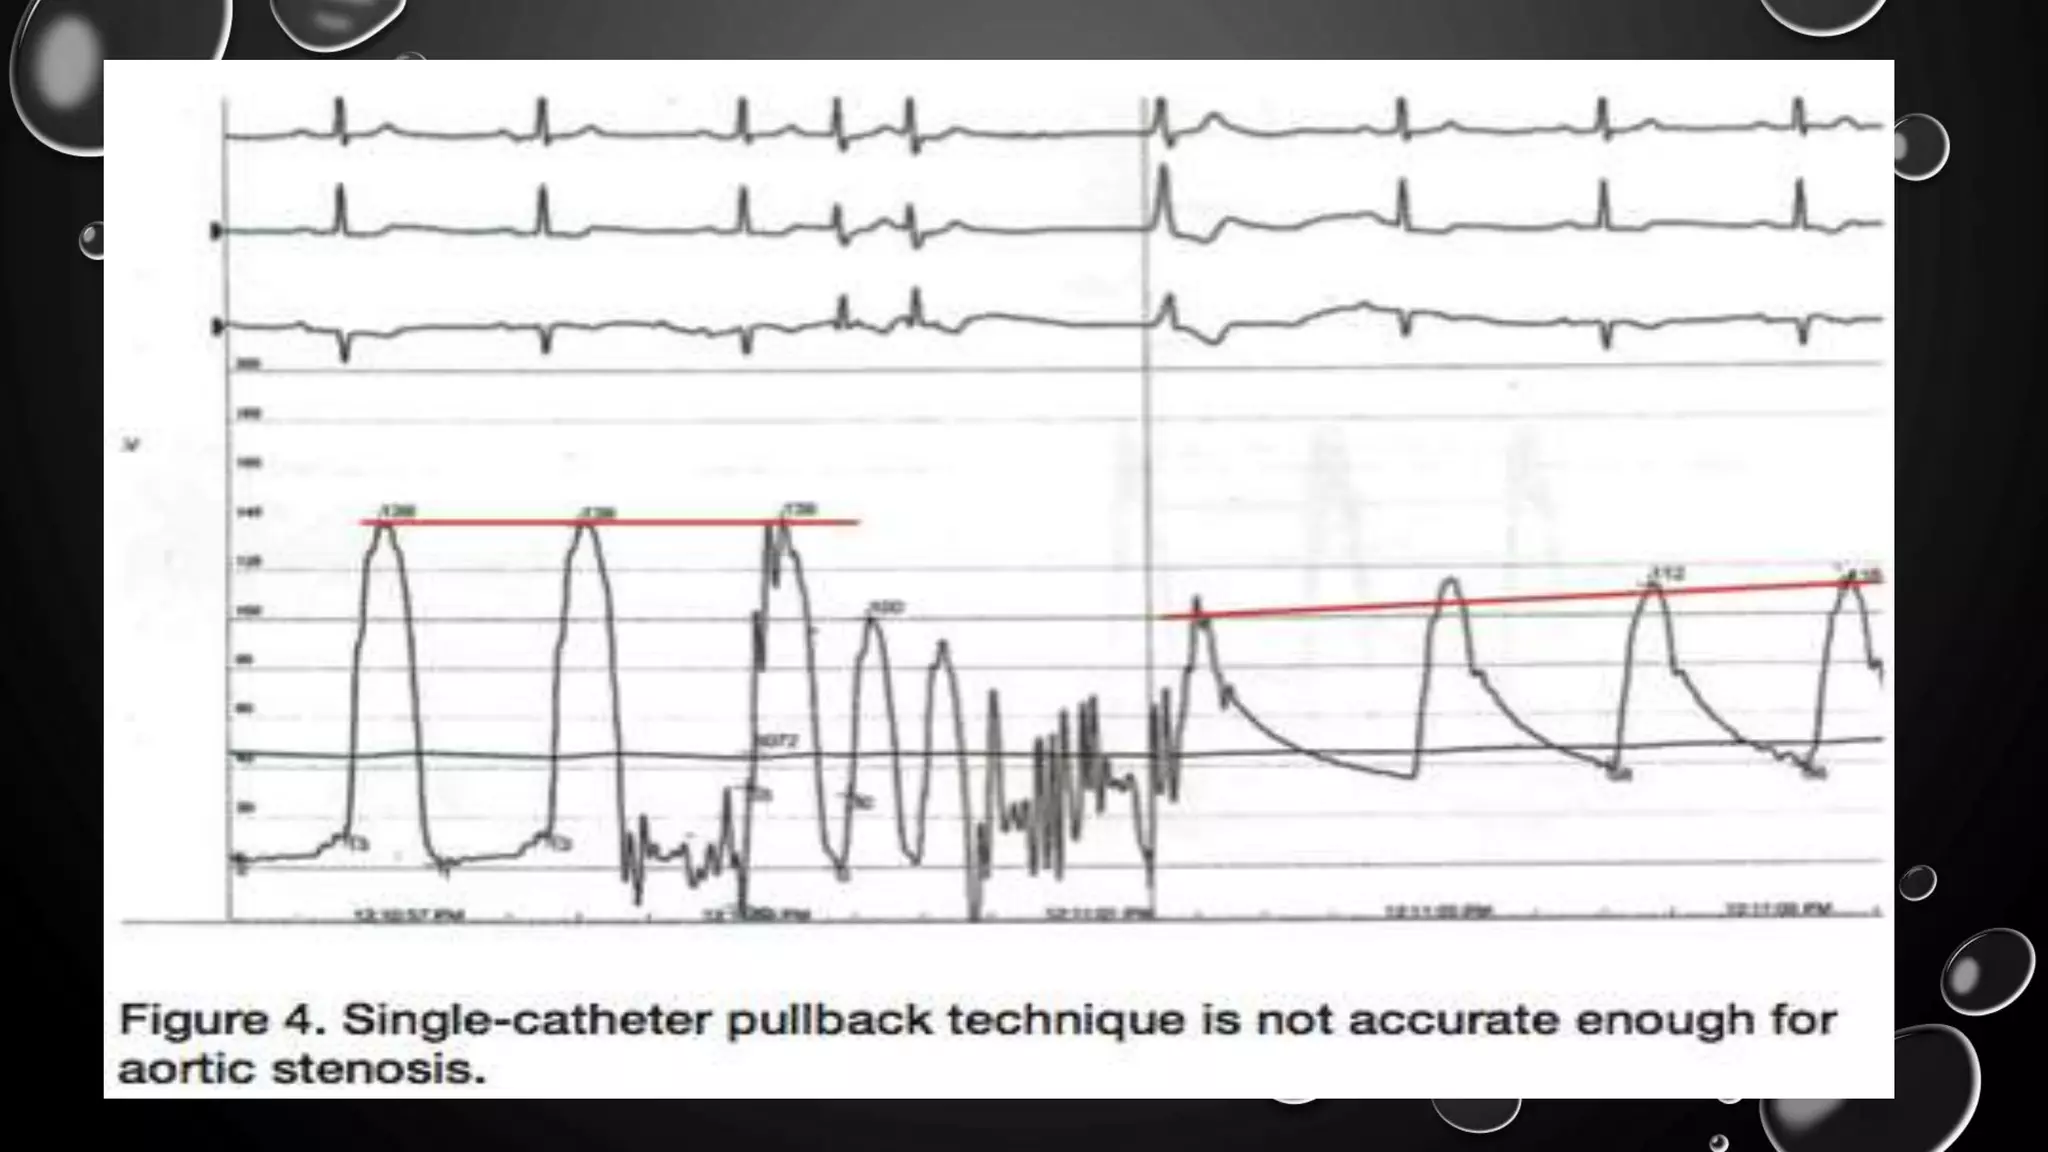
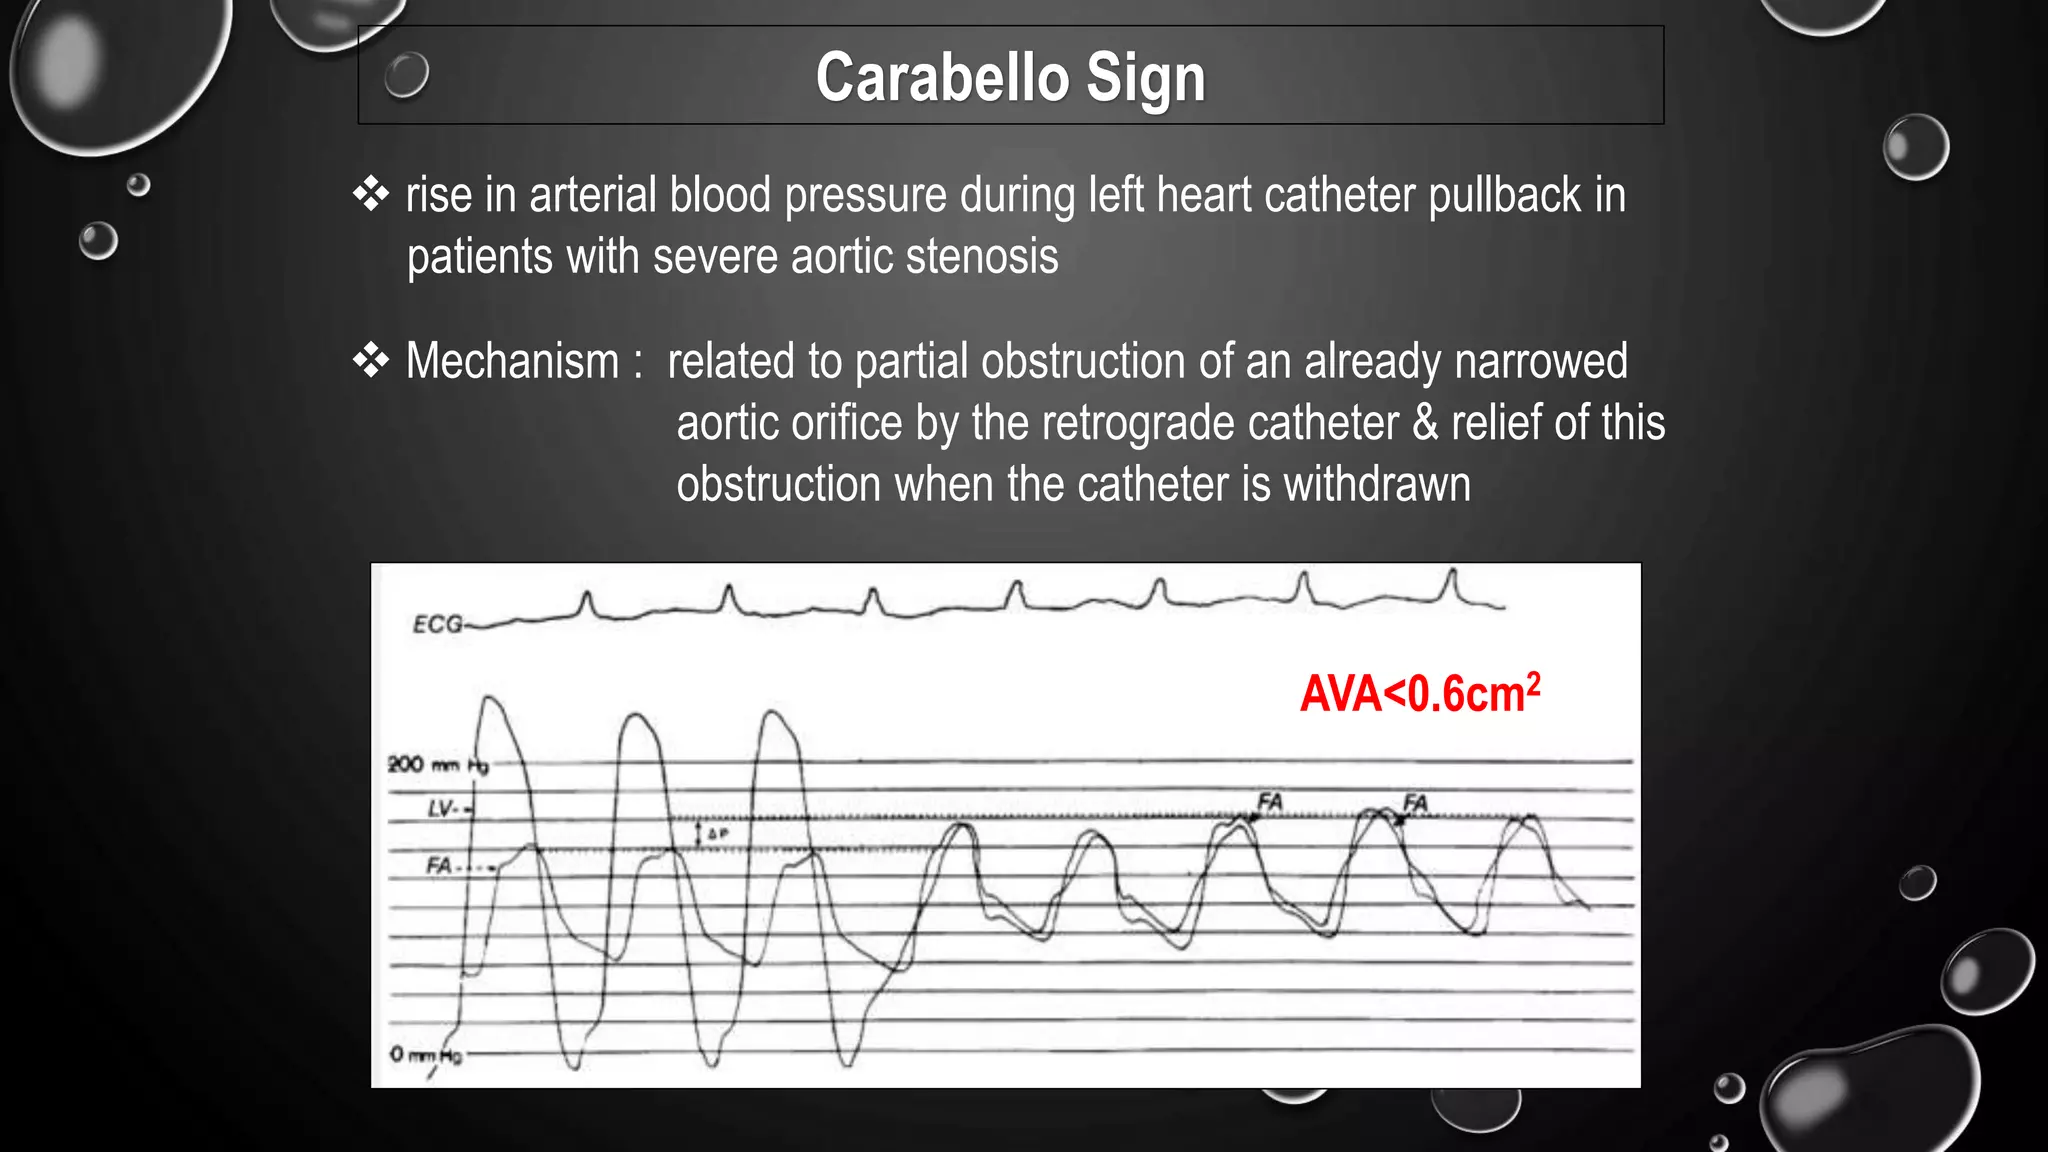
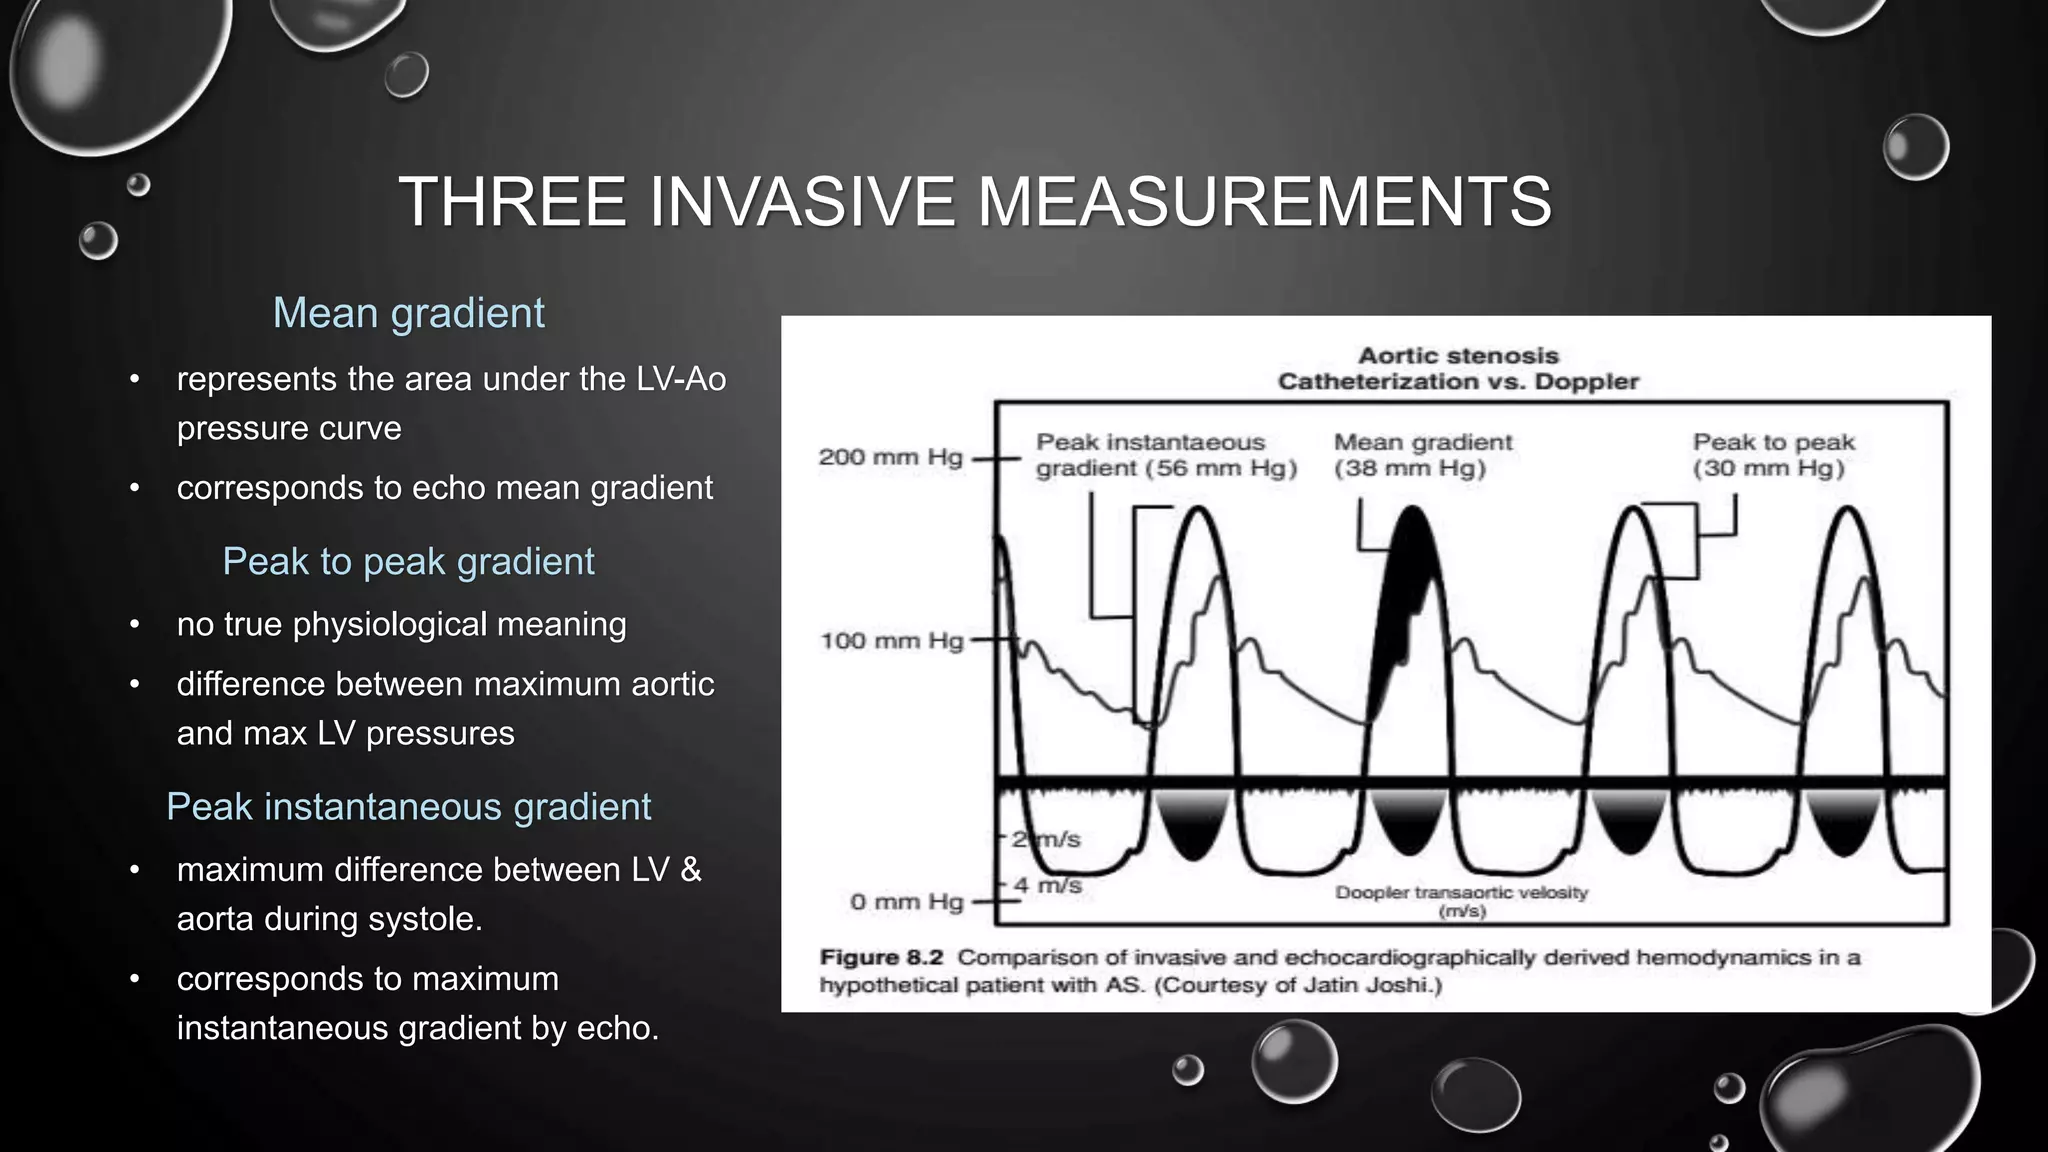

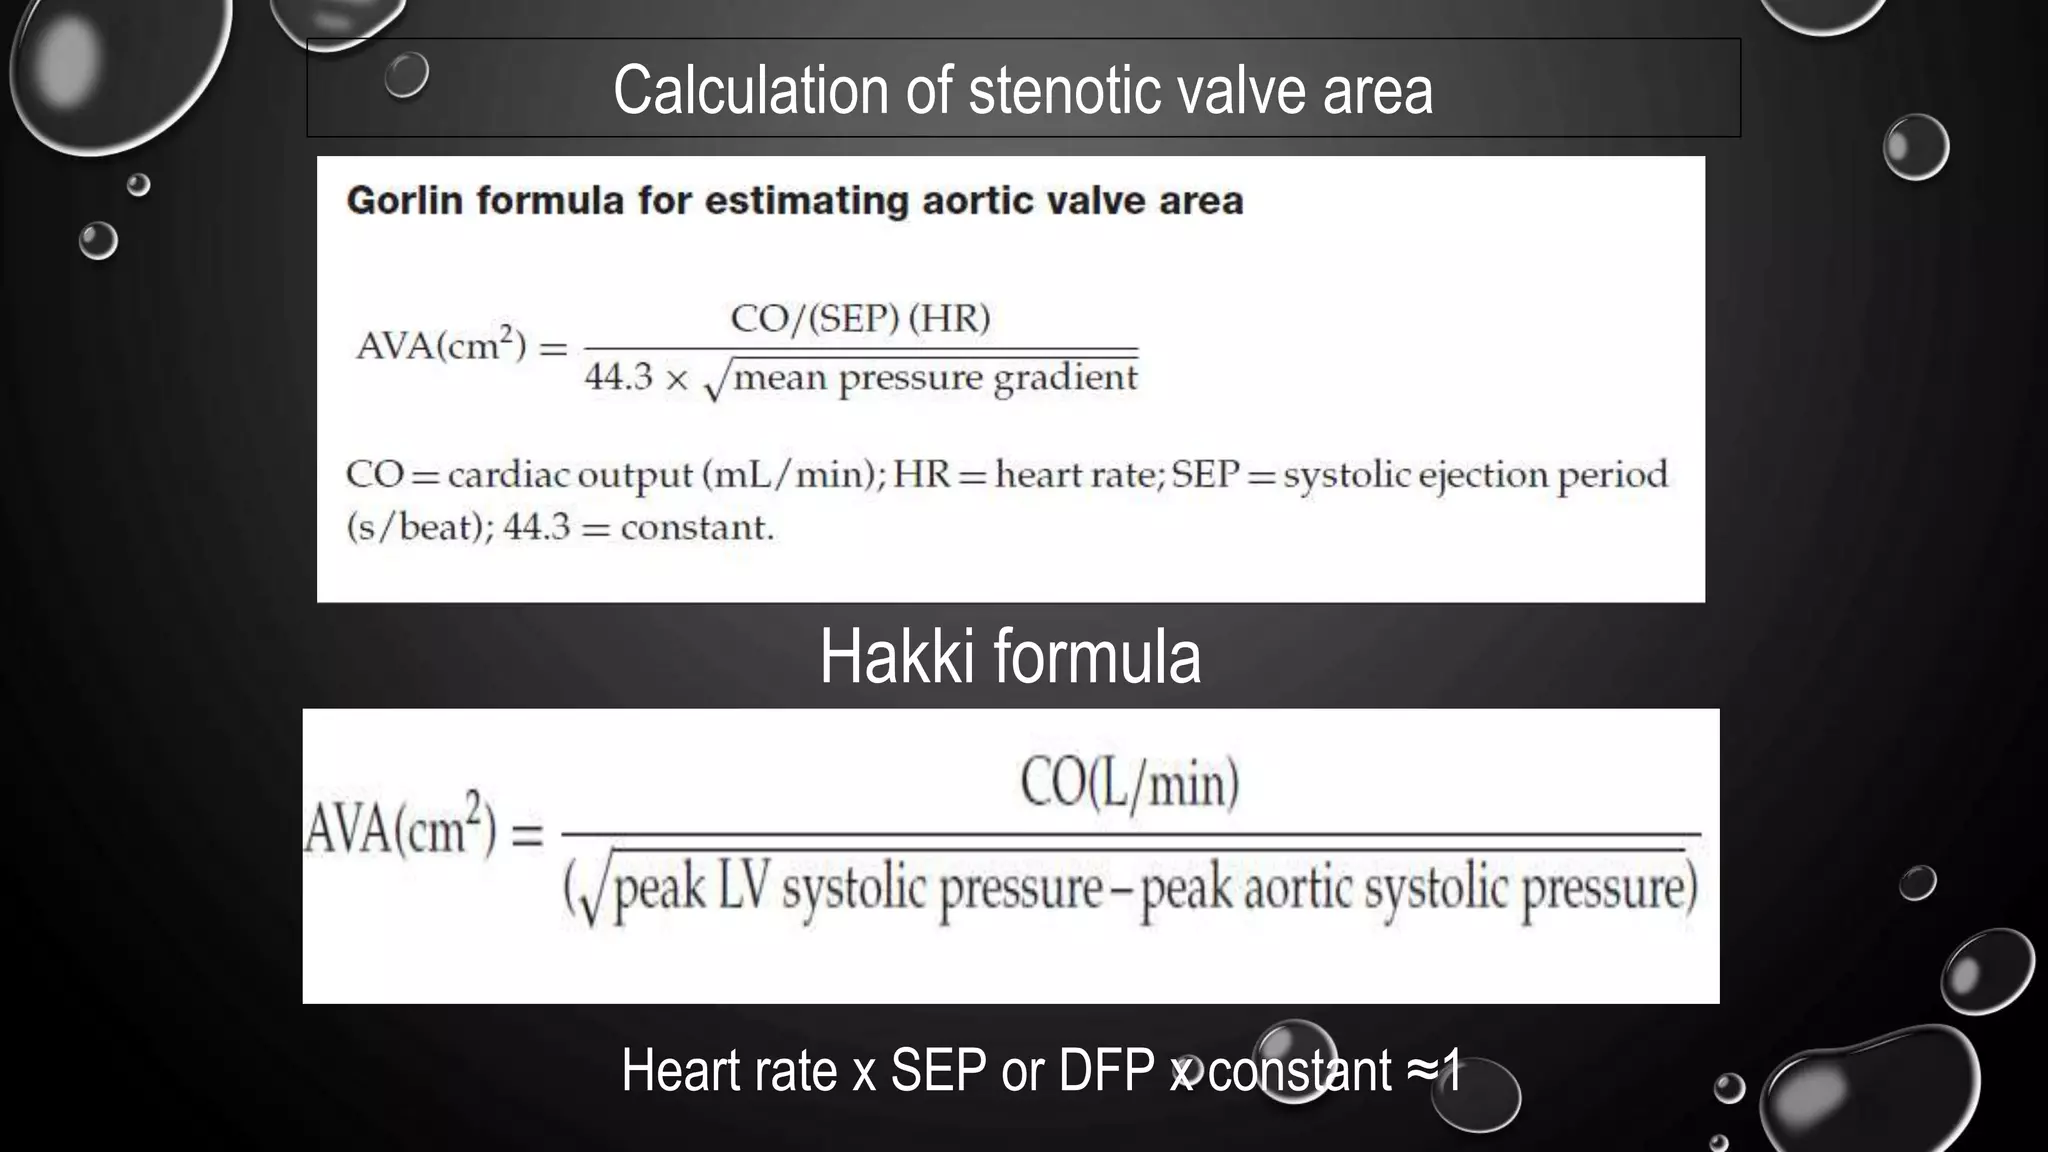
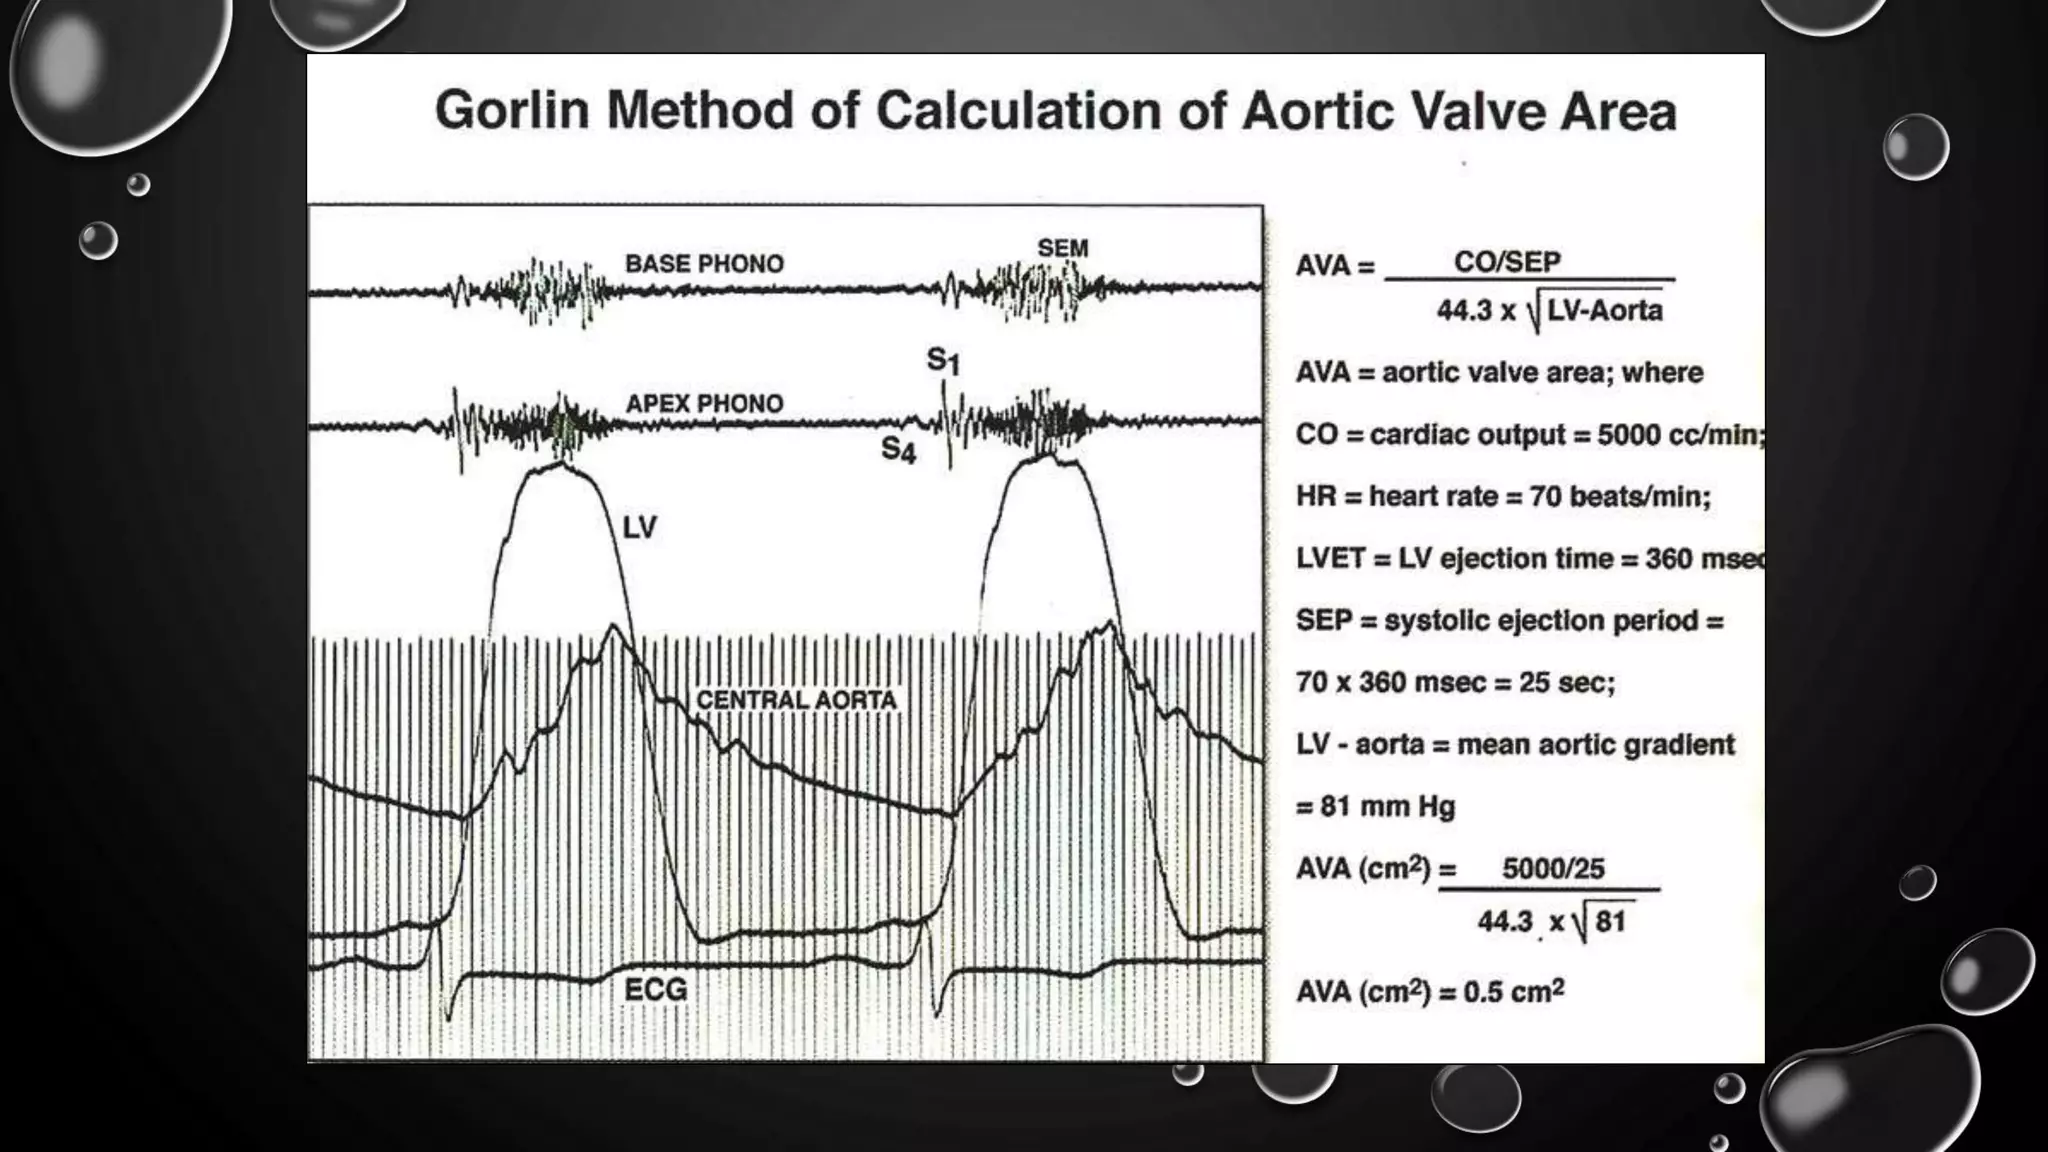
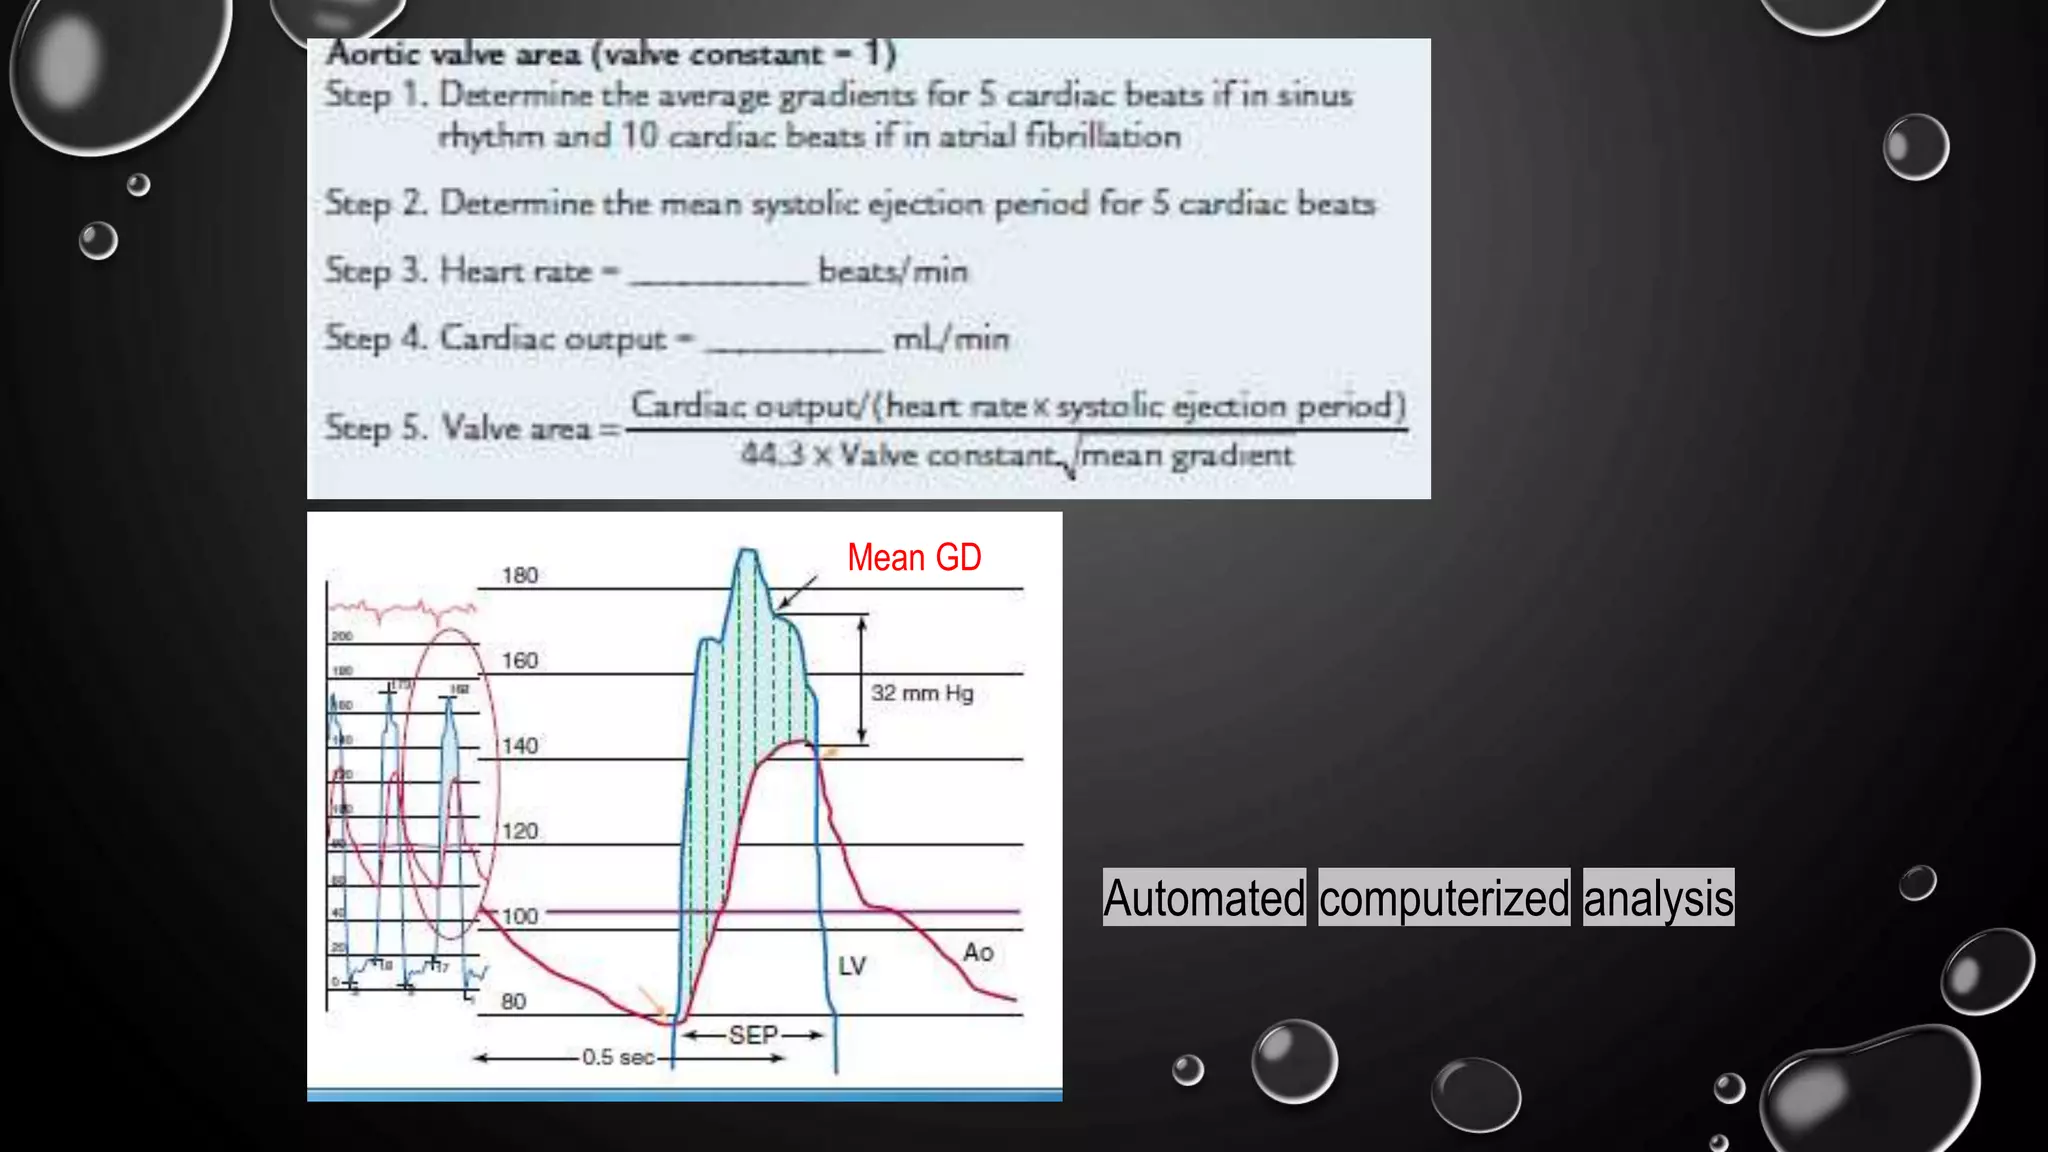
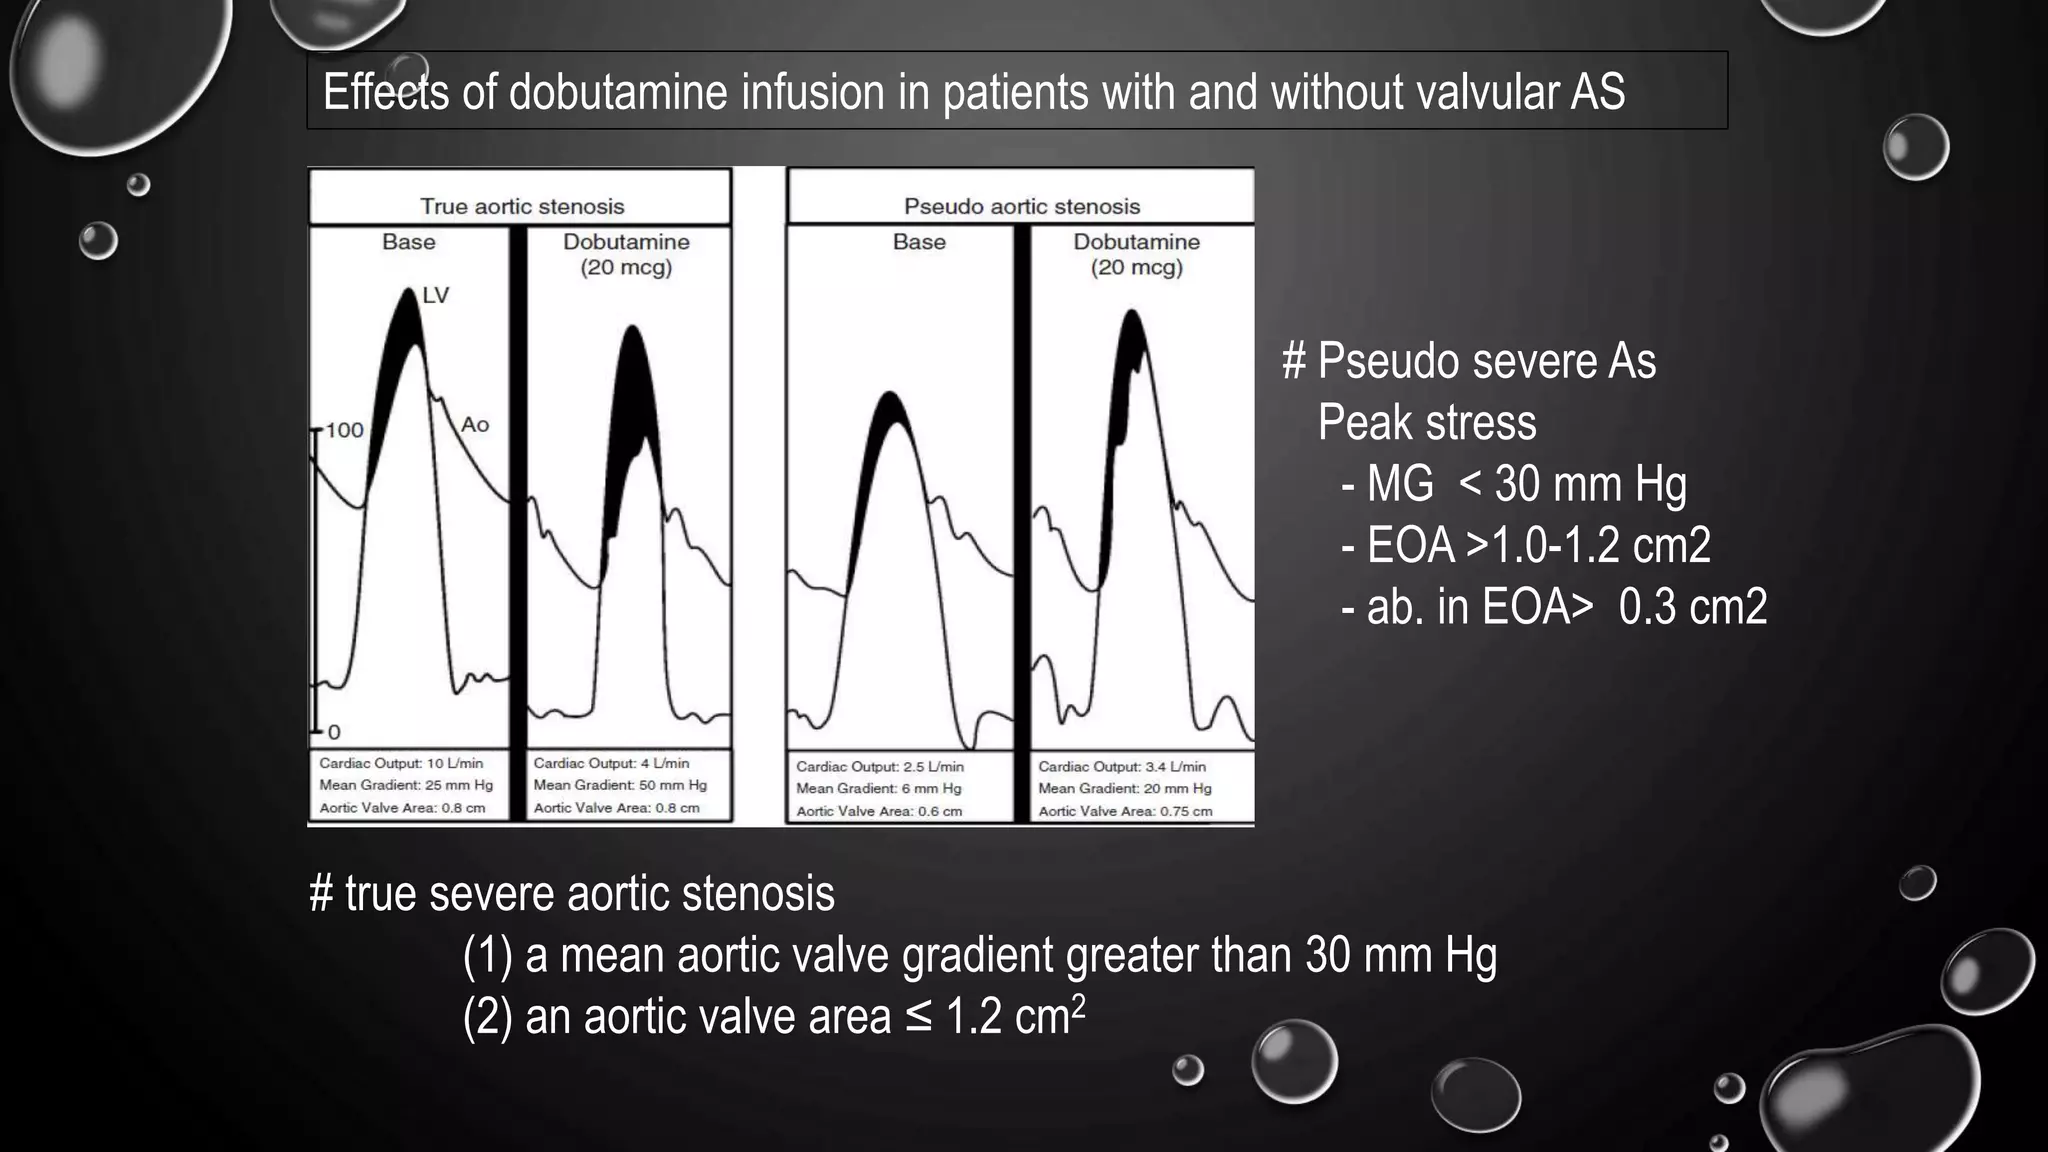
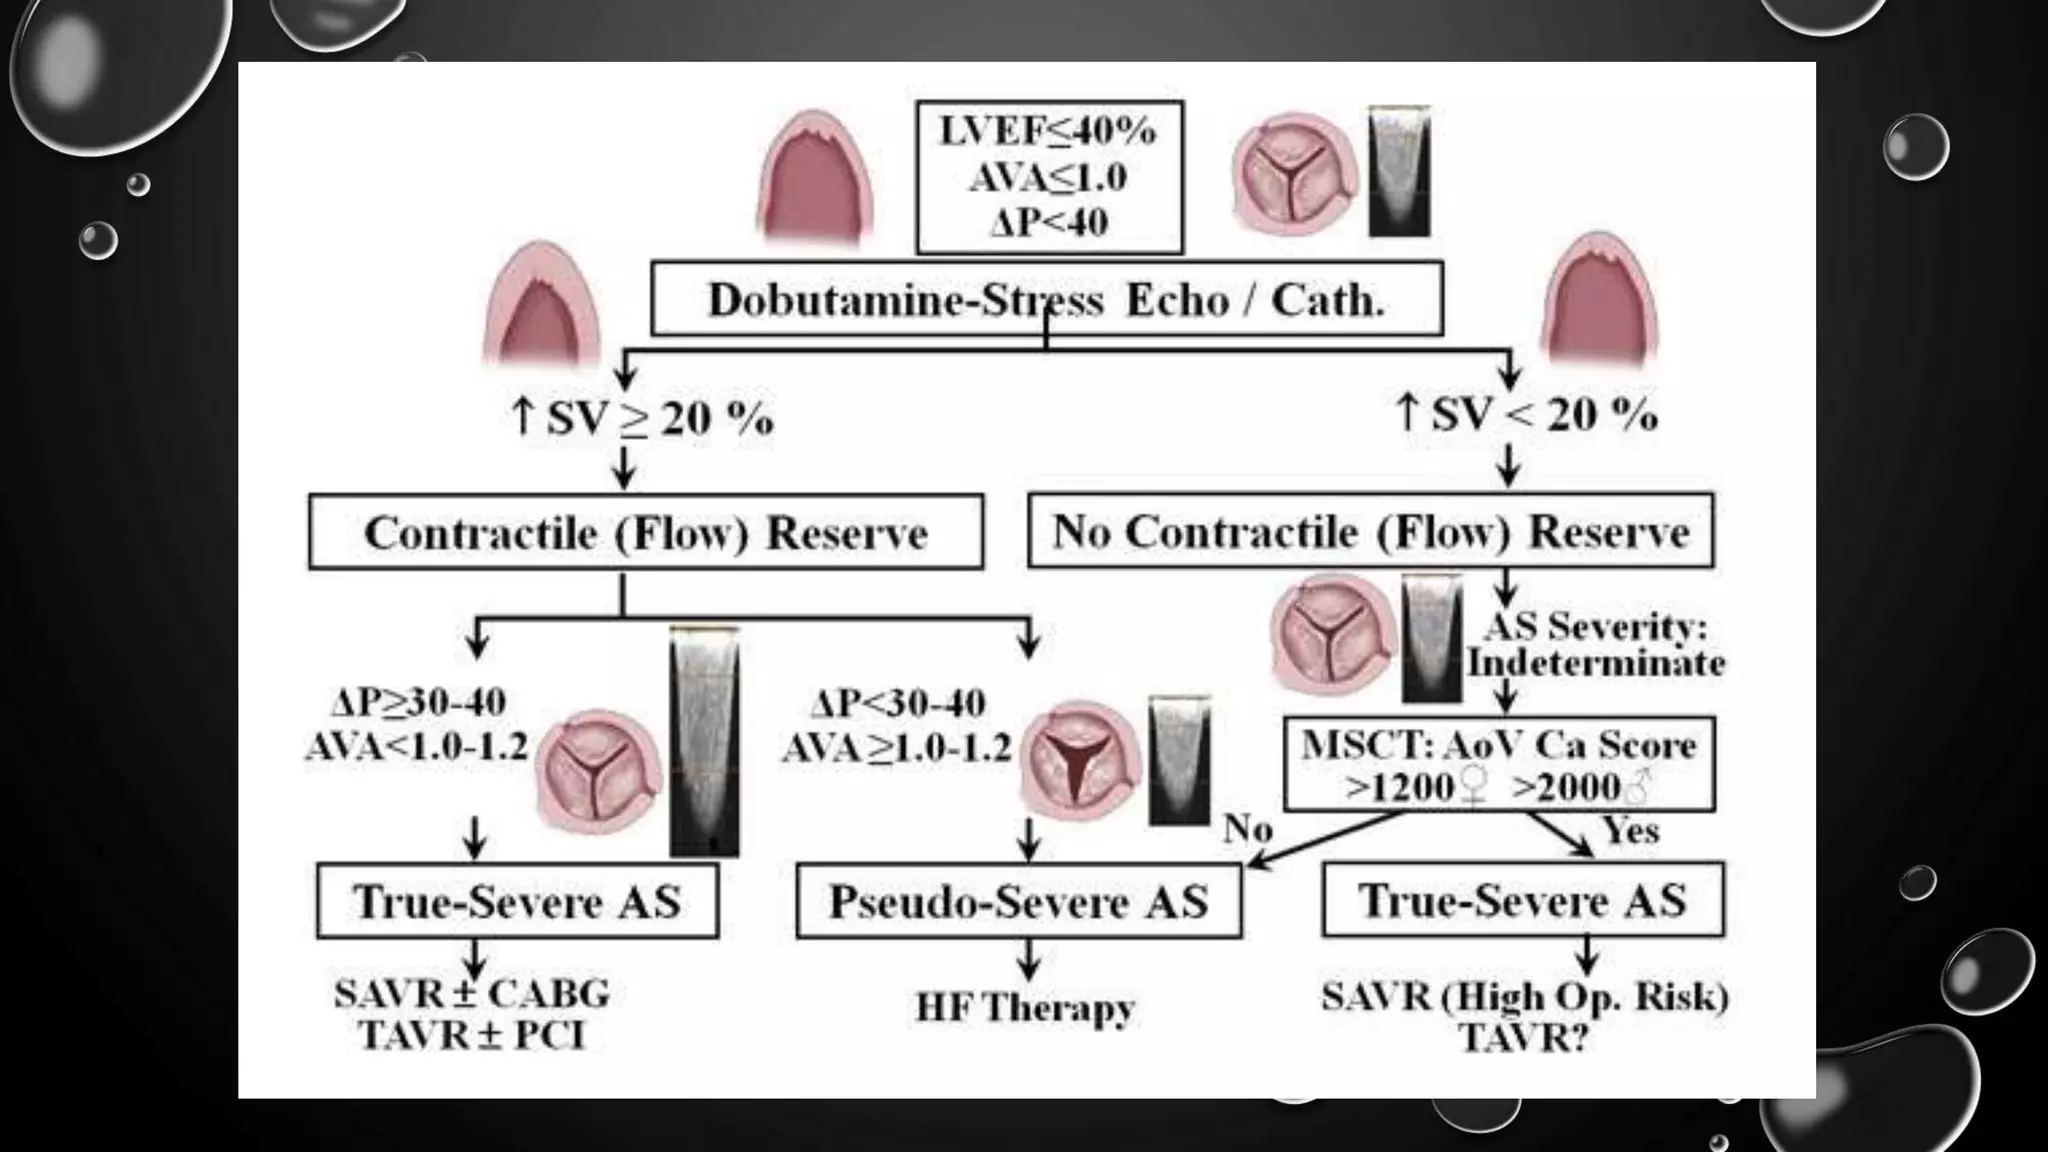
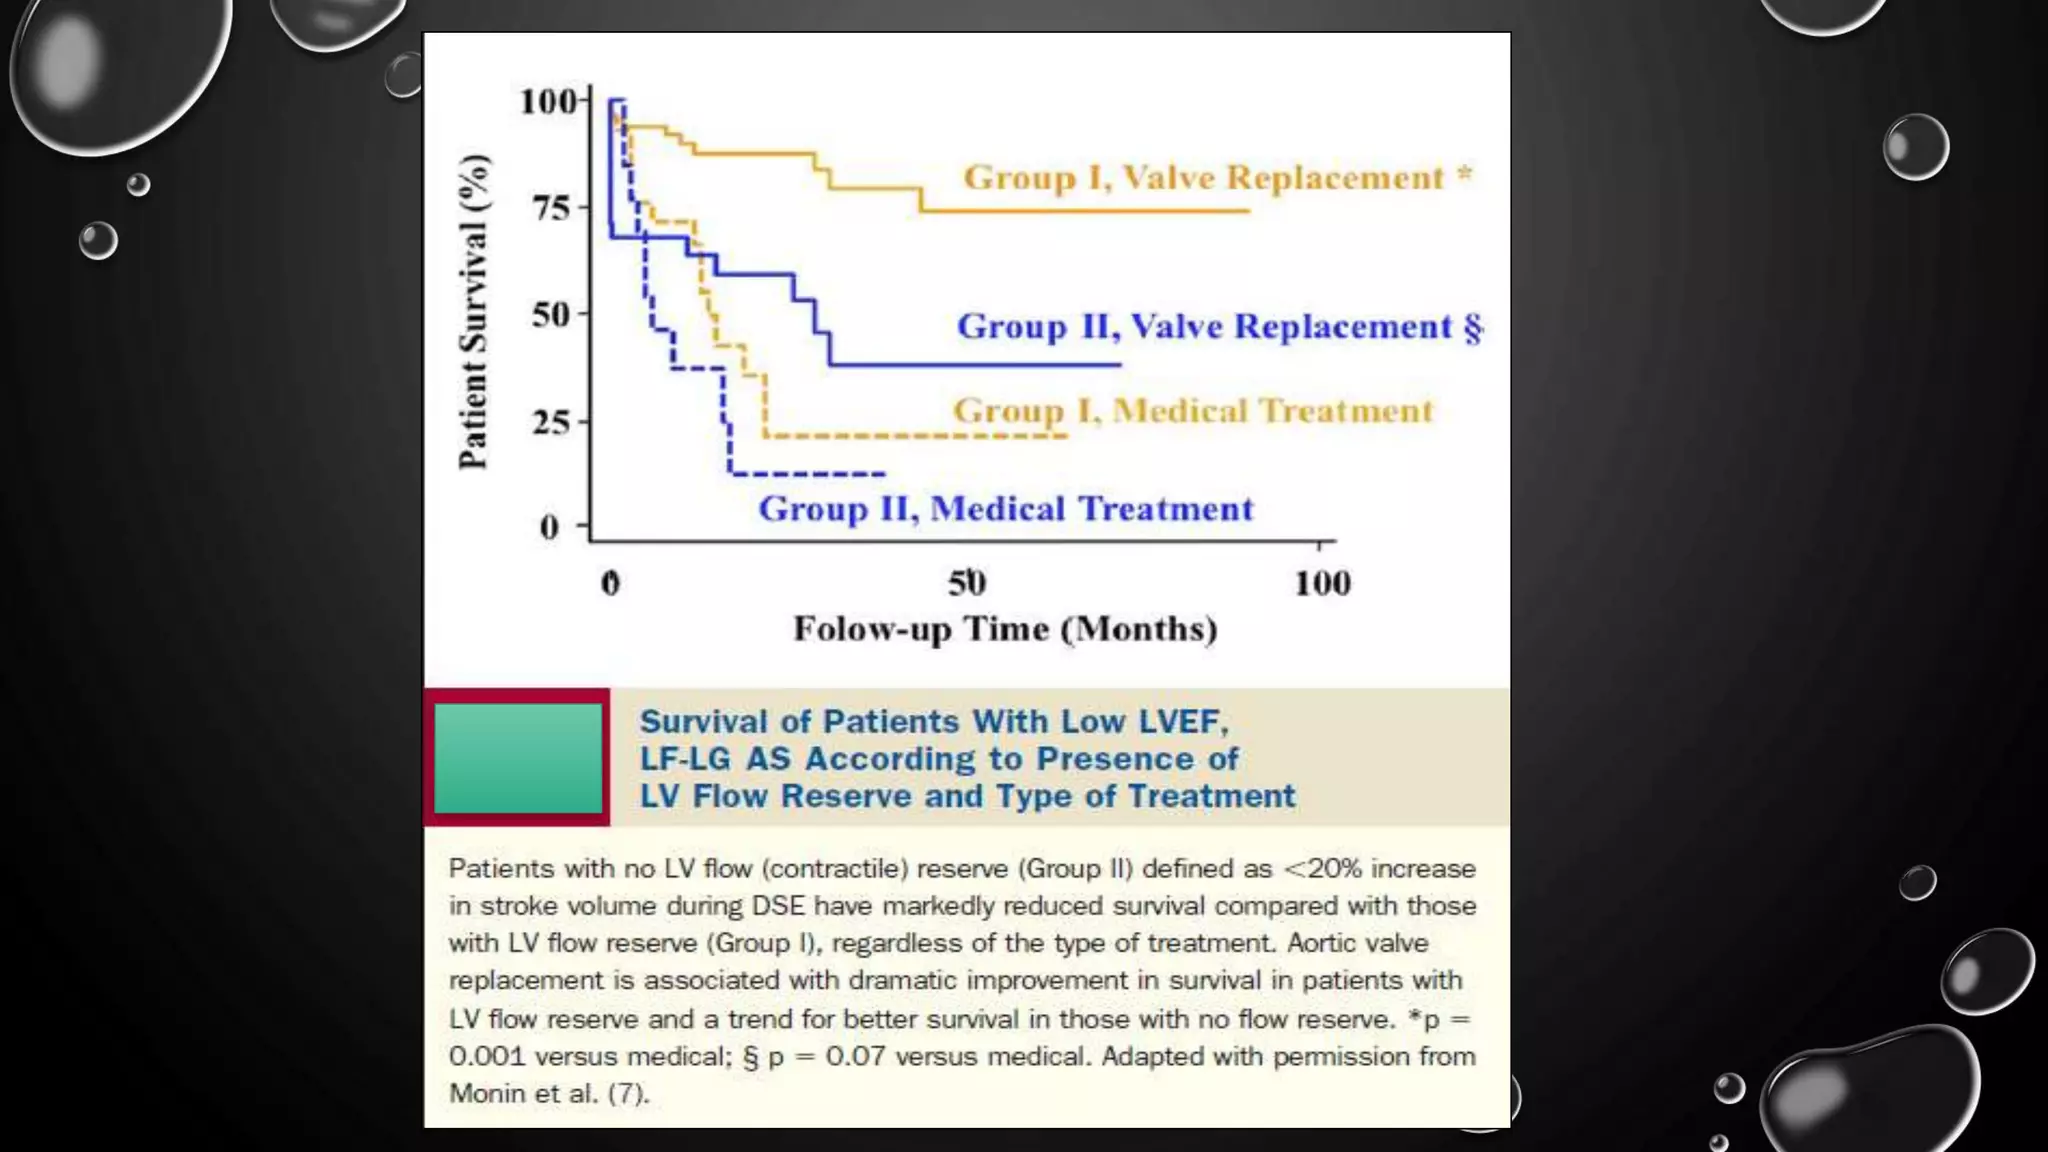
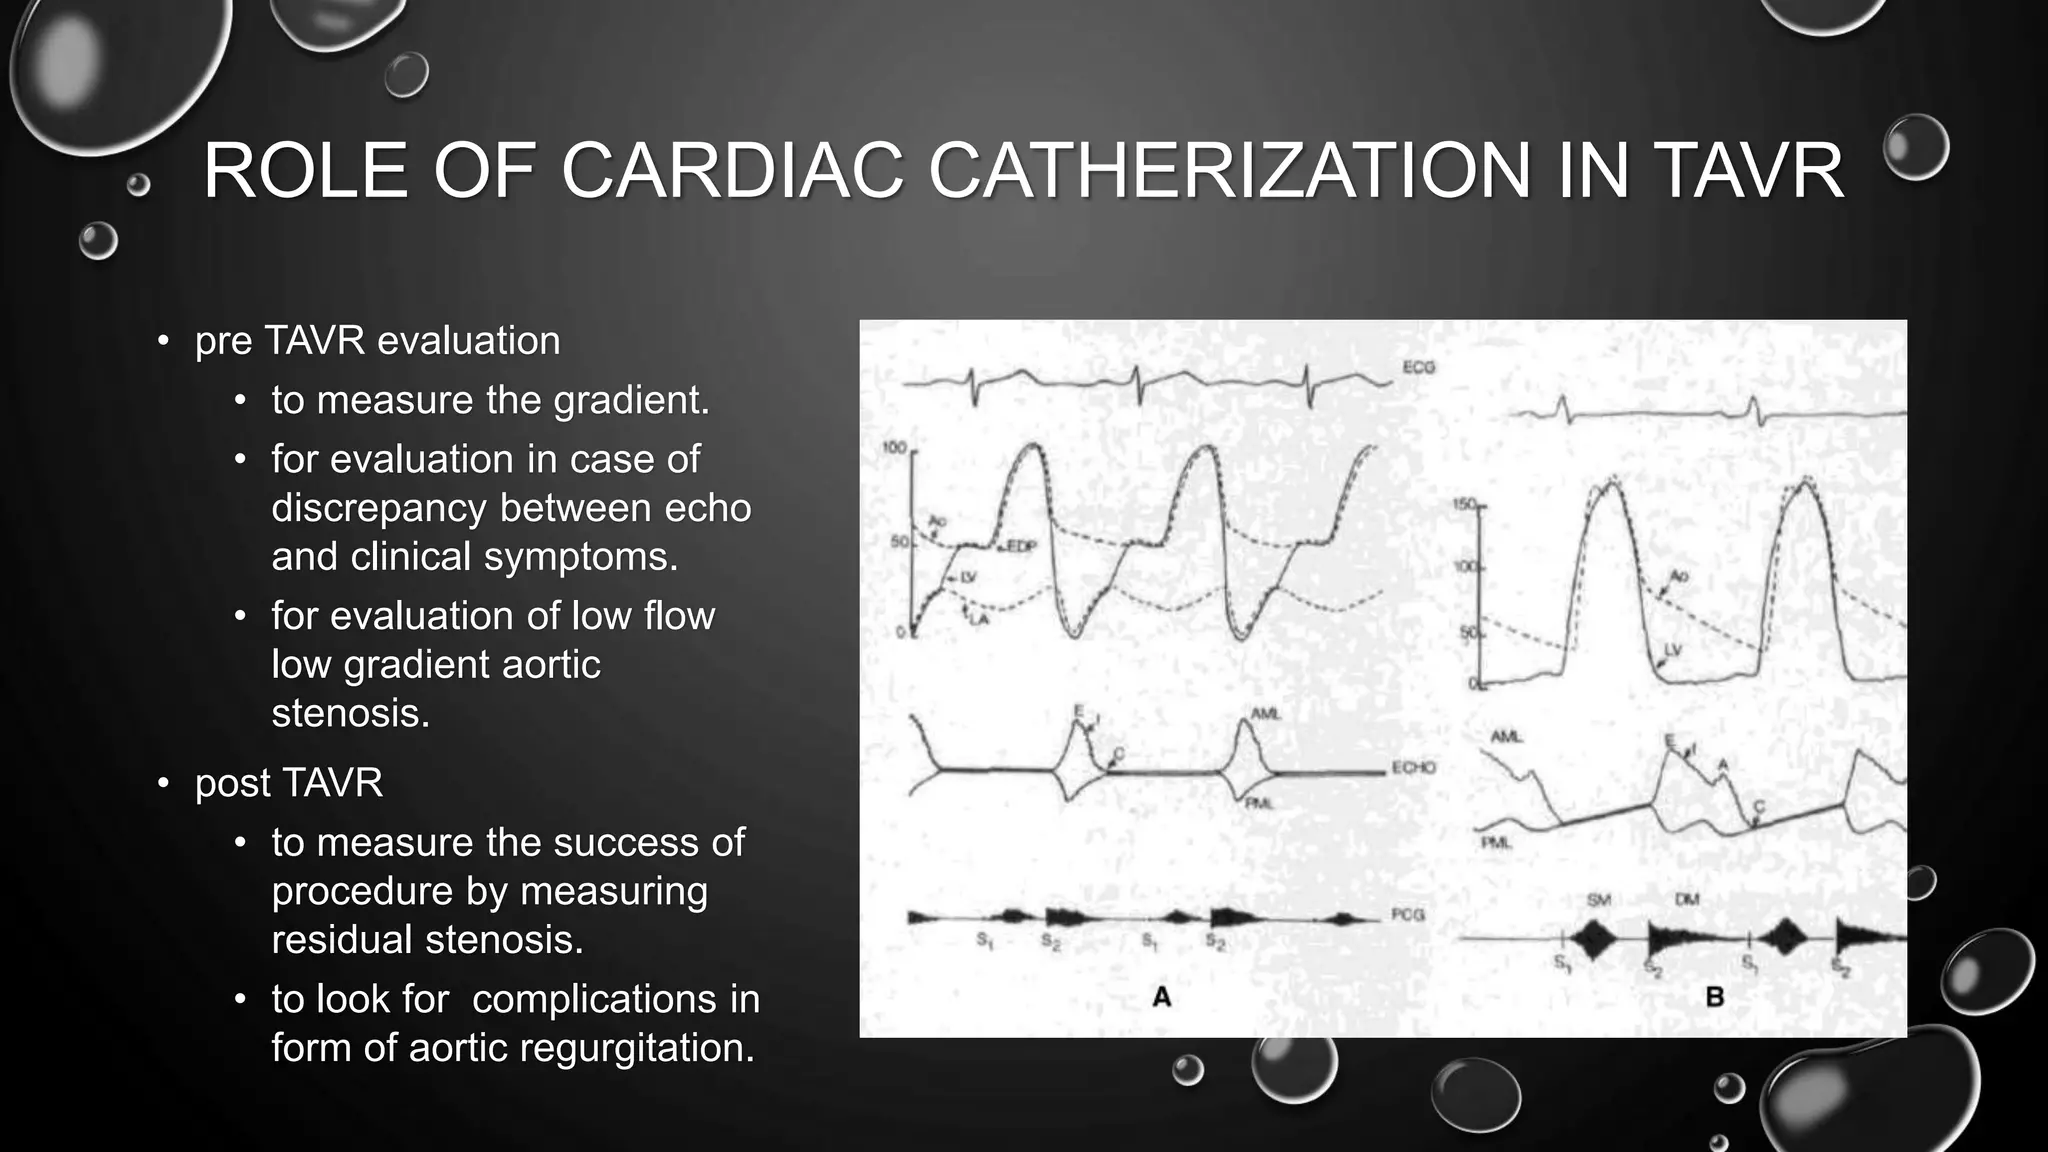

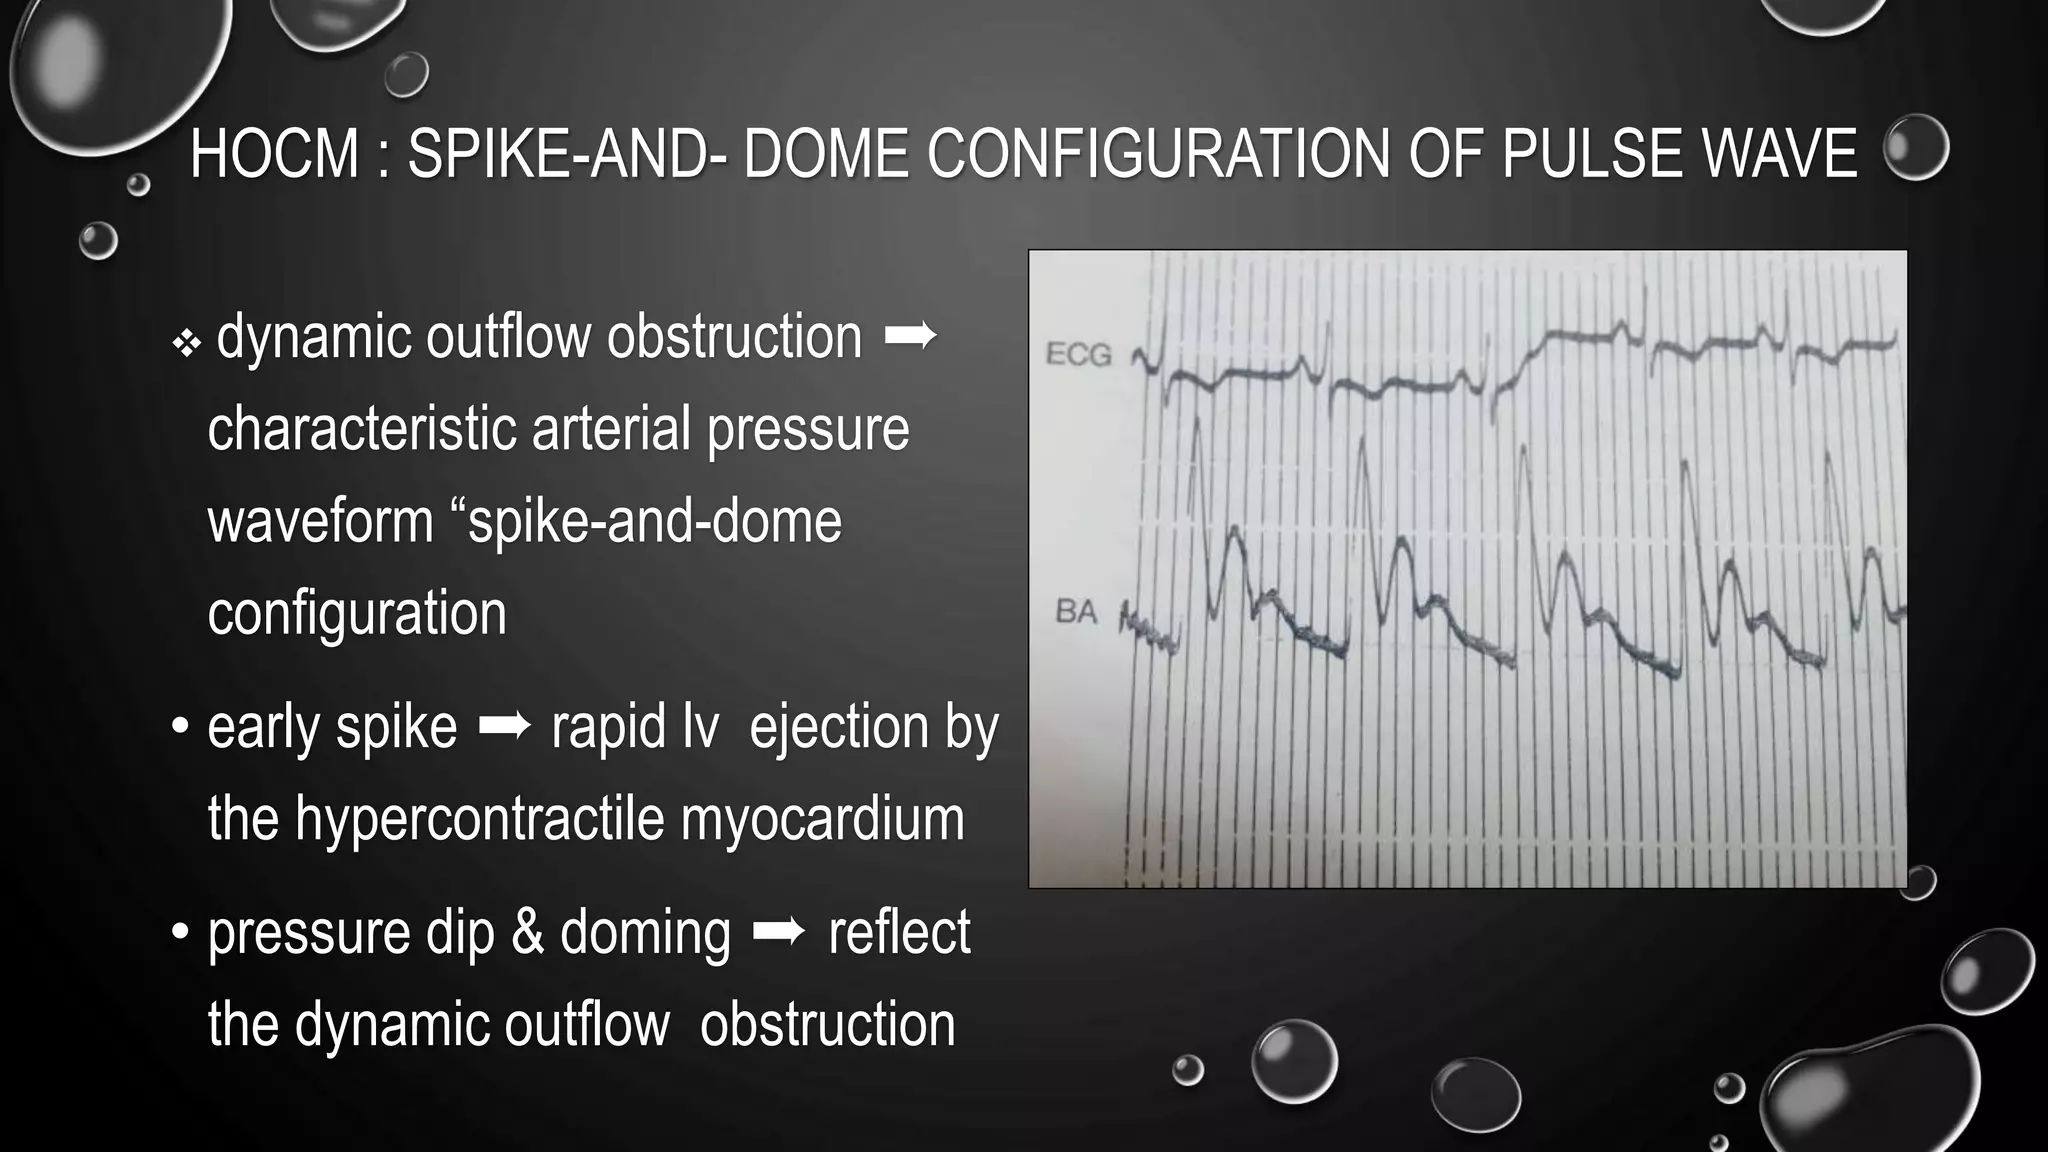
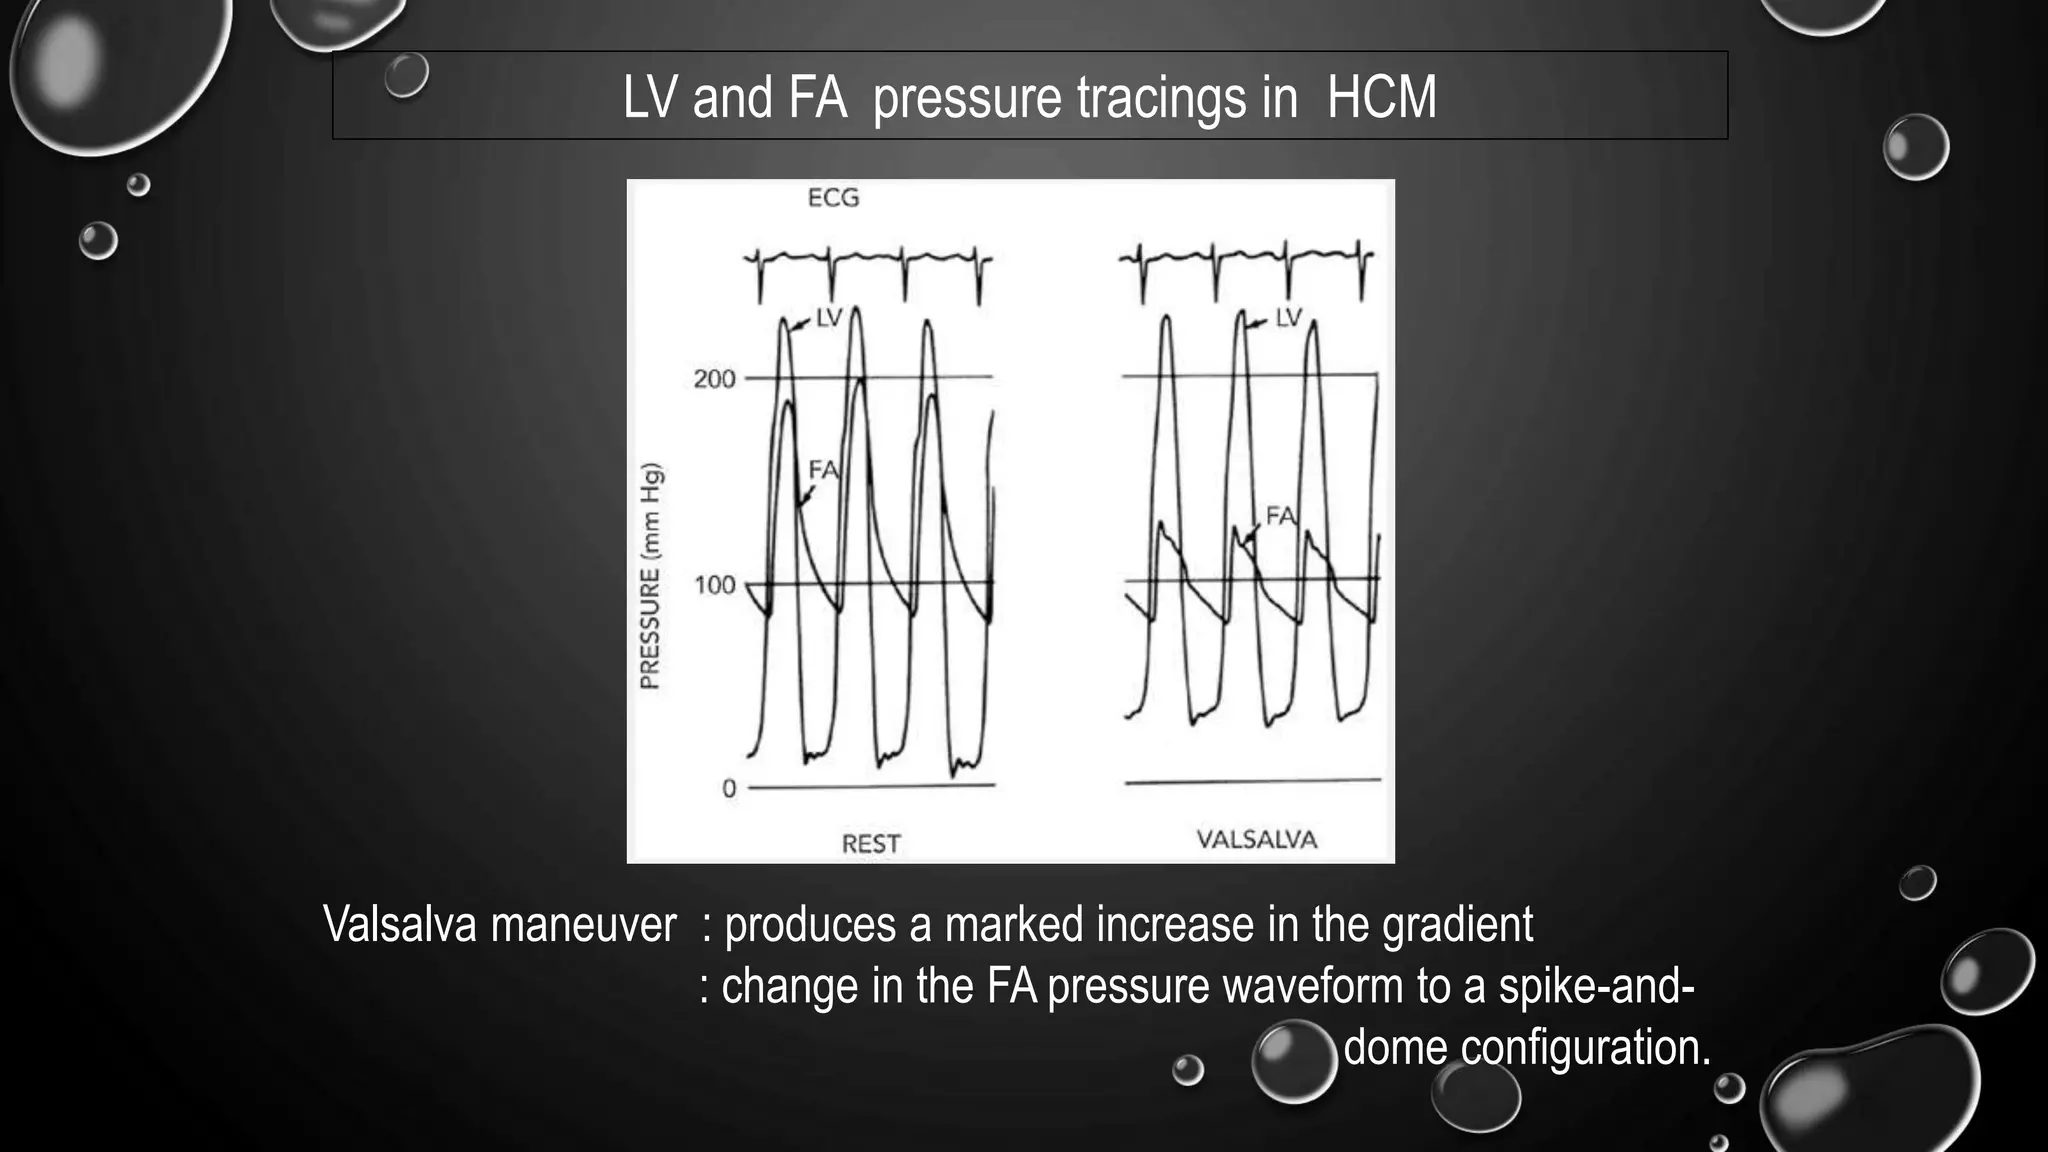
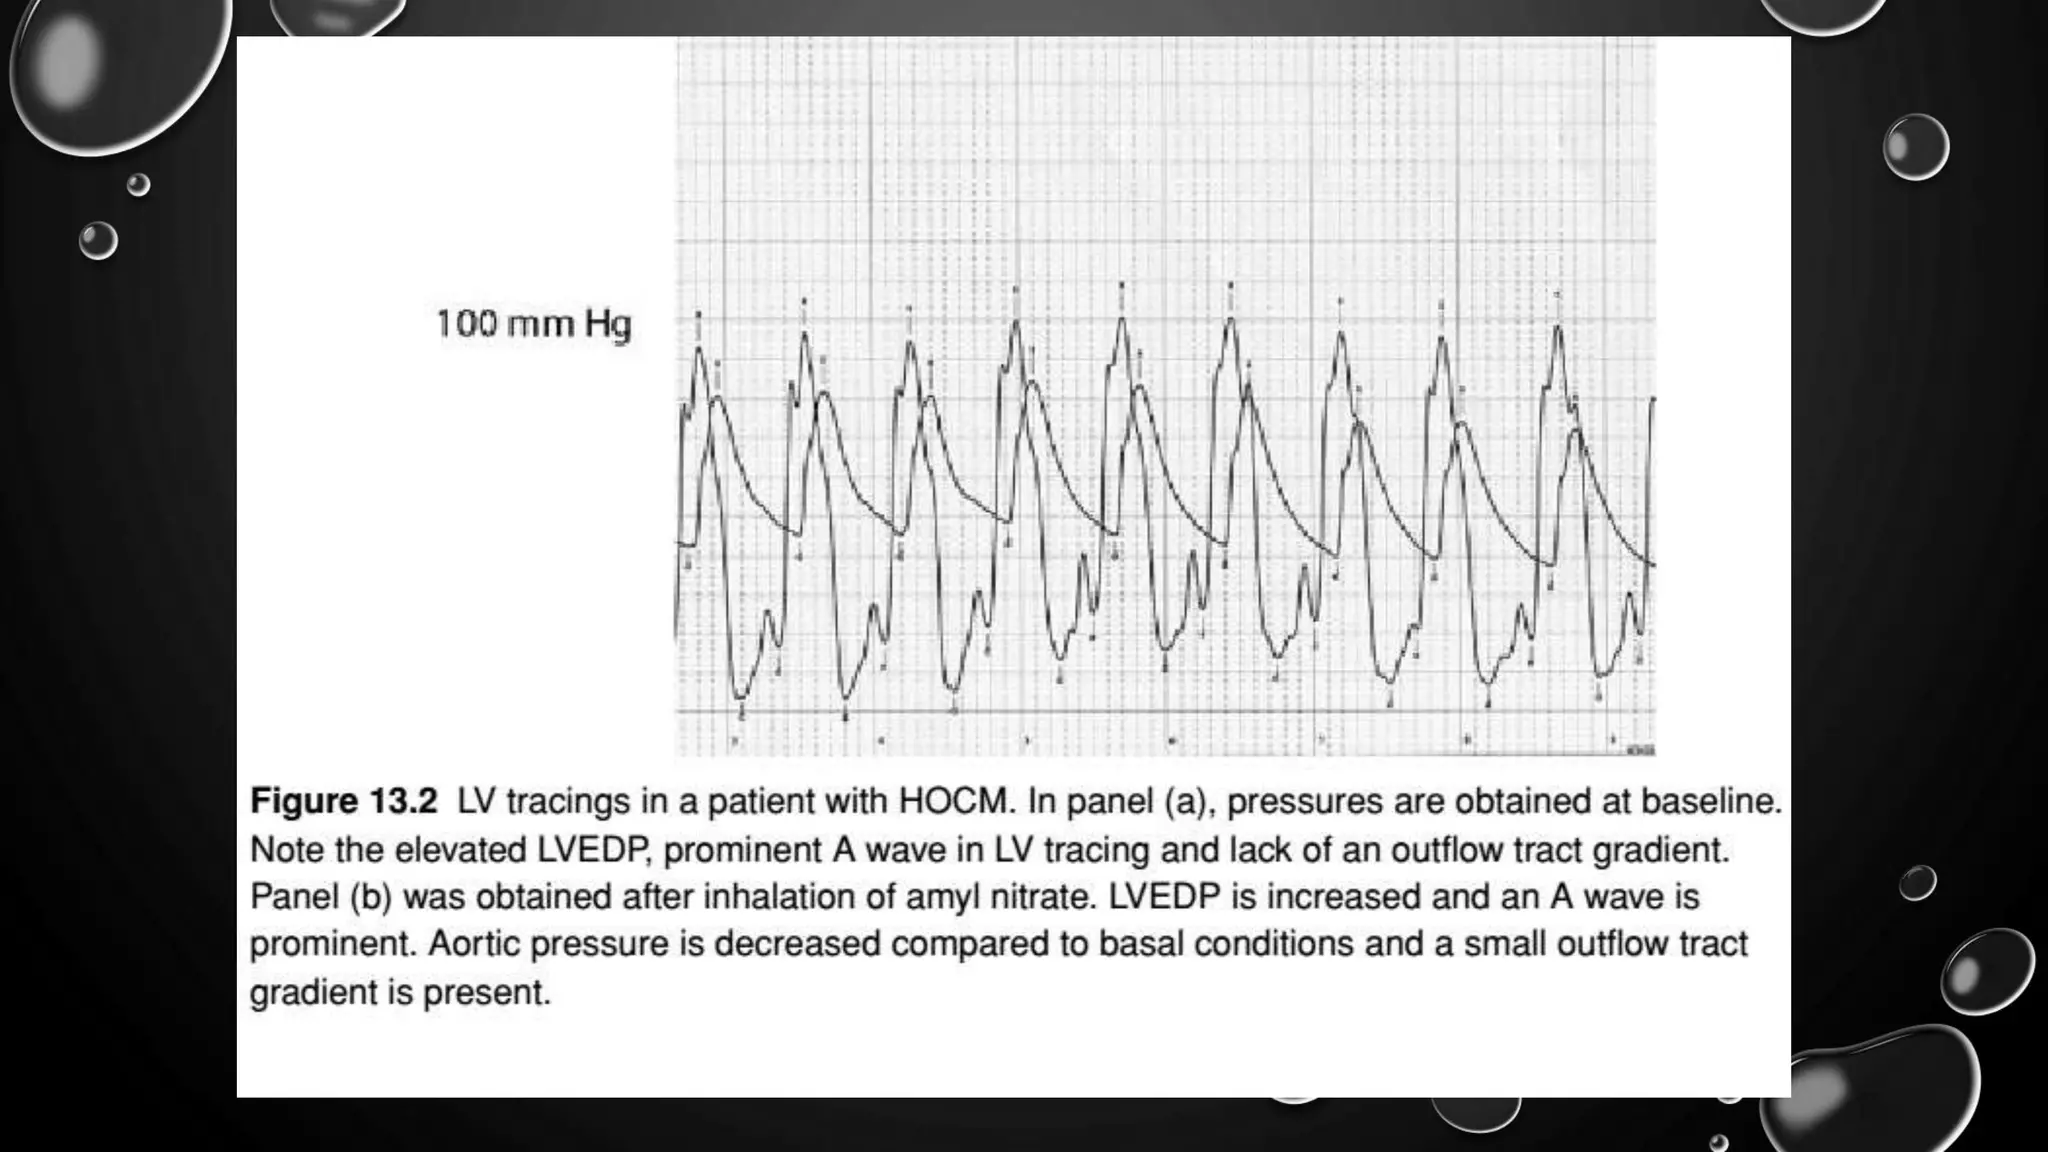
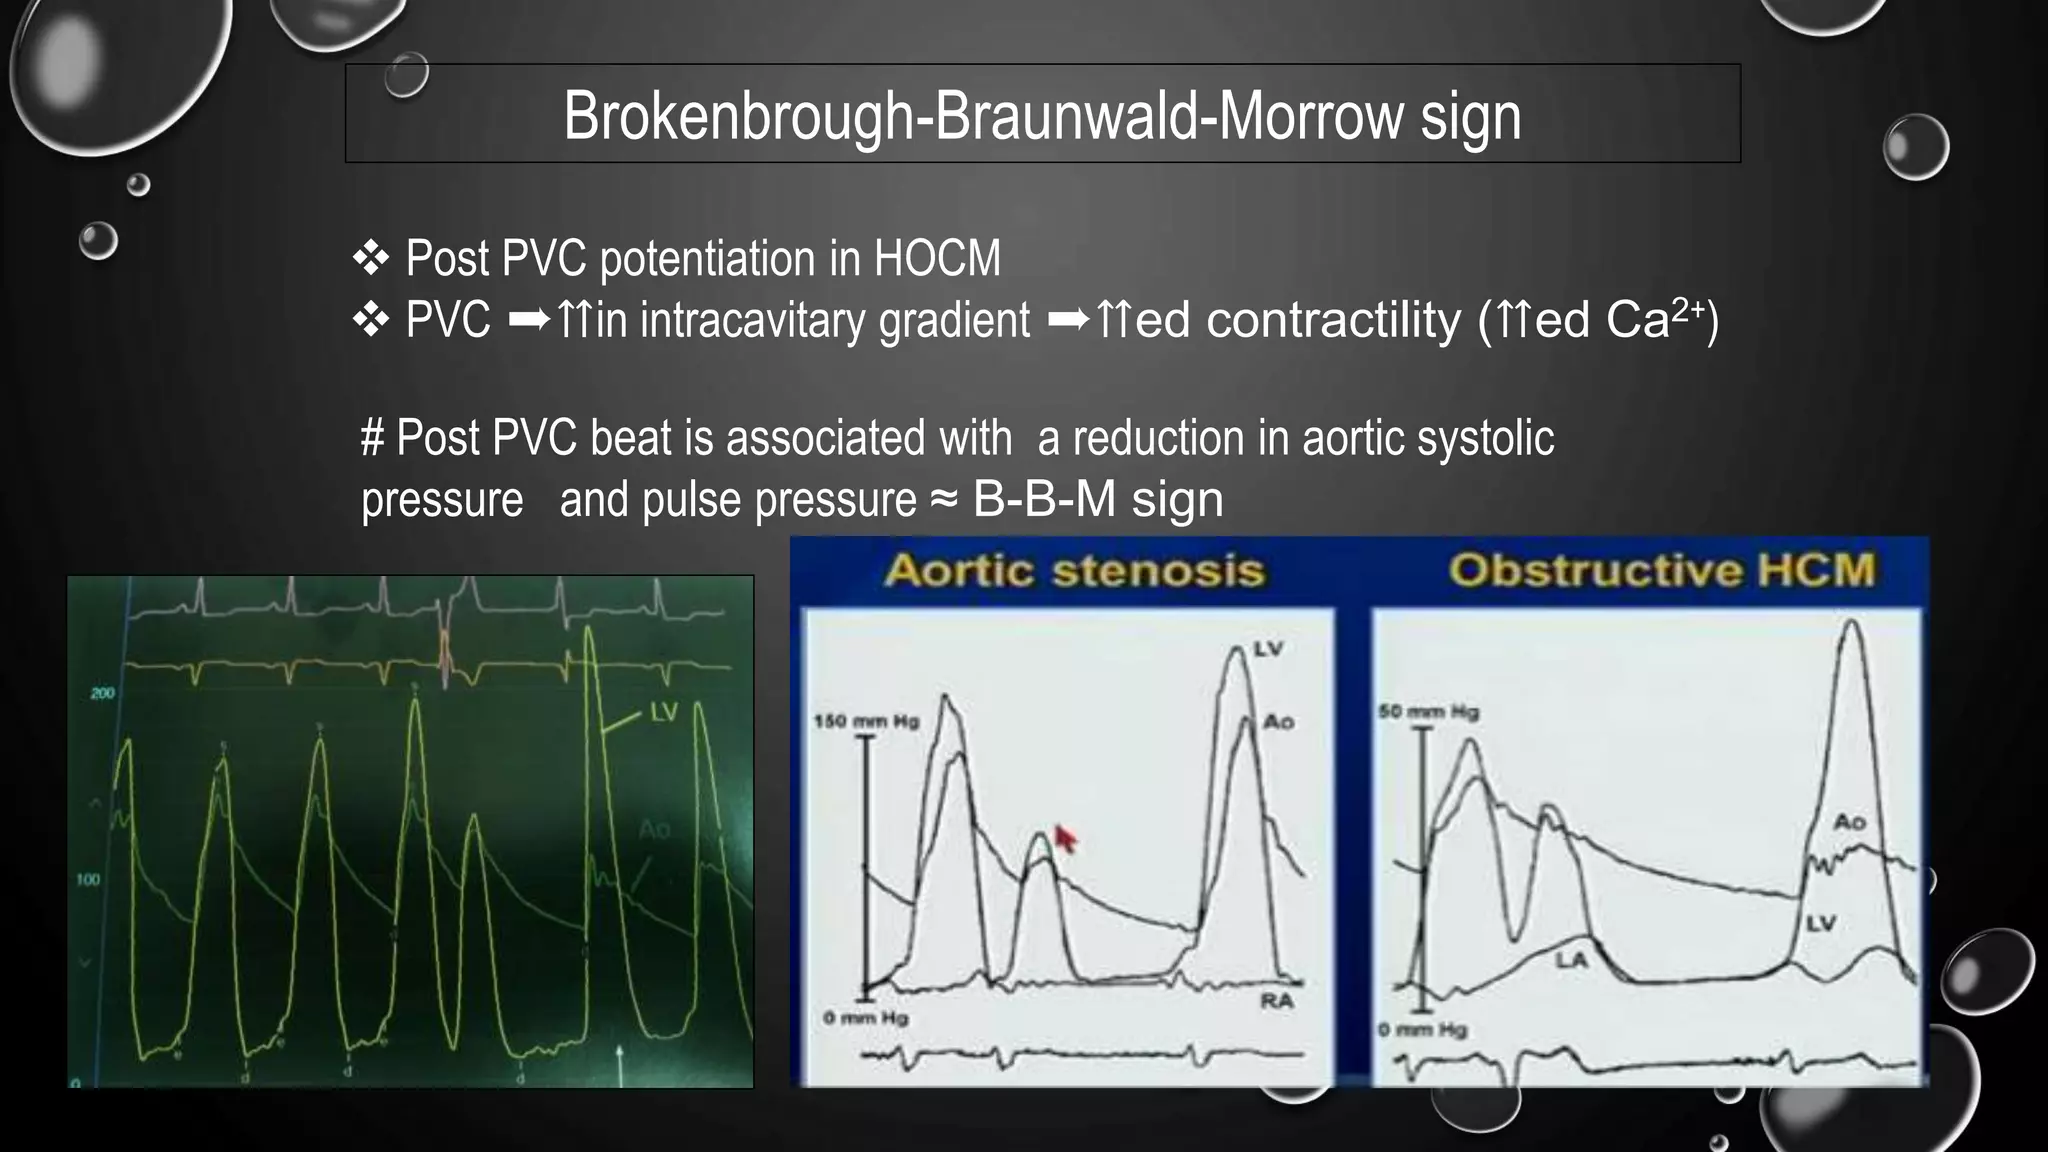


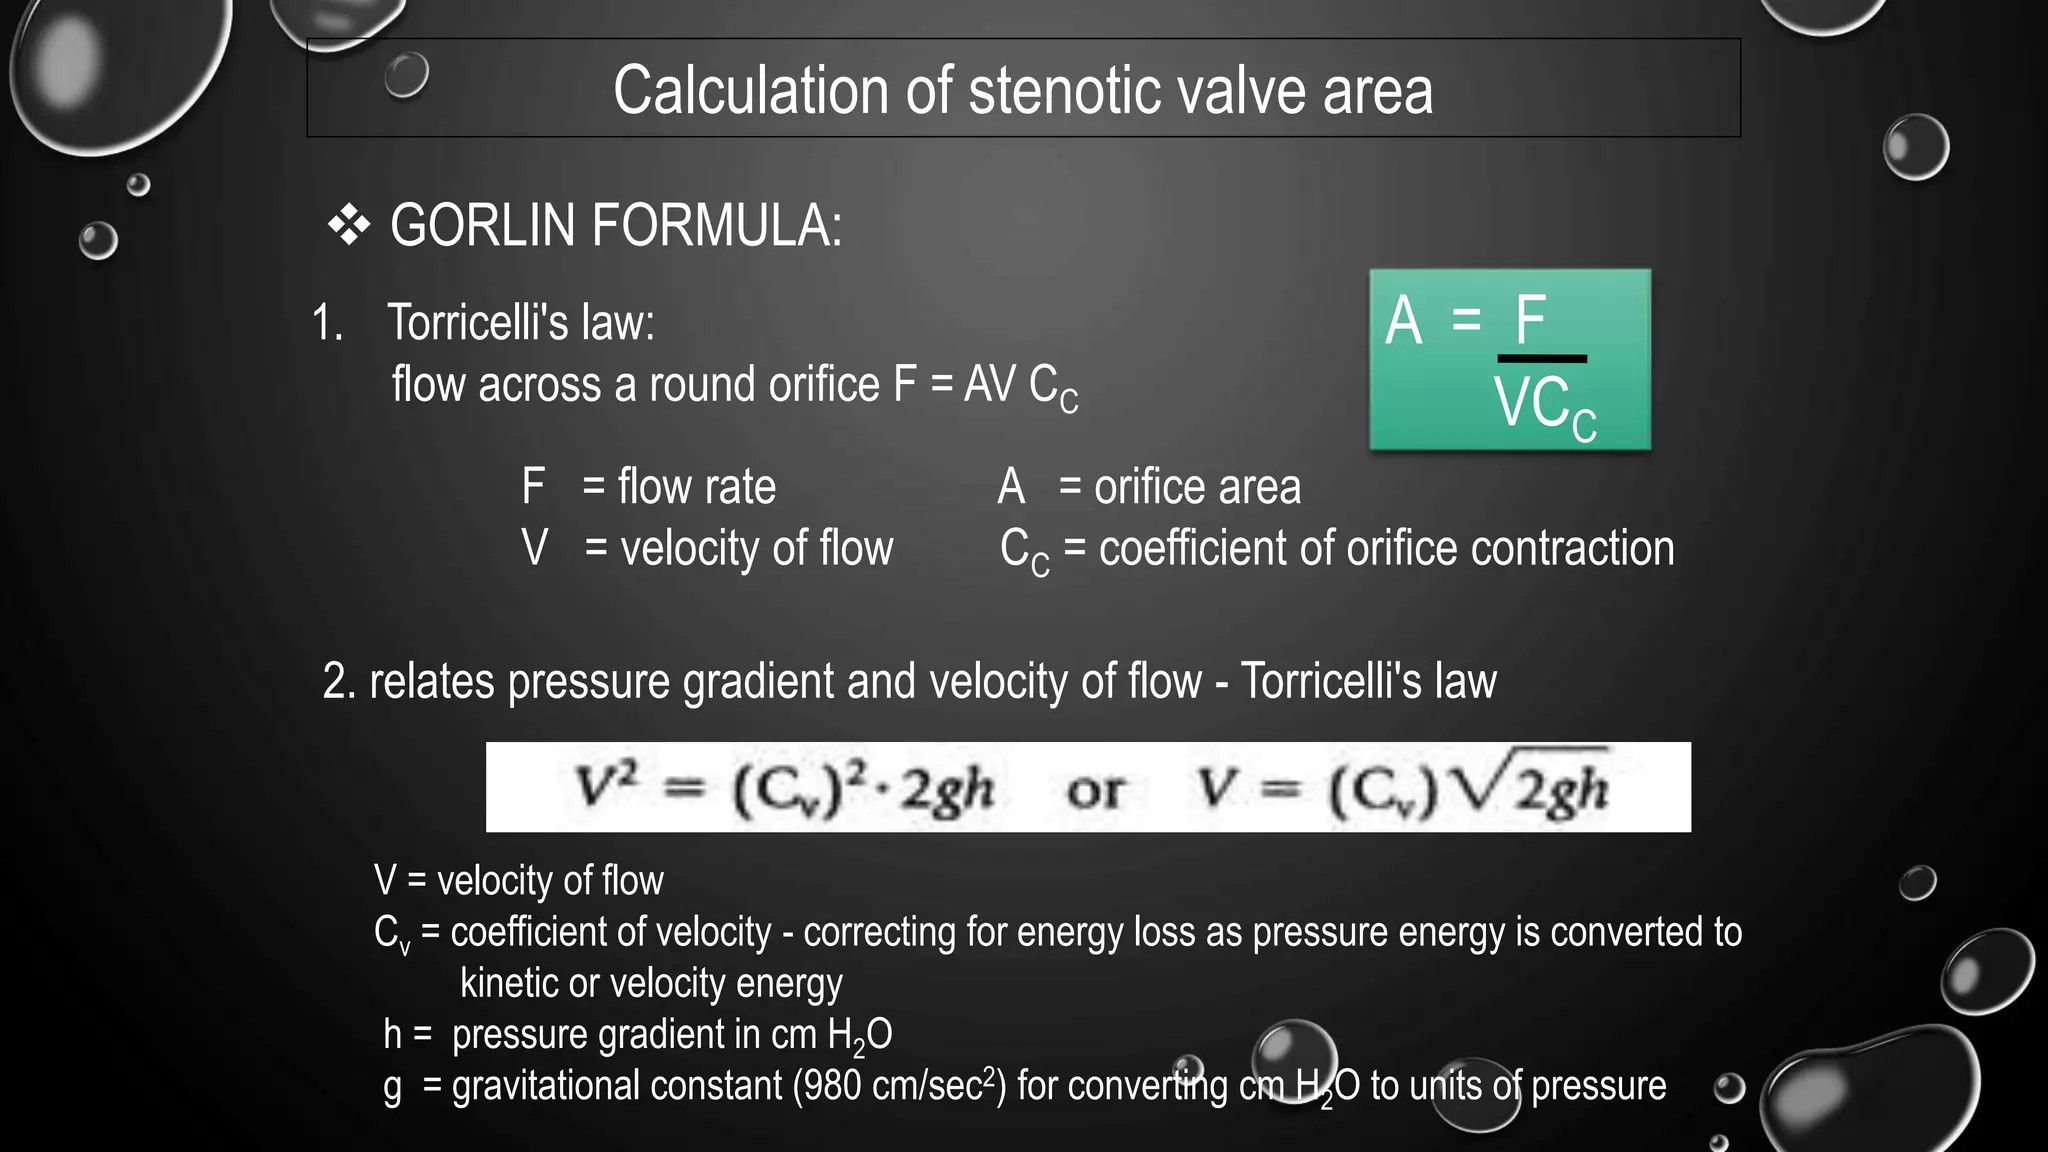


1) Cardiac catheterization can provide key information about aortic stenosis including transvalvular pressure gradients, the level of stenosis, and estimation of valve area. 2) Low-flow, low-gradient aortic stenosis can be further classified as either having a decreased ejection fraction or a paradoxically normal ejection fraction. 3) In hypertrophic cardiomyopathy, cardiac catheterization can identify dynamic intraventricular pressure gradients that may only be provoked with maneuvers like the Valsalva maneuver.