Downloaded 875 times


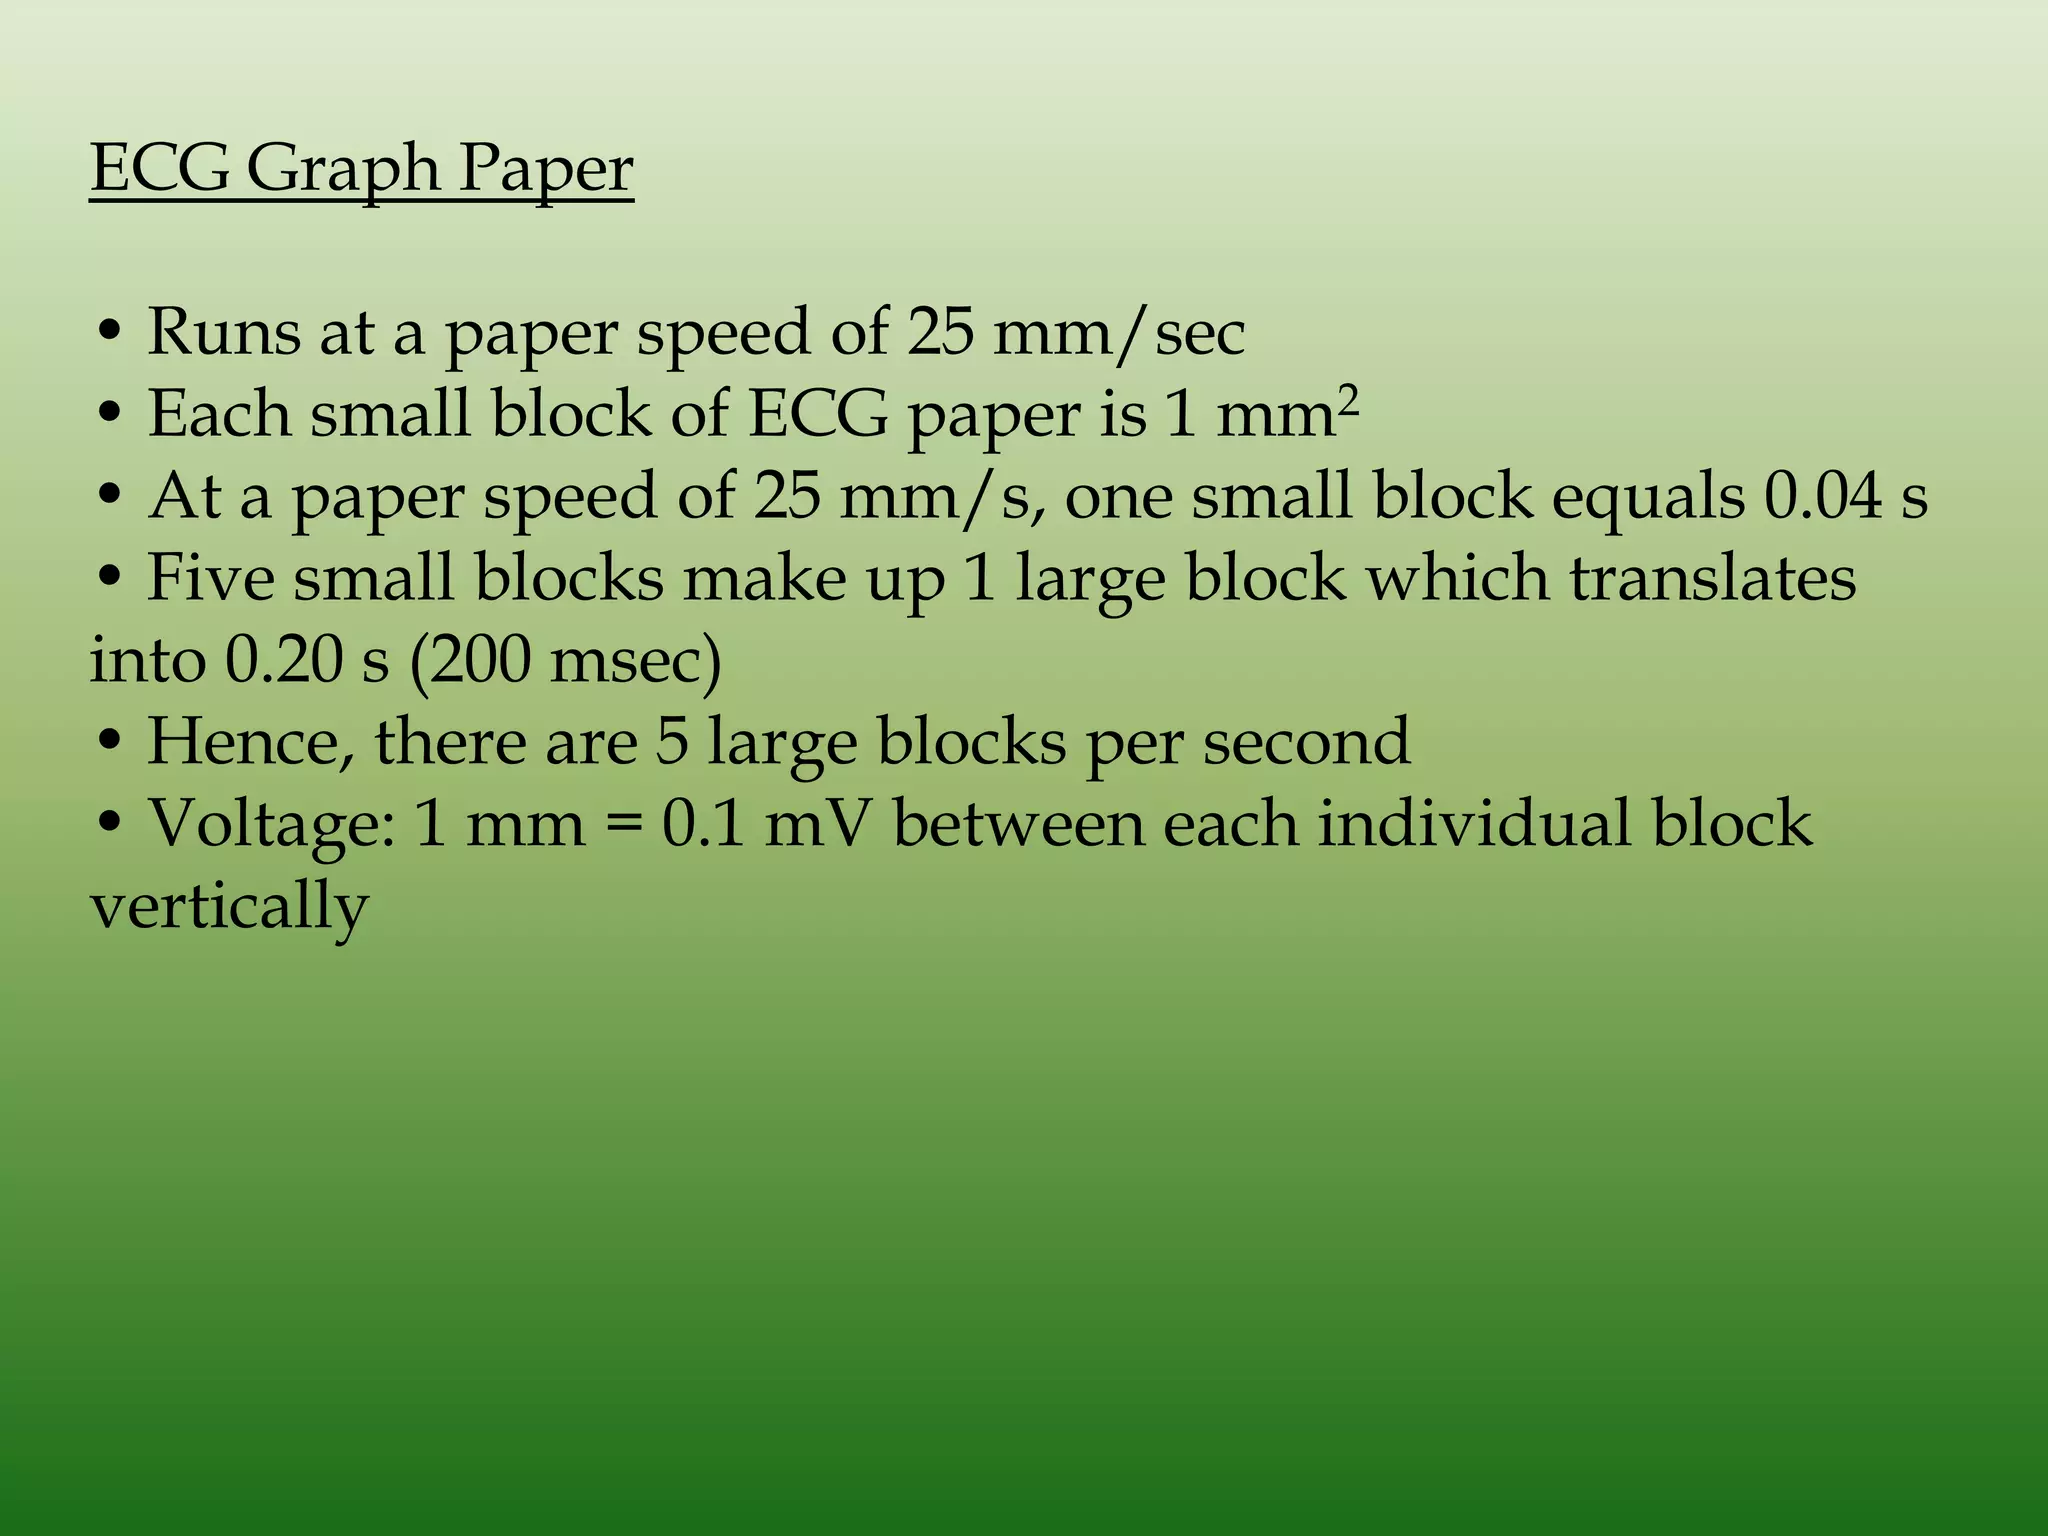


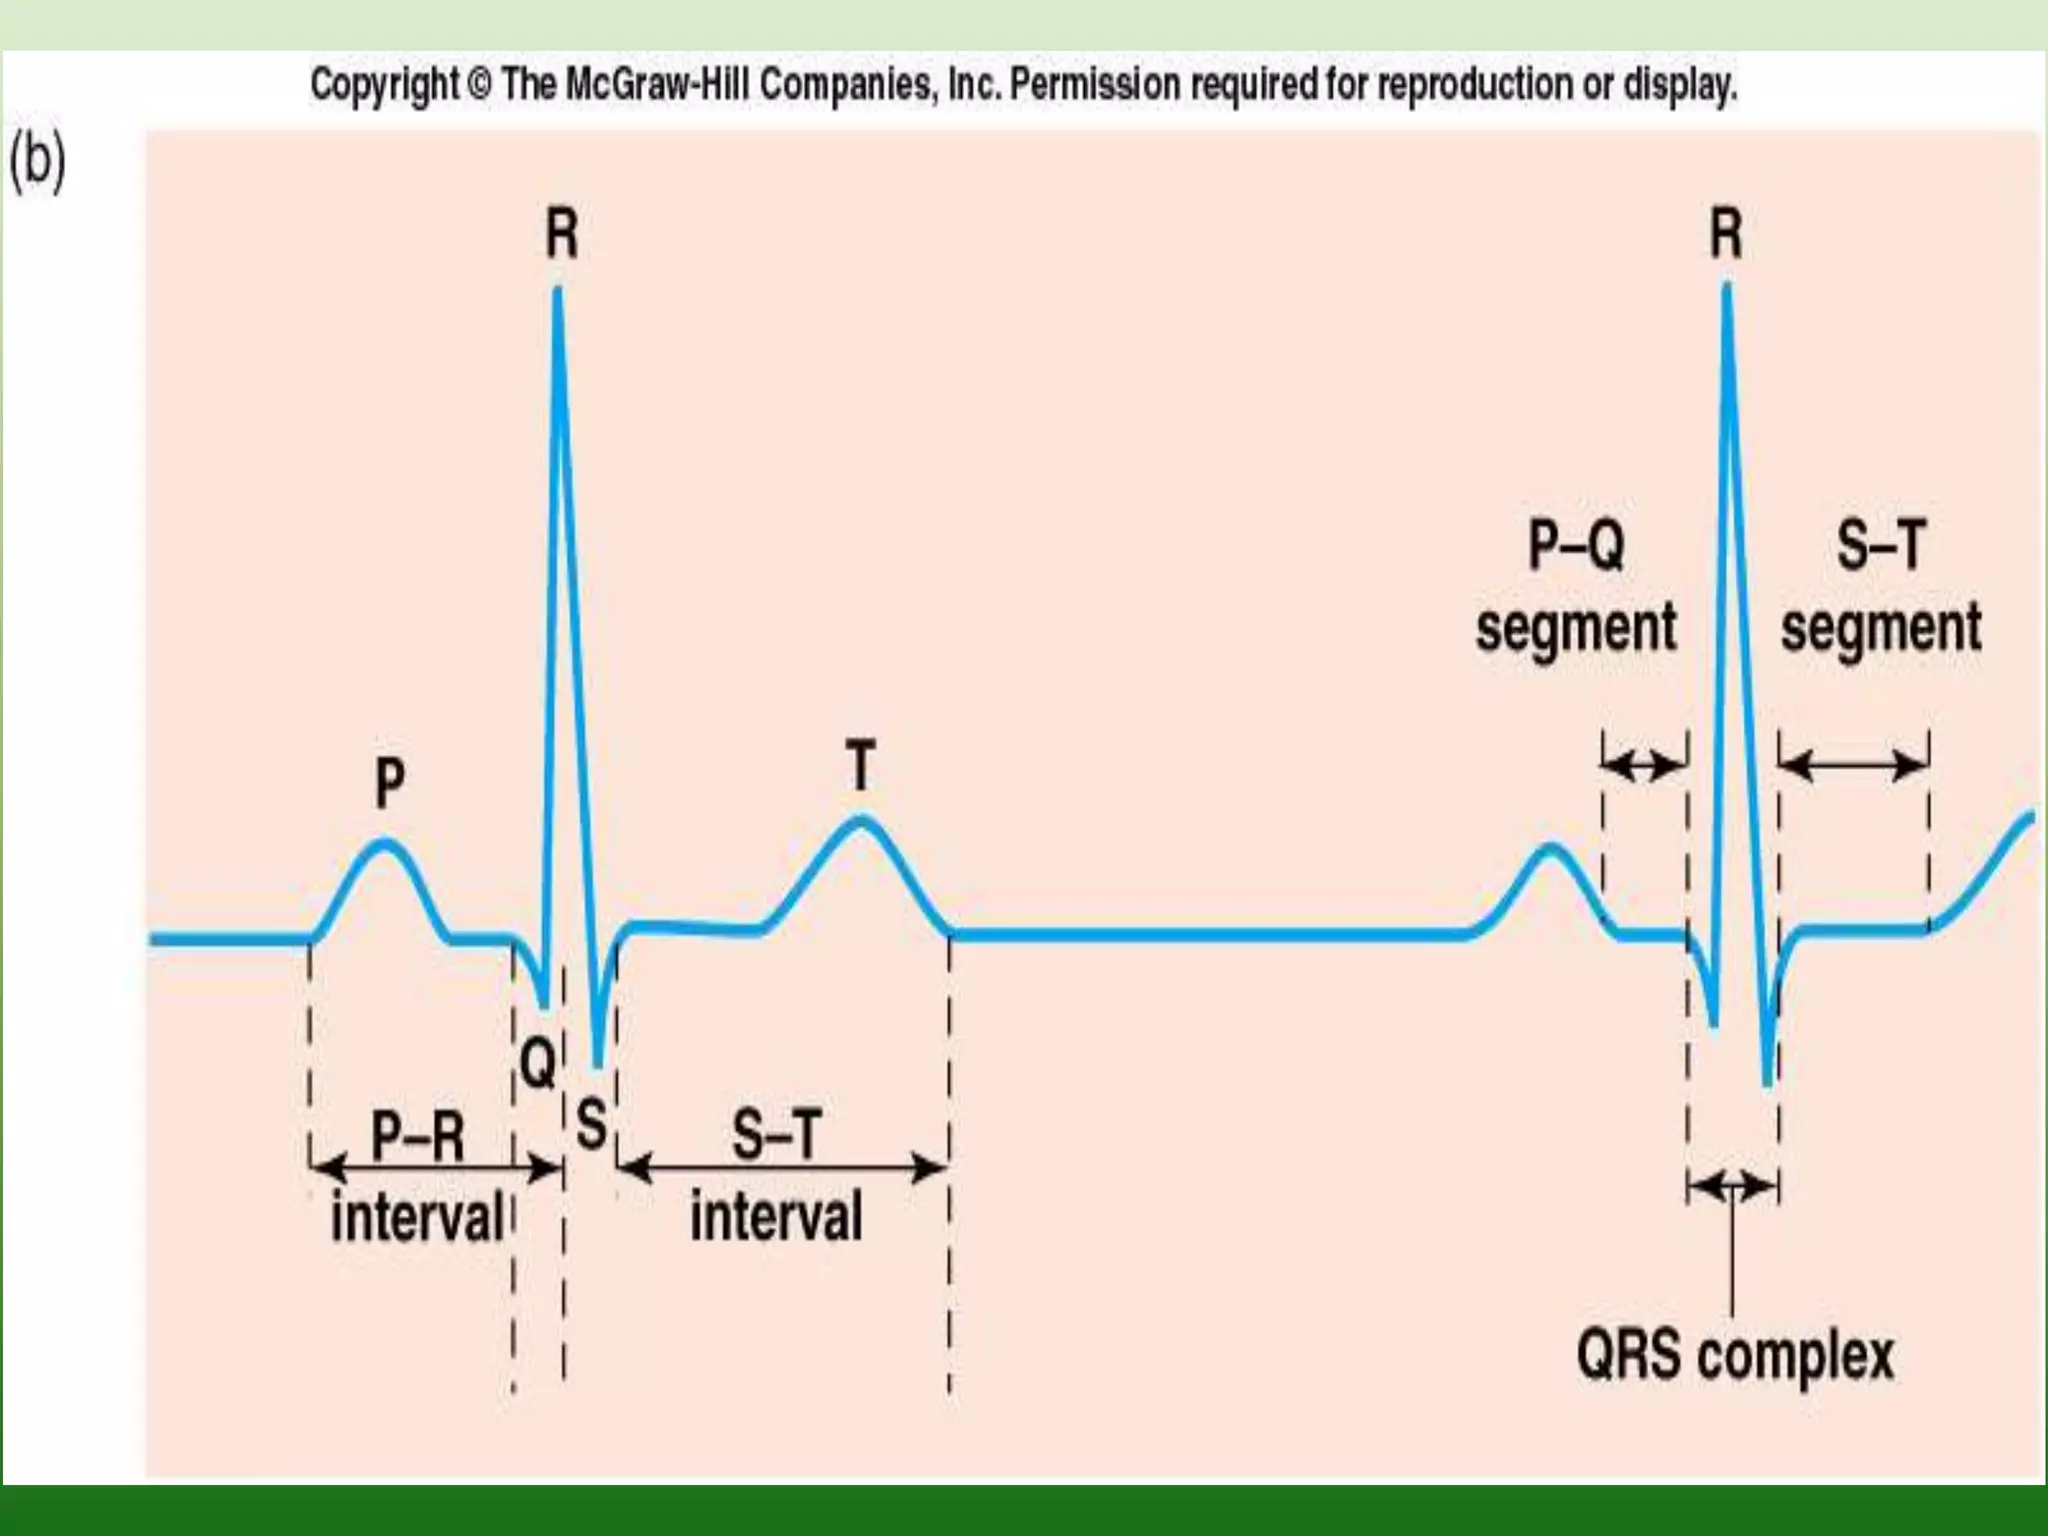


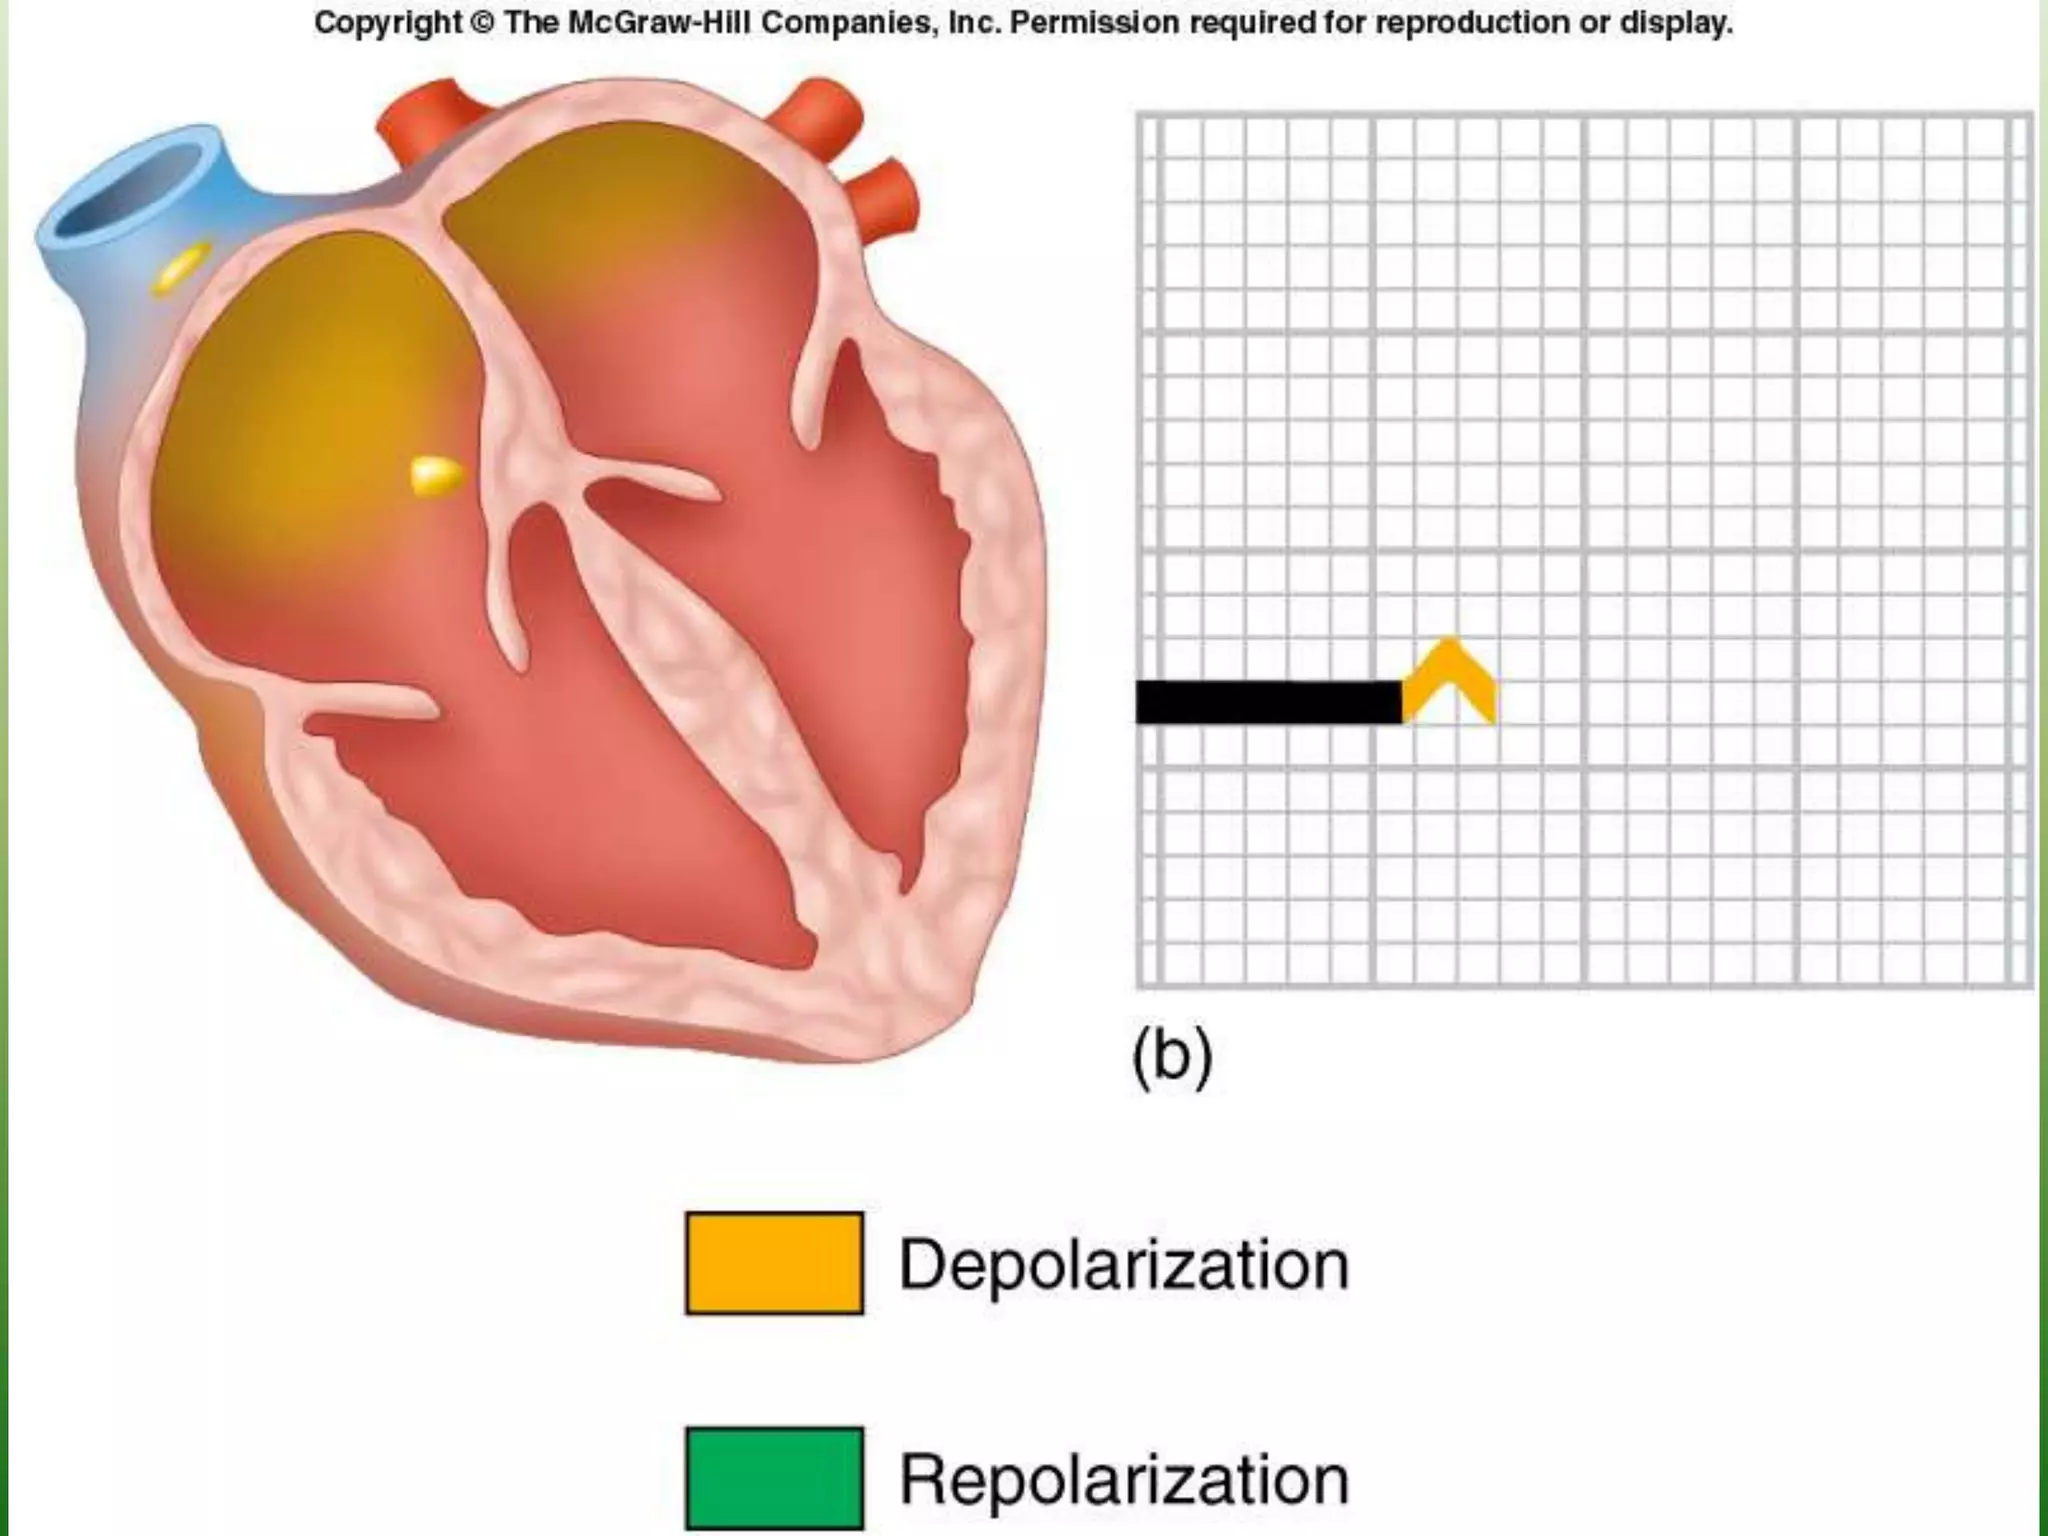


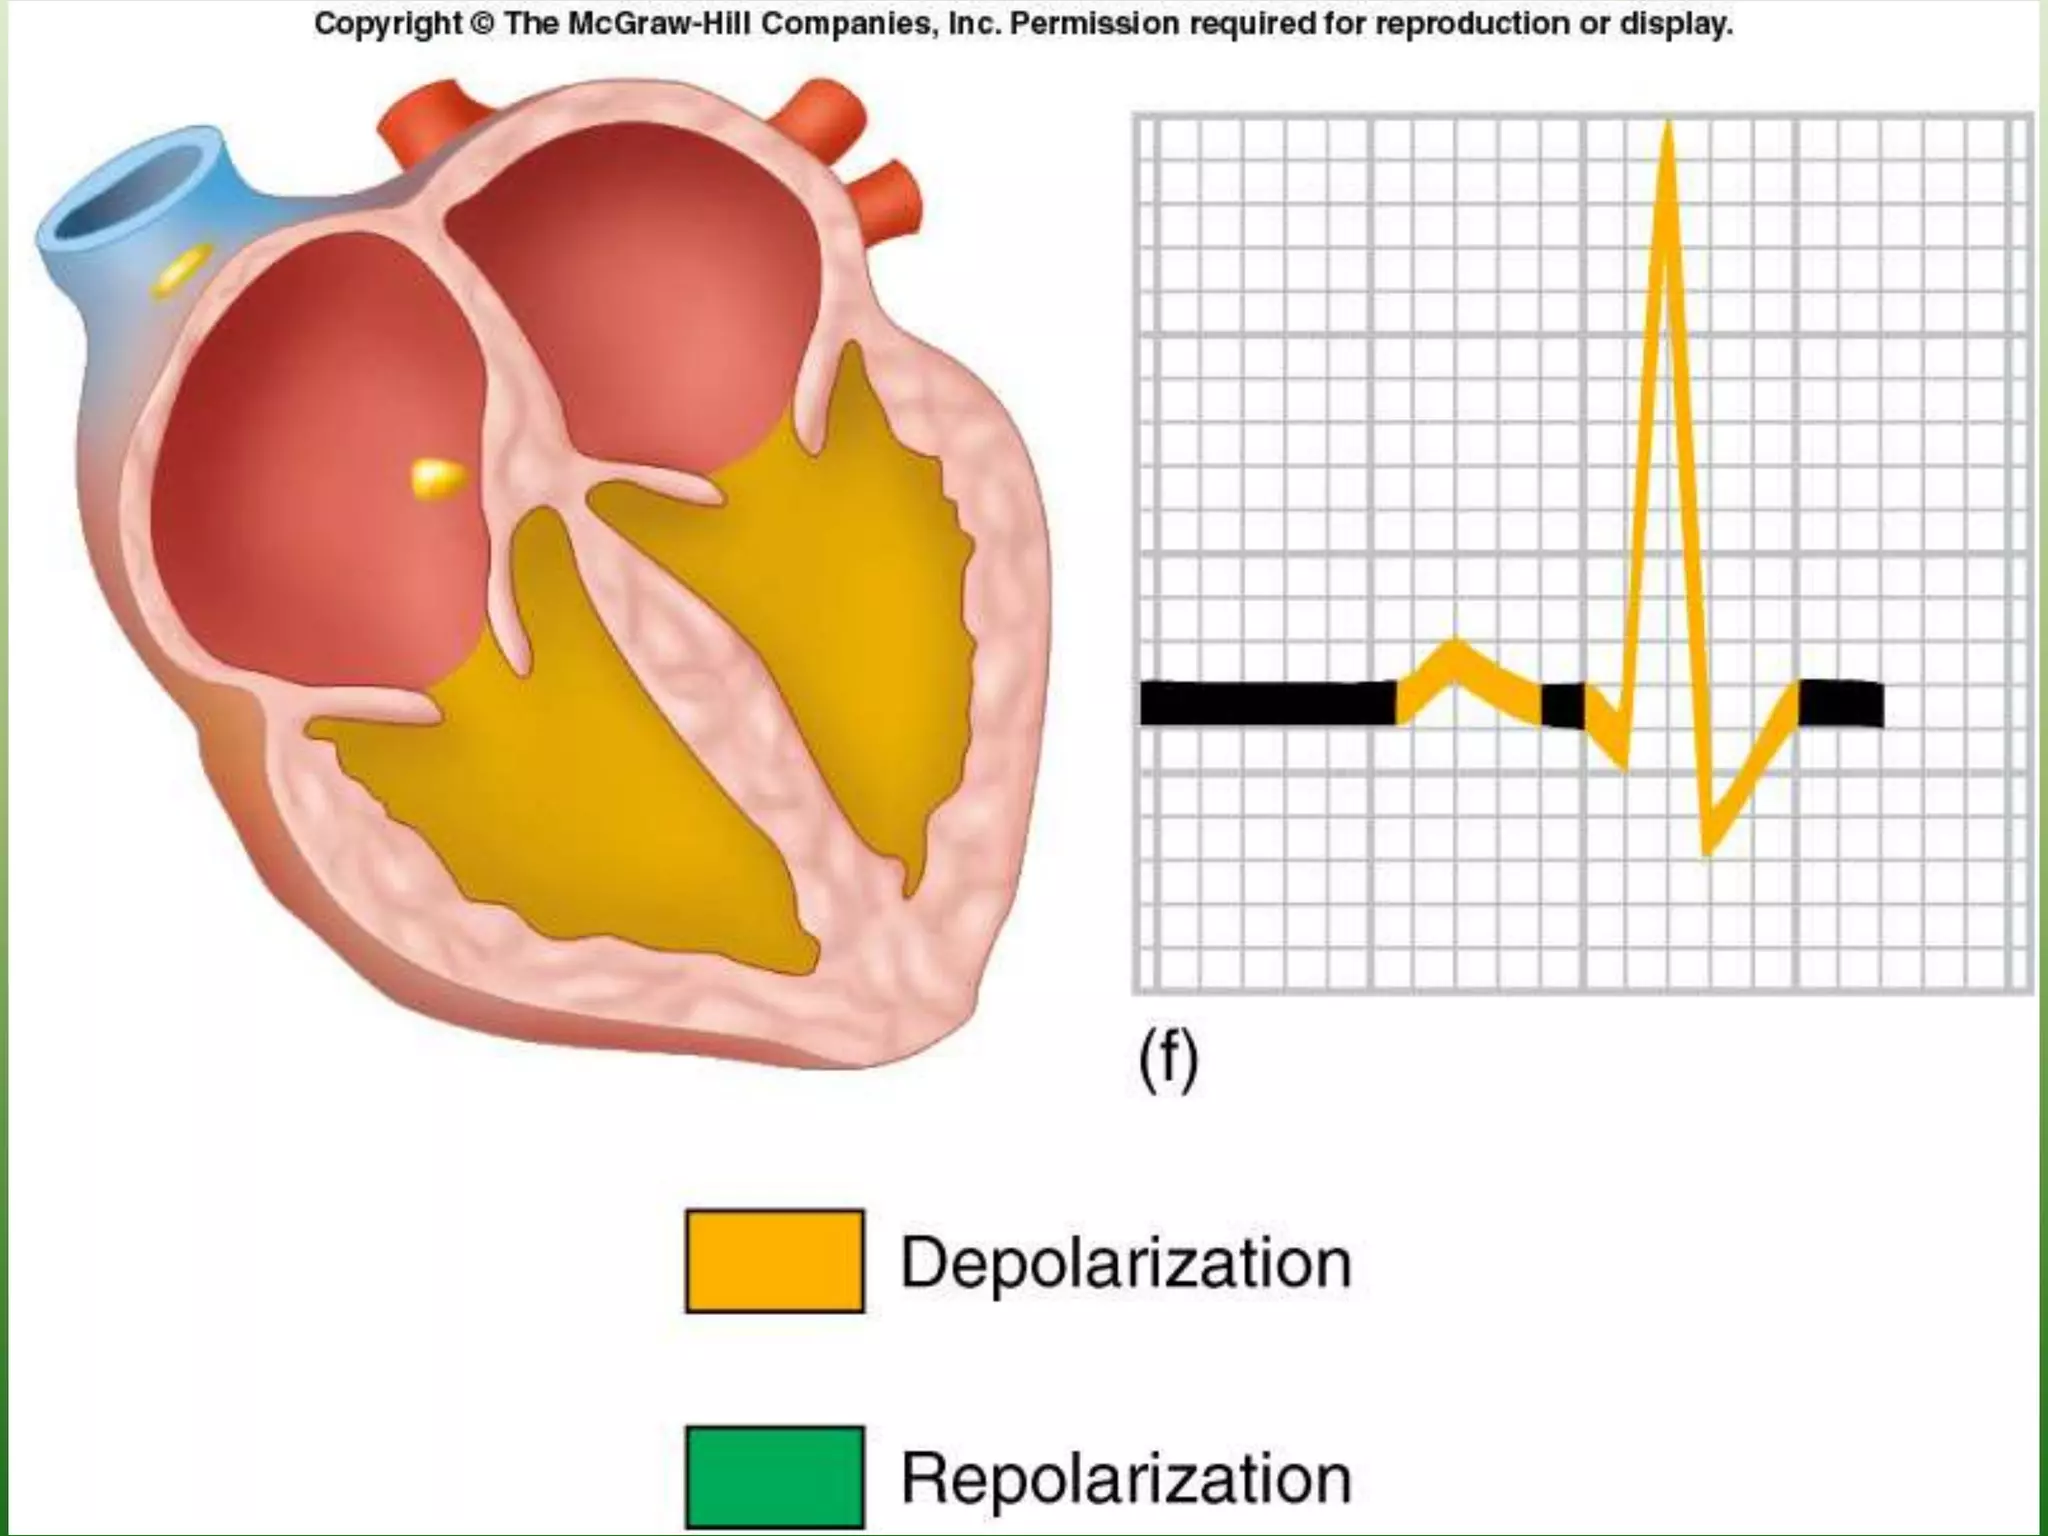


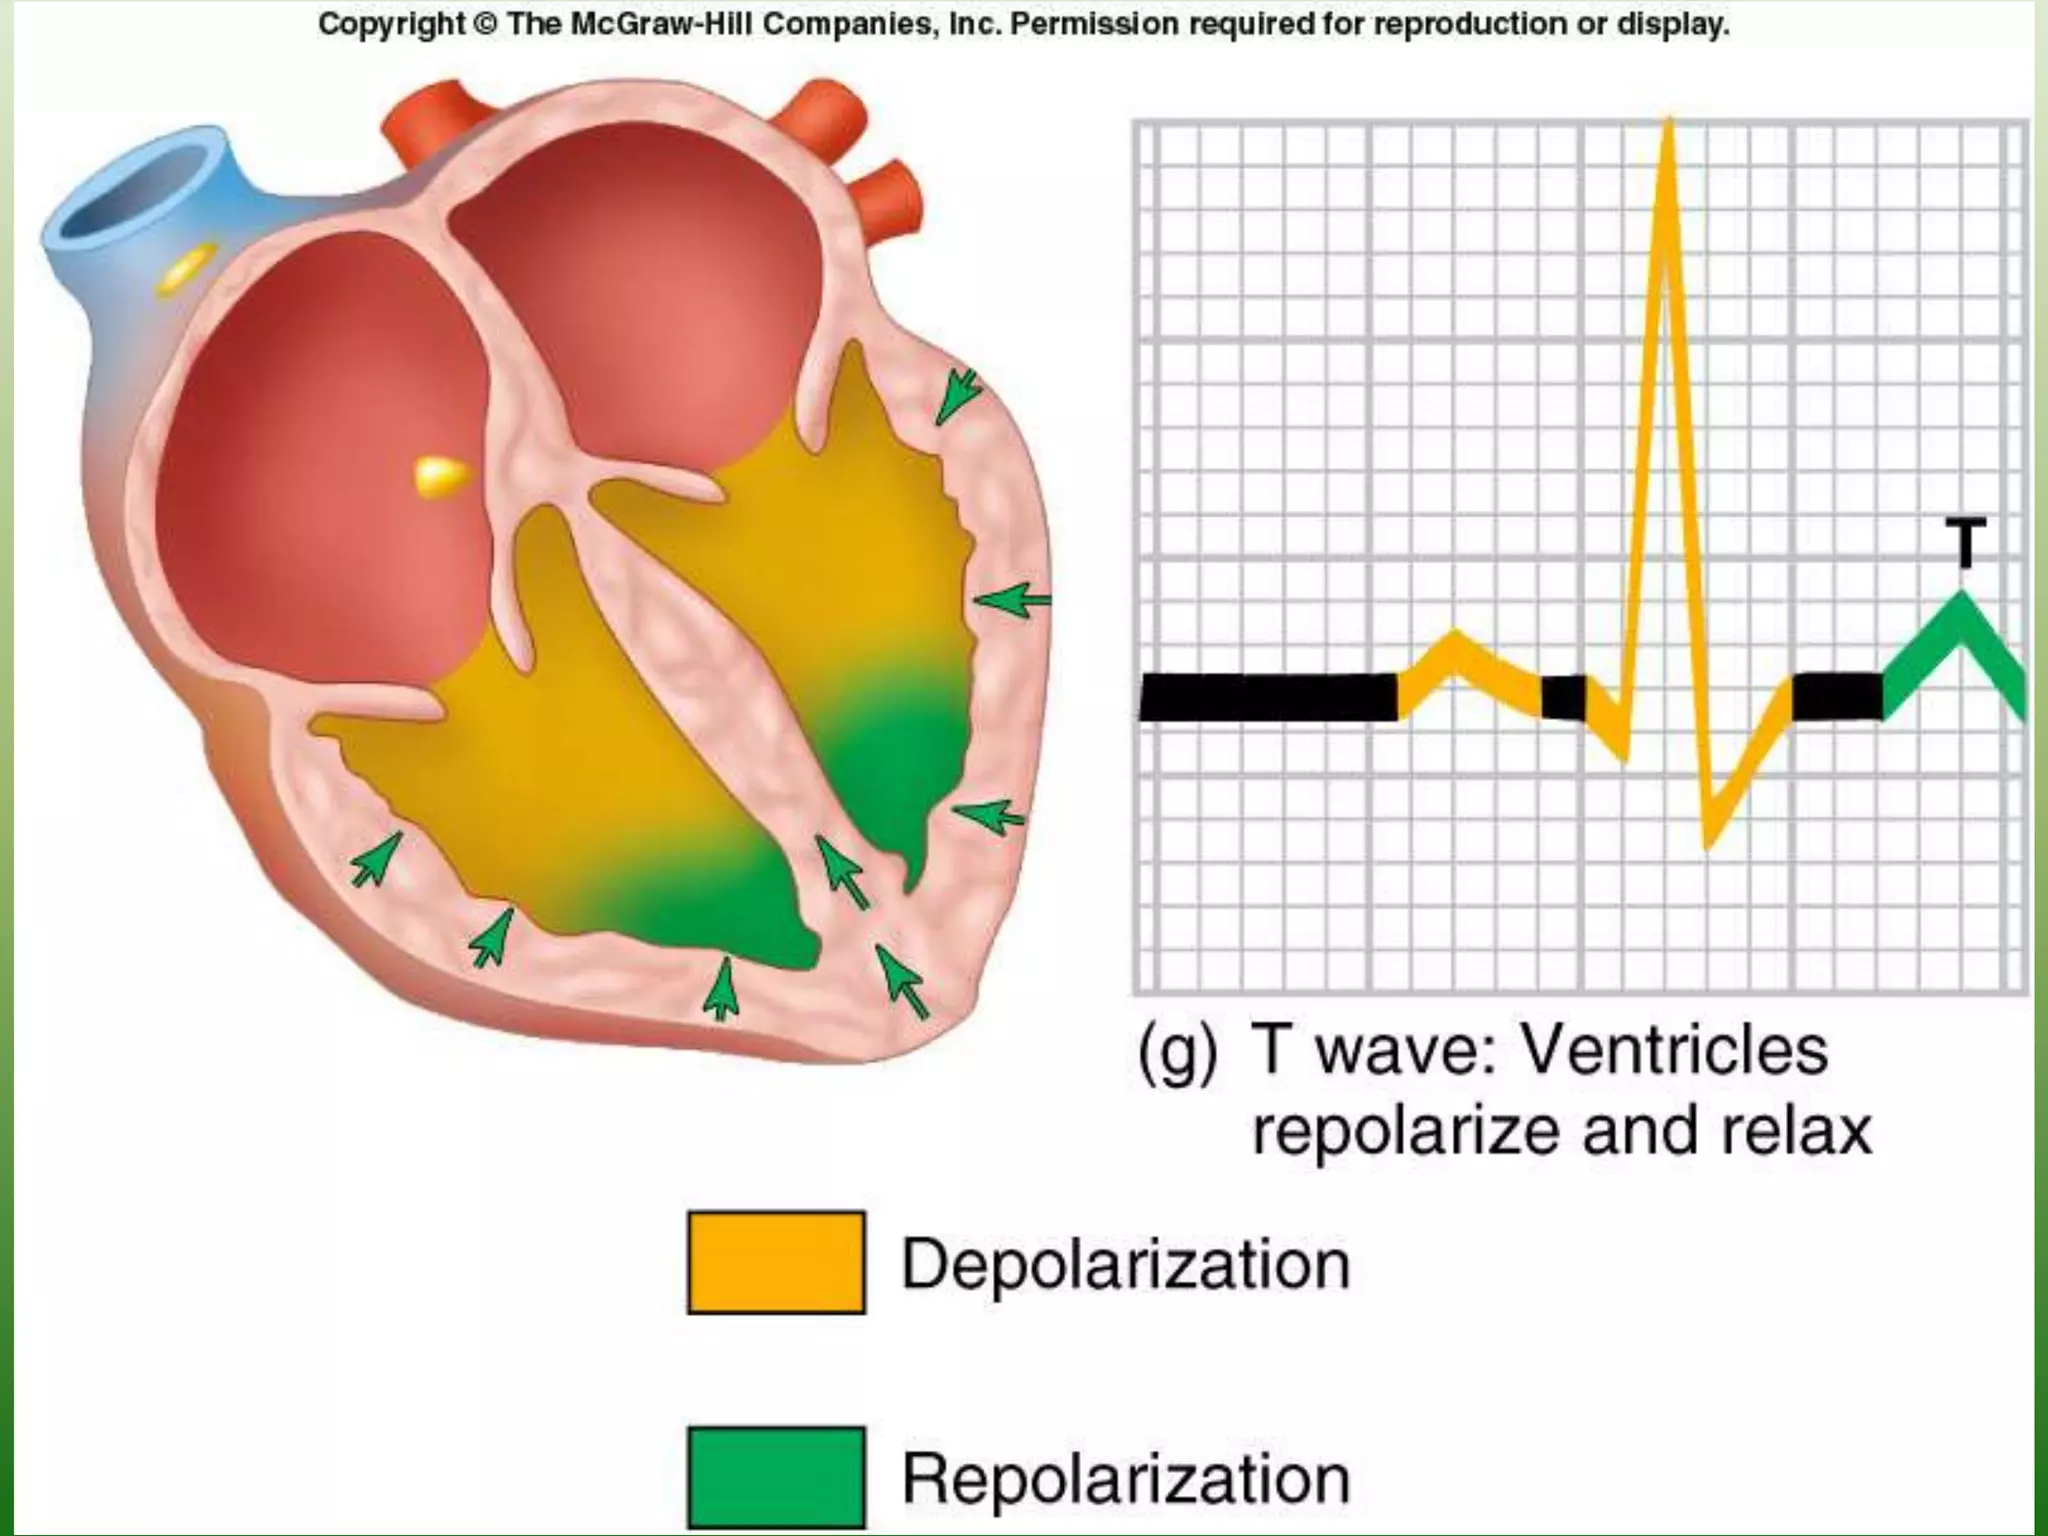


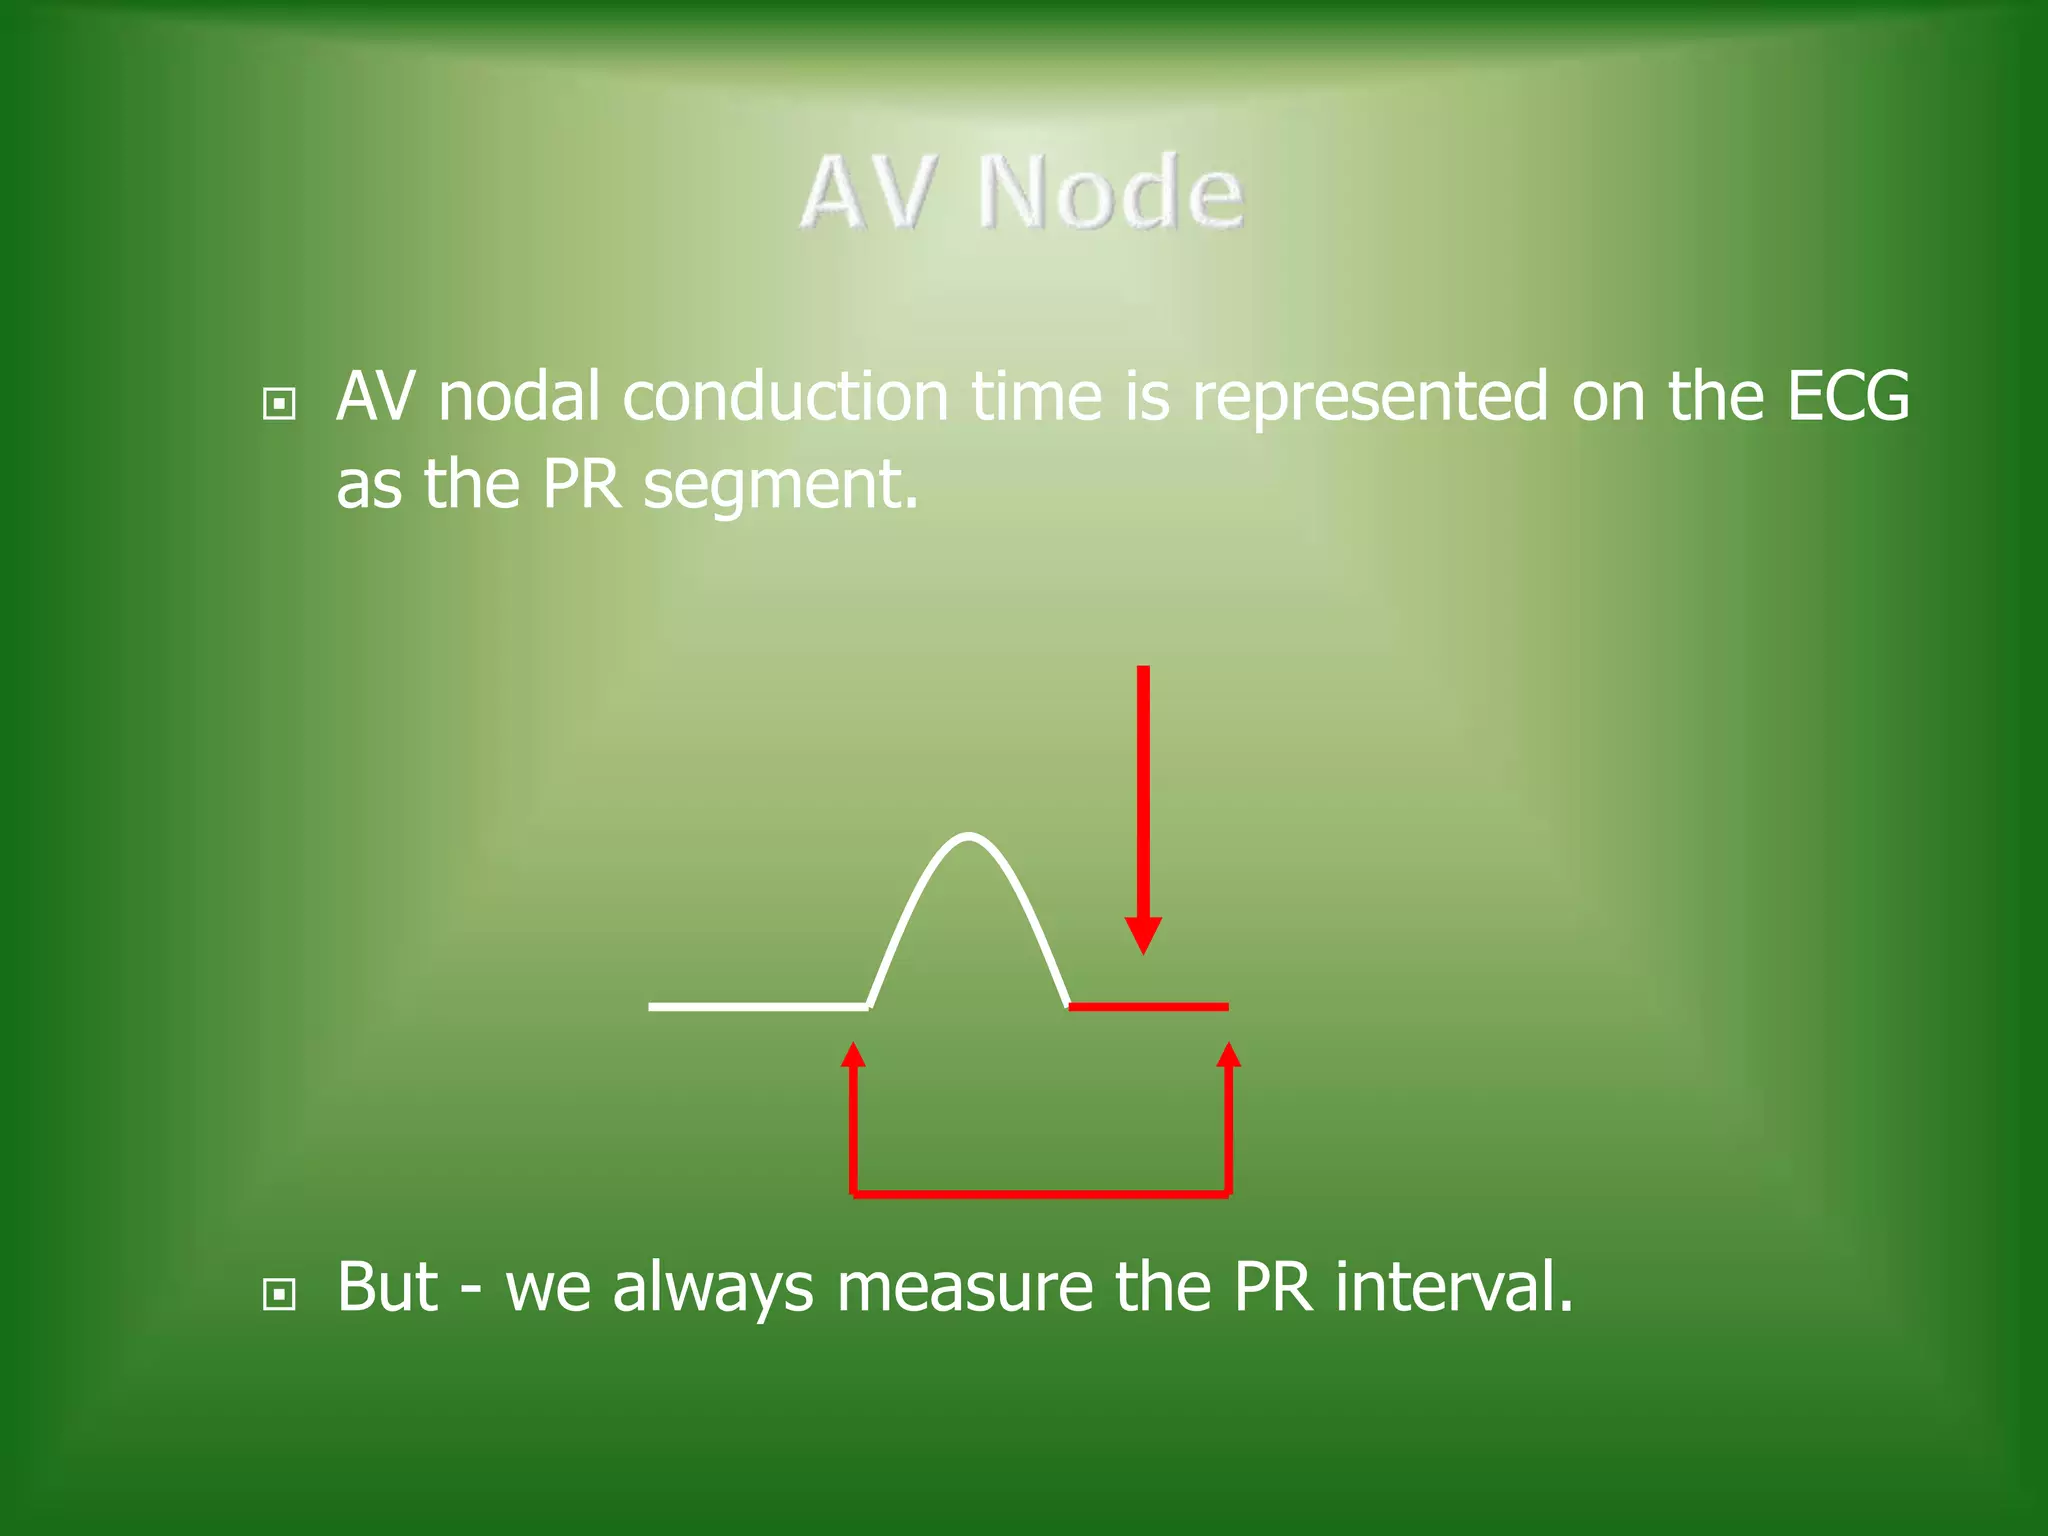


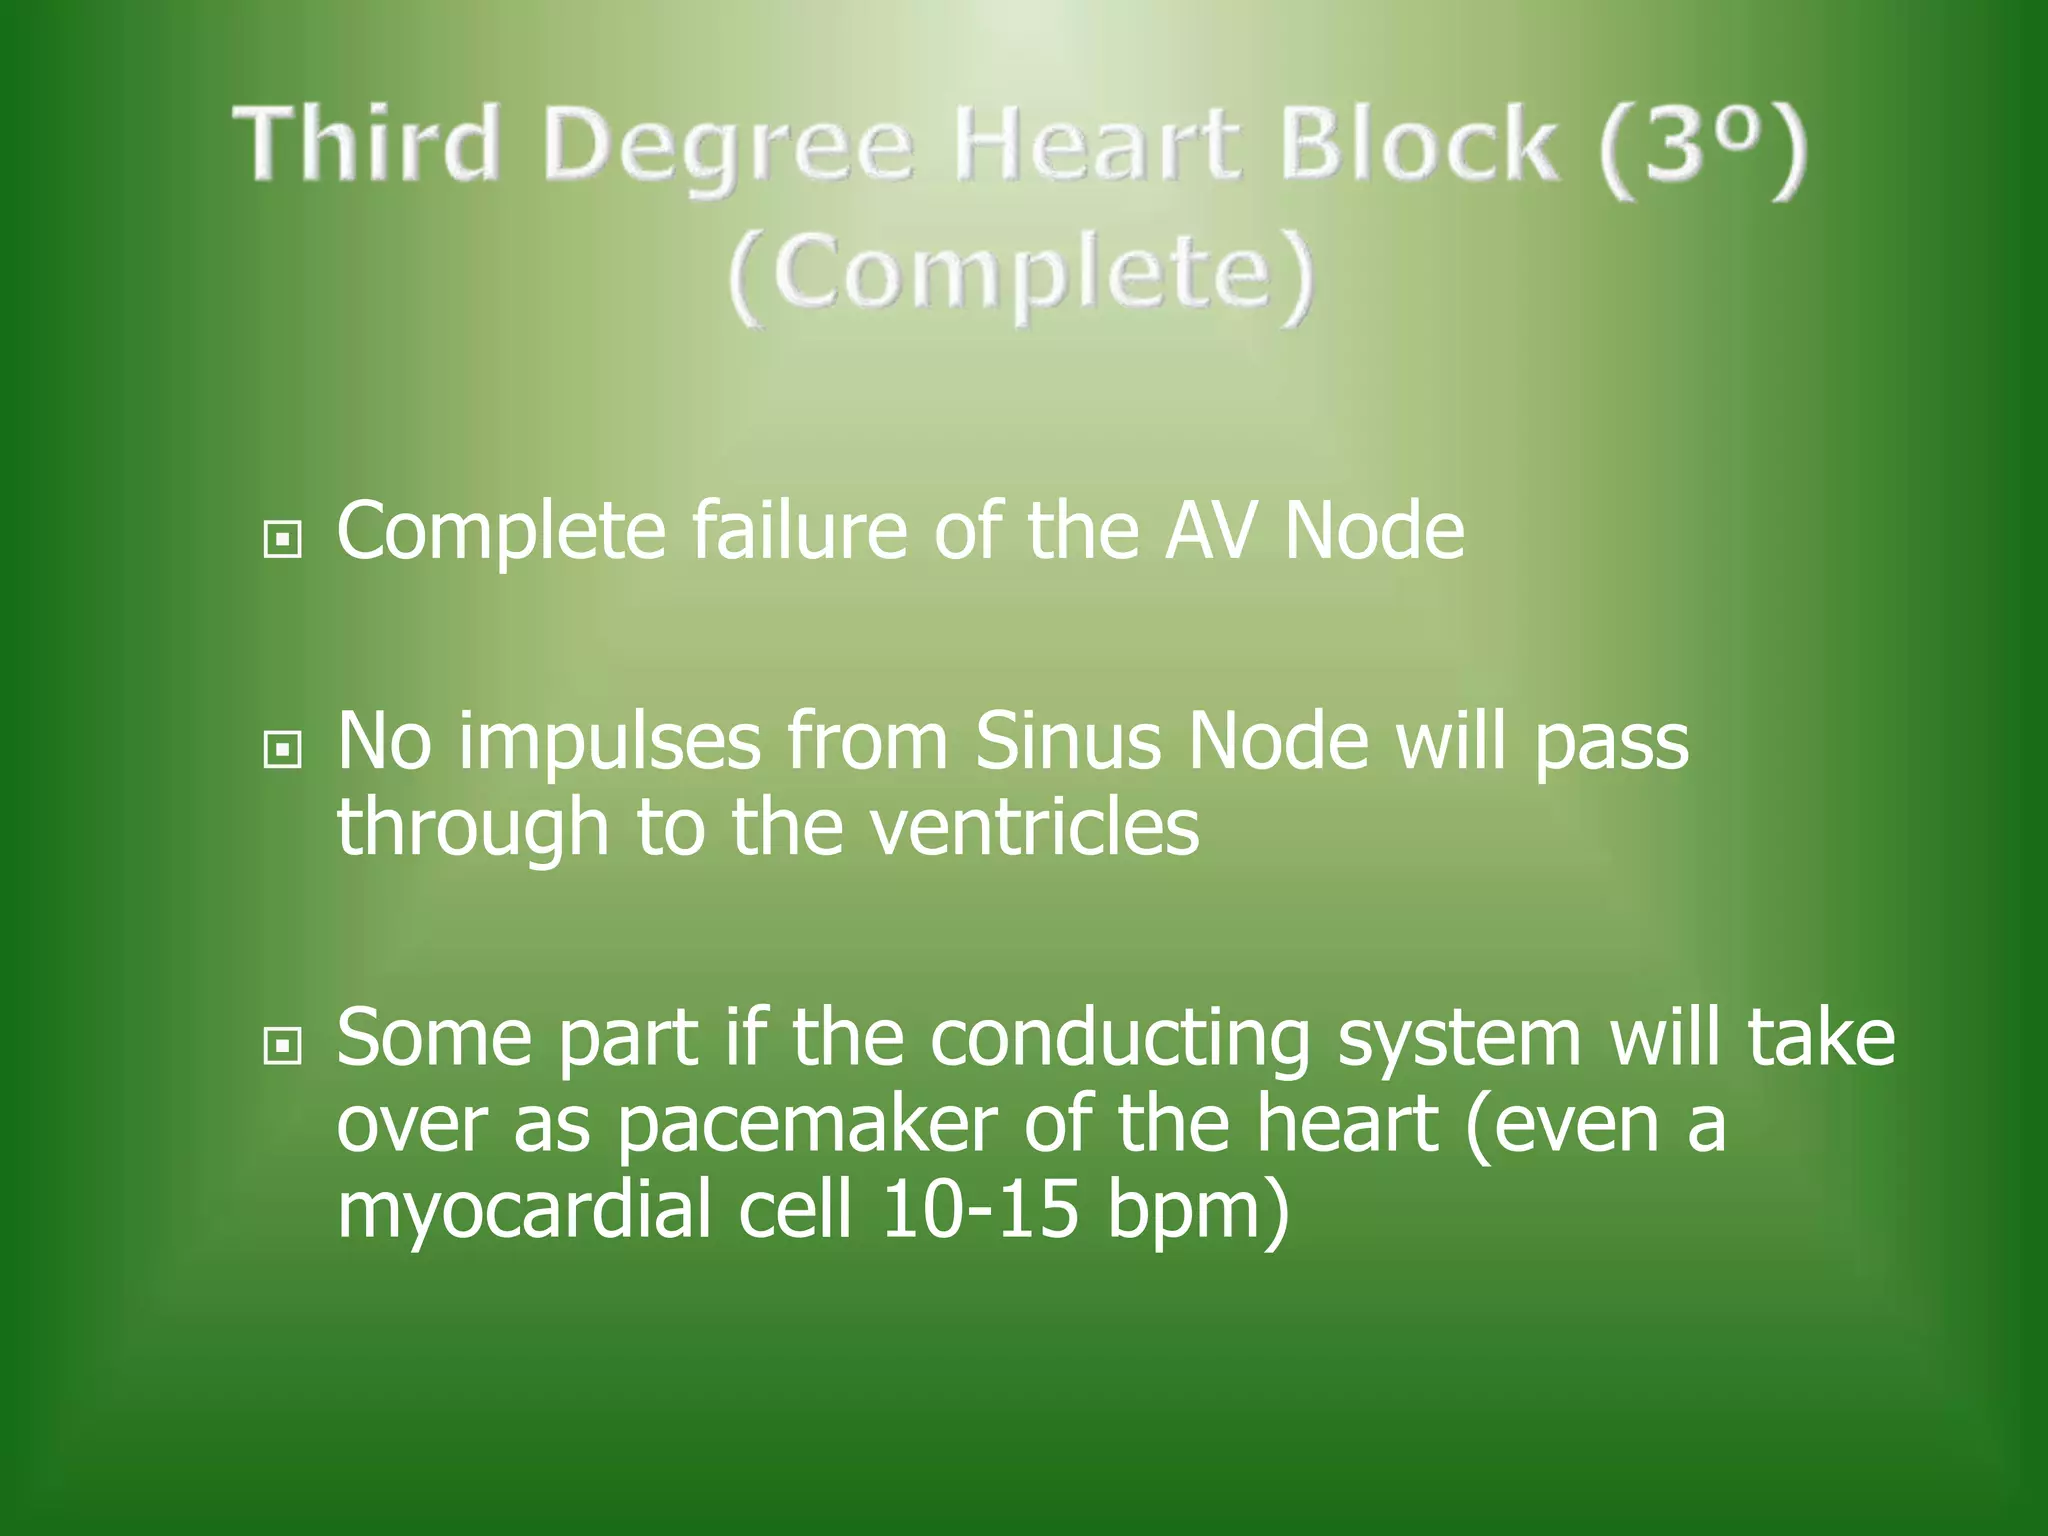

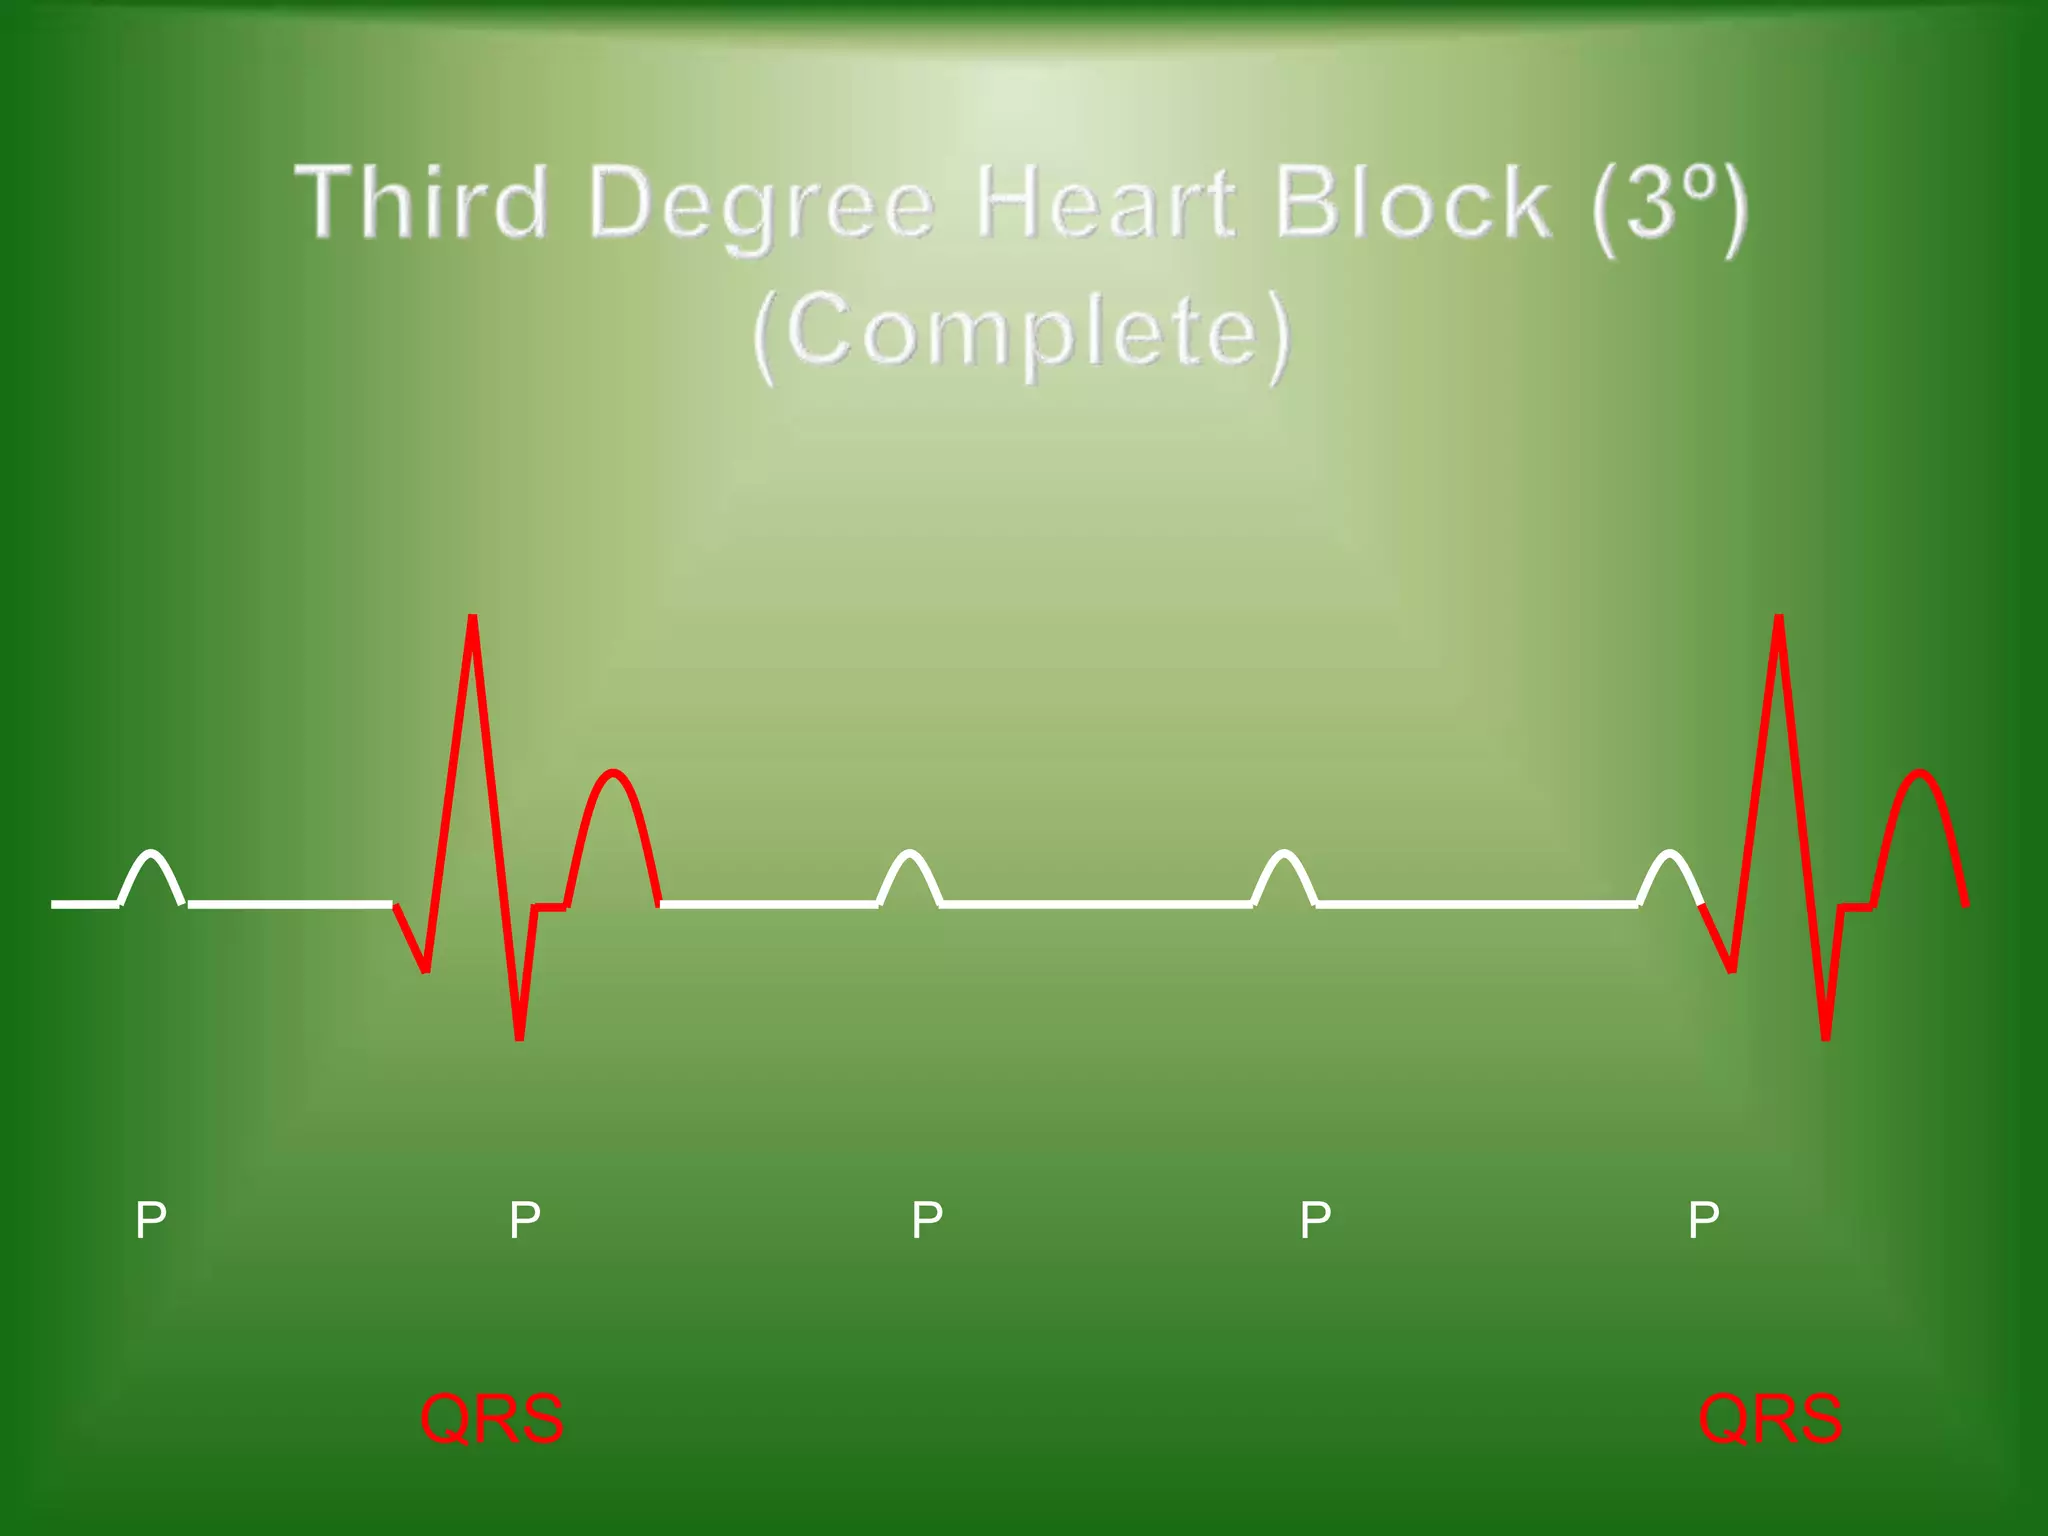
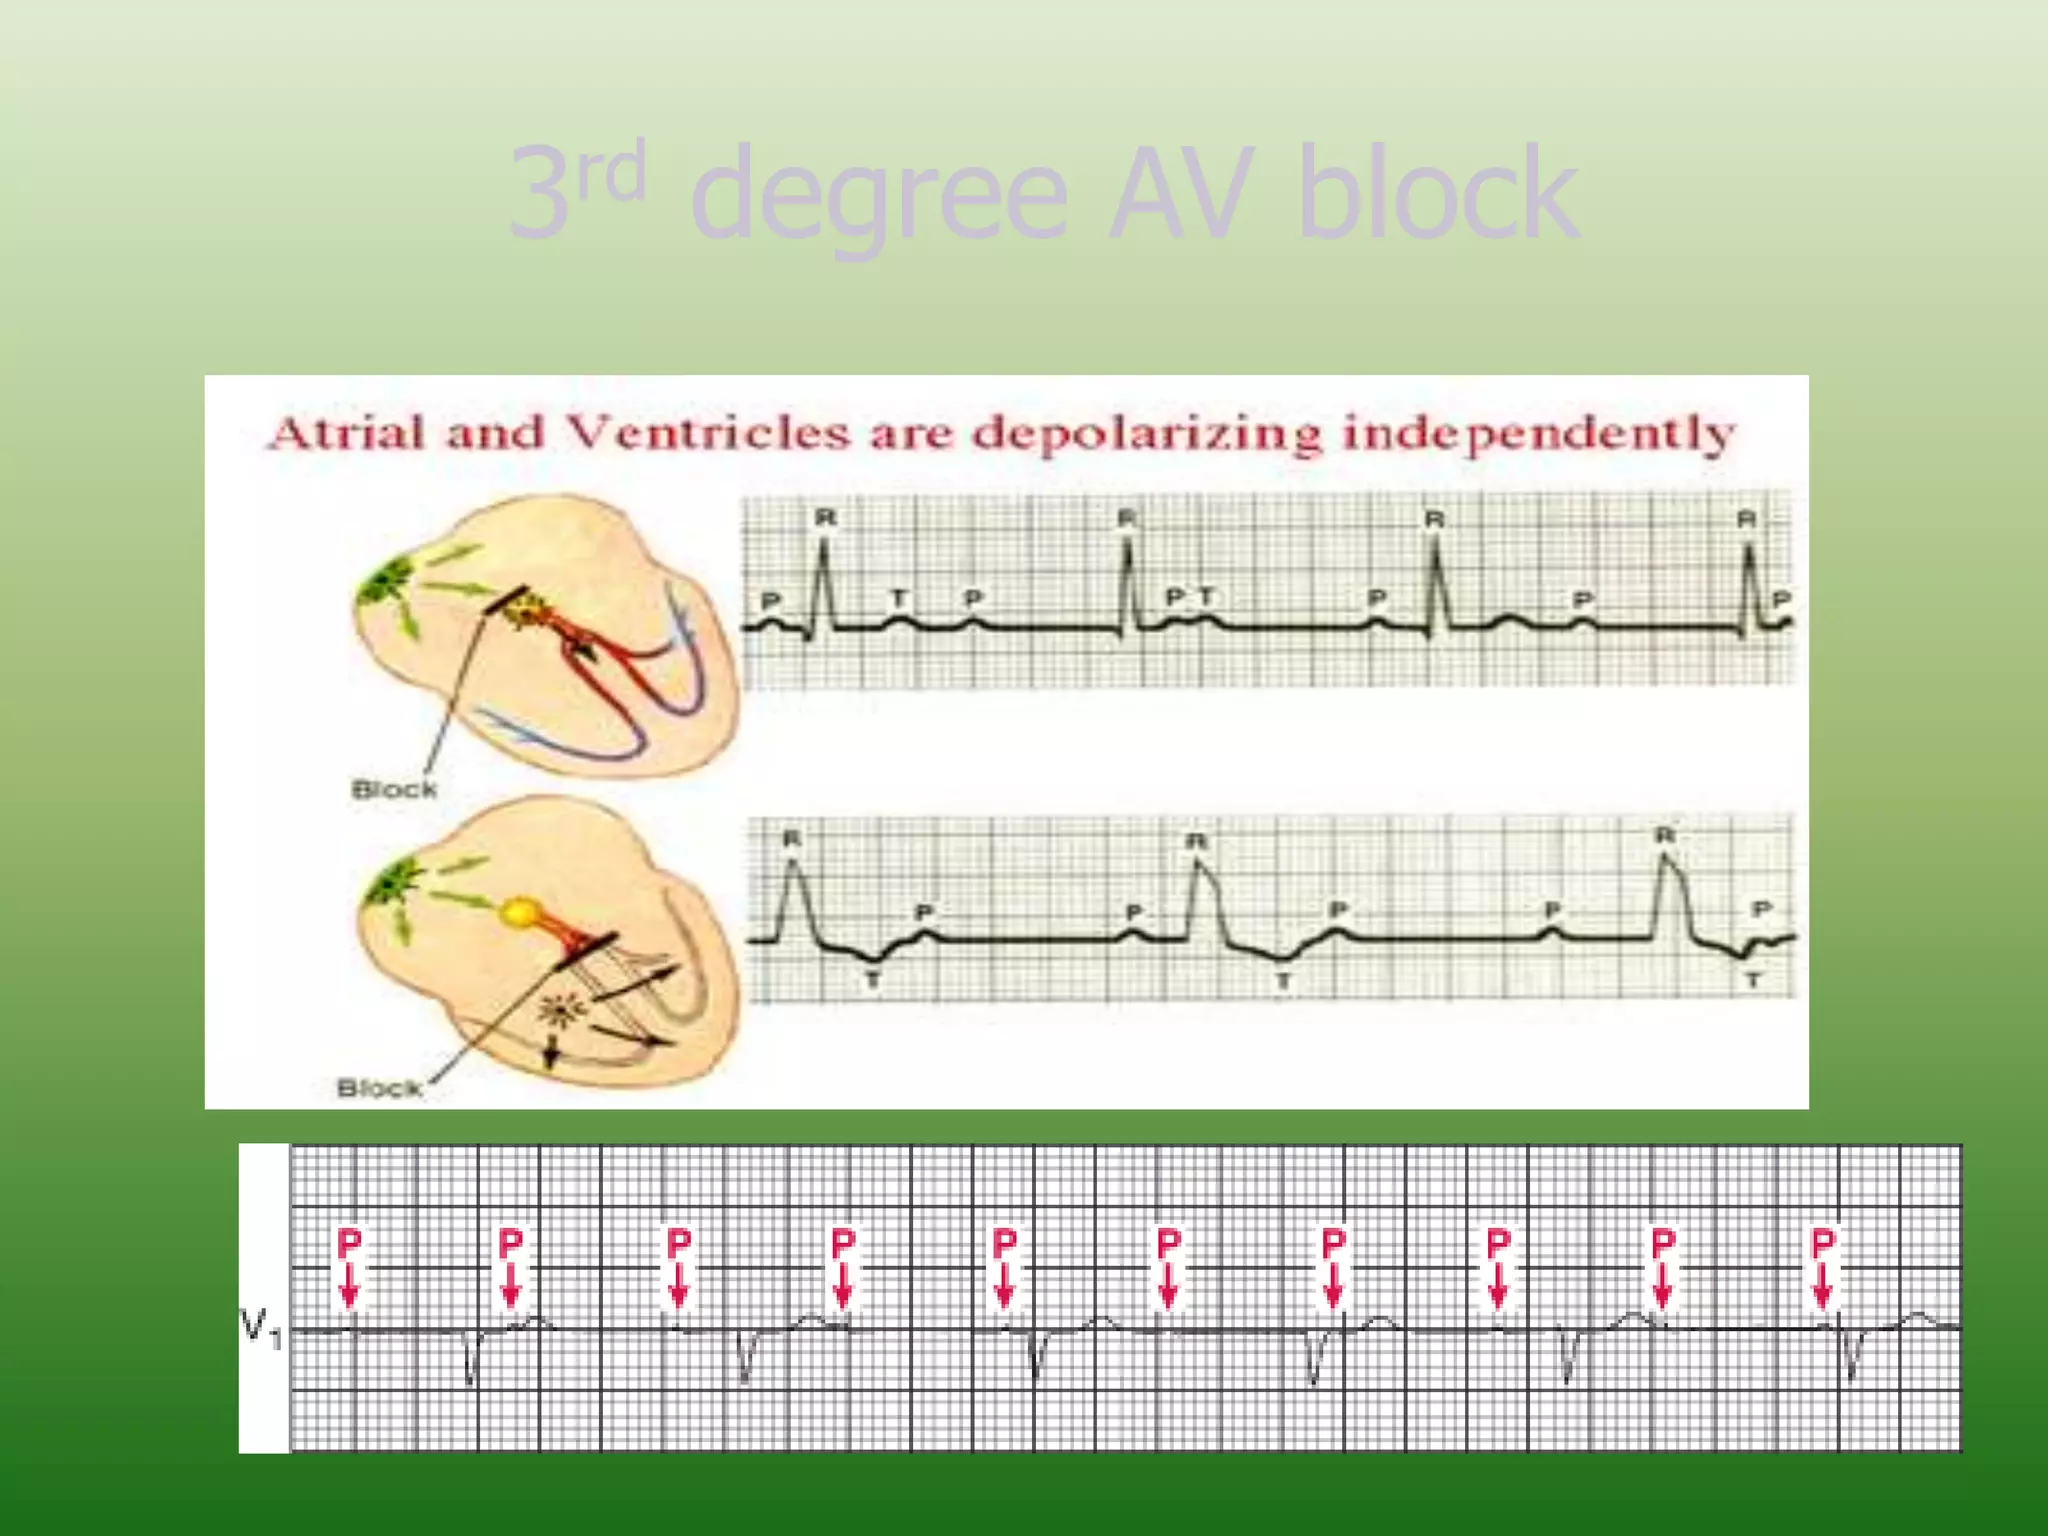


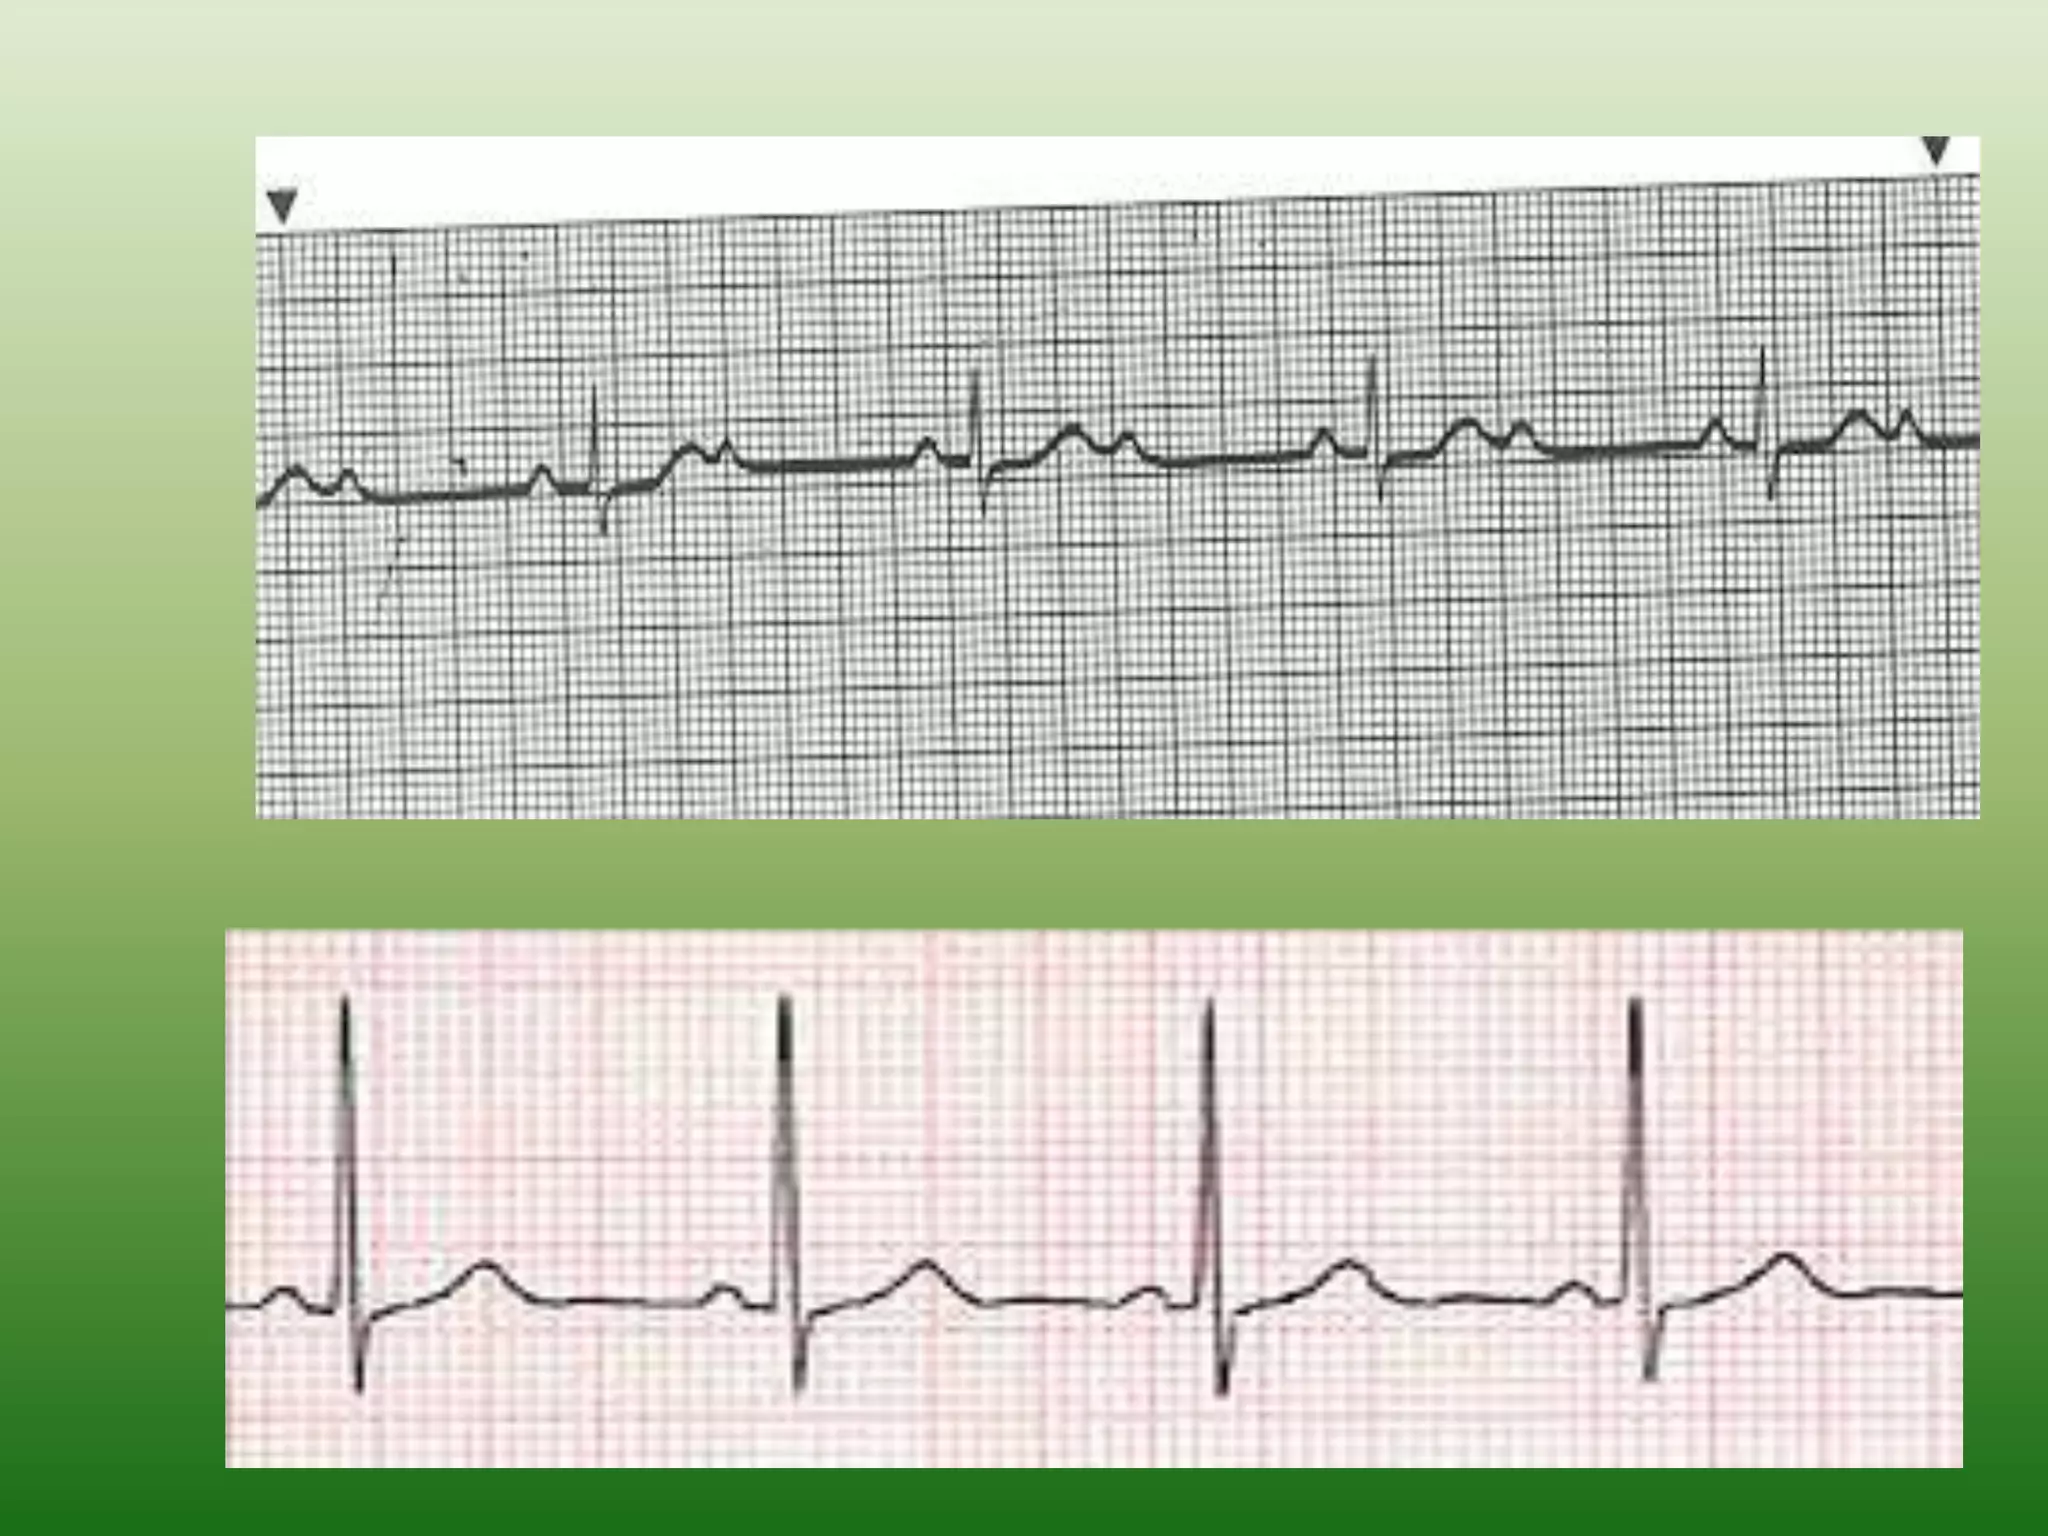


The ECG records the electrical activity of the heart over time and is the gold standard for diagnosing cardiac arrhythmias and conduction abnormalities. It detects three main waves - the P wave from atrial depolarization, the QRS complex from ventricular depolarization, and the T wave from ventricular repolarization. Abnormalities in conduction through the AV node can cause first-, second-, or third-degree heart block visible on the ECG. Higher degrees of block impair conduction more severely and require treatment such as pacemaker implantation.


![Data type[s] on MS SQL Server](https://cdn.slidesharecdn.com/ss_thumbnails/datatypeonmssqlserver-140302075820-phpapp01-thumbnail.jpg?width=640&height=640&fit=bounds)


