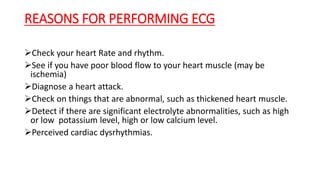
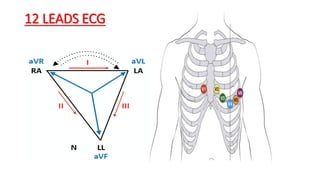
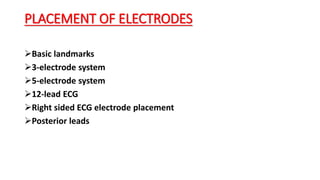
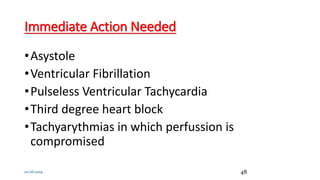
Basic Electro Cardiogram
(ECG)
“Prepared by ”
Mr Harison
Perceptor:
Mr Suneel Bhatti
OUTLINE OF LECTURE;
• Introduction of ECG
• Standardization of ECG
• Reasons for Performing ECG
• 12 Leads ECG
• Placement of electrodes
• Waves in ECG
• 10 points in ECG
• Anatomic waves
• Categorizing Rhythms
• References
History
• 1842- Italian scientist Carlo Matteucci realizes that electricity is
associated with the heart beat
• 1876- Irish scientist Marey analyzes the electric pattern of frog’s heart
• 1895 - William Einthoven , credited for the invention of EKG
• 1906 - using the string electrometer EKG,
• William Einthoven diagnoses some heart problems
• 1924 - the noble prize for physiology or medicine is given to William
Einthoven for his work on EKG
Continue:
• 1938 -AHA and Cardiac society of great Britan defined and position of
chest leads
• 1942- Goldberger increased Wilson’s Unipolar lead voltage by 50%
and made Augmented leads
• 2005- successful reduction in time of onset of chest pain and PTCA by
wireless transmission of ECG on his PDA.
Electrocardiography (ECG or EKG*)
• The electrocardiogram (EKG) is
a representation of the
electrical activity of the Heart.
ECG is a diagnostic tool, NOT a treatment
No one is ever cured by an ECG!
There is no difference between an ECG and an EKG.
Both refer to the same procedure, however one is in
English (electrocardiogram – ECG) and the other is
based on the German spelling (elektrokardiogram –
EKG). It is common to use the German “EKG” in the
United States
“What is the difference
between and ECG and EKG?”
RECORDING THE ELECTROCARDIOGRAM THE E.C.G PAPER
 ECG machines record changes in electrical activity by drawing a trace on a
moving paper strip.
 The electrocardiograph uses thermal paper, which is a graph paper & runs
normally at a speed of 25mm/sec and 10 mm/mV.
 Time is plotted on the X axis & voltage is plotted on the Y axis.
 In X axis, 1 second is divided into 5 large squares each of which
represents 0.2 sec. Each large square is further divided into 5 small
squares which represents 0.04 sec.
 The ECG machine is calibrated in such a way that an increase of voltage
by 1m Volt should move the stylus vertically by 1cms.
ECG Graph Paper
y
x
Voltage
(millivolts; mV)
Time (seconds; s)
y’
x’
(1  1) mm2
0.04 seconds
0.1 mV
Question: What would the bigger
square, i.e. the (5  5) mm2, represent?
Answer: 0.2 seconds.
‘X’ consider to
speed per
minute(time)
‘Y’ consider to
Amplitute(M.V)
REASONS FOR PERFORMING ECG
Check your heart Rate and rhythm.
See if you have poor blood flow to your heart muscle (may be
ischemia)
Diagnose a heart attack.
Check on things that are abnormal, such as thickened heart muscle.
Detect if there are significant electrolyte abnormalities, such as high
or low potassium level, high or low calcium level.
Perceived cardiac dysrhythmias.
12 LEADS ECG
PLACEMENT OF ELECTRODES
Basic landmarks
3-electrode system
5-electrode system
12-lead ECG
Right sided ECG electrode placement
Posterior leads
Basic landmarks
3-ELECTRODE SYSTEM
Uses 3 electrodes (RA, LA and LL)
Monitor displays the bipolar leads (I, II and III)
To get best results – Place electrodes on the chest wall equidistant
from the heart (rather than the specific limbs)
5-ELECTRODE SYSTEM
Uses 5 electrodes (RA, RL, LA, LL and Chest)
Monitor displays the bipolar leads (I, II and III)
AND a single unipolar lead (depending on position of the brown
chest lead (positions V1–6))
12-LEAD ECG
10 electrodes required to produce, 12-lead ECG
4 Electrodes on all 4 limbs (RA, LL, LA, RL)
6 Electrodes on precordium (V1–6)
Monitors 12 leads
unipolar leads (V1–6)
Bipolar leads (I, II, III) and (aVR, aVF, aVL)
Allows interpretation of specific areas of the heart
• Inferior (II, III, aVF)Lateral (I, aVL, V5, V6)Anterior (V1–4)
• Septal (v1, v2)
12-lead Precordial lead placement
V1: 4th intercostal space (ICS), RIGHT margin of the
sternum
V2: 4th ICS along the LEFT margin of the sternum
V4: 5th ICS, mid- clavicular line
V3: midway between V2 and V4
V5: 5th ICS, anterior axillary line (same level as V4)
V6: 5th ICS, mid-axillary line (same level as V4)
RIGHT SIDED ECG ELECTRODE PLACEMENT
There are several approaches to recording a
right-sided ECG:
A complete set of right-sided leads is obtained
by placing leads V1-6 in a mirror-image position
on the right side of the chest (see diagram,
below).
It can be simpler to leave V1 and V2 in their
usual positions and just transfer leads V3-6 to
the right side of the chest (i.e. V3R to V6R).
POSTERIOR LEADS
Leads V7-9 are placed on the posterior
chest wall in the following positions:
V7 – Left posterior axillary line, in the
same horizontal plane as V6.
V8 – Tip of the left scapula, in the same
horizontal plane as V6.
V9 – Left paraspinal region, in the same
horizontal plane as V6.
Posterior NSTEMI
Pacemakers of the Heart :
SA Node - Dominant pacemaker with an
intrinsic rate of 60 - 100 beats/minute.
AV Node - Back-up pacemaker with an
intrinsic rate of 40 - 60 beats/minute.
Ventricular cells - Back-up pacemaker with
an intrinsic rate of 20 - 45 bpm.
Electrical Conduction System
• Depolarization that starts with pacemaker cells in the
sinoatrial node,
spreads out through the atrium, atrioventricular
node Bundle of His
Right and Left Bundle Branches
Purkinje fibers spreading down and to the
left throughout the ventricles.
WAVE IN ECG
The “PQRST” Wave
• P wave - Atrial depolarization (contraction)
• QRS wave - Ventricular depolarization (contraction)
• T wave - Ventricular repolarization (relaxtion)
• J point- is the the junction between the termination of the QRS complex
and the beginning of the ST segment.
• U waves- is a deflection following the T wave.
Hypokalemia causes enlarged and prominent T waves on the EKG
10 POINTS IN ECG
Rate
Rhythms
Axis
P wave
Q wave
QRS Complex
T wave
ST segments
Conduction blockage
Hypertropy
Rate:
• Relationship between the number of large squares covered by r-r
interval and the heart rate r-r interval(large squares) heart rate
(beats/min)
There are 3 methods to determents the rate:
Rule of 300( usually for sinus Rhythms)
10 seconds ( for every rhythms)
Count small box R wave to R wave then divide into 1500..
Rhythms
• Sinus rhythms
• Irregular rhythms
• Sinus irregular irregular rhythms.
AXIS
P WAVE
• The normal P-wave:
• Has a smooth contour
• Is monophasic in lead II
• Is biphasic in lead V1
• Has a duration 0f less than 0.12 seconds or 3 small boxes.
P-wave Abnormalities Seen in Lead II
• In lead II two types of P-wave abnormalities can be seen.
• Right atrial enlargement is seen as a taller than normal P-wave(
increased amplitude)
• Left atrial enlargement seen as a P-wave with a notch in it.
Q-Wave Myocardial Infarction
• This is the classic presentation for MI’s.
• The developing MI is seen as ST segment elevation followed by
deepening Q-waves in the leads where ST segment elevation was 1st
seen.
• Q waves are “significant” if they are greater than 1 box in width
(longer than 0.04 msec), or are larger than 1/4 of the R wave.
• Significant Q waves are indicative of myocardial infarction.
• However signifigant Q-waves in lead III alone are NOT diagnostic of
an infarction, even they are otherwise “significant” in size and width.
• Therefore signifigant Q-waves in lead III are ignored unless other
abnormalities are seen.
Non Q-Wave Myocardial Infarction
• In this case you get classic signs and symptoms of an MI(i.e elevated
cardiac enzymes and markers and of course physical signs of an MI (
chest pain ,nausea ,vomiting , etc)
But non of the usual ECG changes ( i.e. ST segment elevation and
deepening Q-waves). In fact sometimes the only clue on the ECG are
inverted T-waves.
The QRS Complex
• As well as showing ventricular conduction defects, the QRS complex
along with ST segment analysis is used to diagnose myocardial oxygen
deficits and myocardial infarctions.
• The QRS complex is also used to diagnose accessory conduction
pathways in the heart.
S-T Segment Analysis
• In order to assess the S-T segment we must first
define the J-point.
• The J point in the ECG is the point where the QRS
complex joins the ST segment. It represents the
approximate end of depolarization and the beginning
of repolarization.
The Isoelectric Point
• S-T segments can be elevated, depressed or isoelectric.
• The J-point is deemed to be isoelectric if the S-T
line/segment is not elevated or depressed with respect
to the P-Q line/segment. As in the diagram below. See
arrows 


S-T Changes
• You can see both S-T elevation and S-T depression on ECG’s.
• S-T elevation is indicative of a myocardial infarction. So in other words
myocardial cell death is occuring.
• S-T depression is indicative of myocardial ischemia. The myocardial
cells are not getting enough oxygen and are at risk of dying.
S-T Depression
S-T Elevation
ANATOMIC WAVES
Categorizing Rhythms With
Respect To An Interventional
Hierarchy .
Know when to worry!
10/26/2019 46
10/26/2019 47
Immediate Action Needed
•Asystole
•Ventricular Fibrillation
•Pulseless Ventricular Tachycardia
•Third degree heart block
•Tachyarythmias in which perfussion is
compromised
10/26/2019 48
Action Required Within Minutes
( This group is also known as pre-arrest syndromes
)
• Significant Bradycardia.
• Runs of unifocal PVC’s ( i.e. triplets , couplets etc.)
• Multifocal PVC’s.
• Second degree type 2 heart block ( because it
often is the precursor for third degree heart block.
• Tachyarrhythmia's in which perfusion is not yet
compromised.
10/26/2019 49
Referral Required ( prior to dental treatment) With
No immediate Action Needed
•Any other abnormality
noted which the patient
was unaware of in their
medical history.
10/26/2019 50
• Instruct patient to be calm and no movement, Then print the
result
• The test is completely painless and takes less than a minute
to perform once the leads are in position.
• After the test, the electrodes are removed & clean the skin
Summary
You hopefully now understand ECG interpretation.
• This can be applied in preoperative intraoperative and post operative
patient assessment.
• You can utilize this knowledge in courses designed to teach
arrhythmia treatment such as ILS and ALS and in your emergency
simulation courses.
10/26/2019 52
References
• Brunner & Suddarth’s Medical Surgical Nursing.
10th ed
• Kozier & Erbs’ Fundamentals of Nursing . Eighth
ed. 2008
• Only EKG Book You ll Ever Need, Thaler, Malcom
S, 2007 LippincottWilliams & Wilkins 5th Edition•

Basic of ECG by Harison

  • 1.
    Basic Electro Cardiogram (ECG) “Preparedby ” Mr Harison Perceptor: Mr Suneel Bhatti
  • 2.
    OUTLINE OF LECTURE; •Introduction of ECG • Standardization of ECG • Reasons for Performing ECG • 12 Leads ECG • Placement of electrodes • Waves in ECG • 10 points in ECG • Anatomic waves • Categorizing Rhythms • References
  • 3.
    History • 1842- Italianscientist Carlo Matteucci realizes that electricity is associated with the heart beat • 1876- Irish scientist Marey analyzes the electric pattern of frog’s heart • 1895 - William Einthoven , credited for the invention of EKG • 1906 - using the string electrometer EKG, • William Einthoven diagnoses some heart problems • 1924 - the noble prize for physiology or medicine is given to William Einthoven for his work on EKG
  • 4.
    Continue: • 1938 -AHAand Cardiac society of great Britan defined and position of chest leads • 1942- Goldberger increased Wilson’s Unipolar lead voltage by 50% and made Augmented leads • 2005- successful reduction in time of onset of chest pain and PTCA by wireless transmission of ECG on his PDA.
  • 5.
    Electrocardiography (ECG orEKG*) • The electrocardiogram (EKG) is a representation of the electrical activity of the Heart. ECG is a diagnostic tool, NOT a treatment No one is ever cured by an ECG!
  • 6.
    There is nodifference between an ECG and an EKG. Both refer to the same procedure, however one is in English (electrocardiogram – ECG) and the other is based on the German spelling (elektrokardiogram – EKG). It is common to use the German “EKG” in the United States “What is the difference between and ECG and EKG?”
  • 7.
    RECORDING THE ELECTROCARDIOGRAMTHE E.C.G PAPER  ECG machines record changes in electrical activity by drawing a trace on a moving paper strip.  The electrocardiograph uses thermal paper, which is a graph paper & runs normally at a speed of 25mm/sec and 10 mm/mV.  Time is plotted on the X axis & voltage is plotted on the Y axis.  In X axis, 1 second is divided into 5 large squares each of which represents 0.2 sec. Each large square is further divided into 5 small squares which represents 0.04 sec.  The ECG machine is calibrated in such a way that an increase of voltage by 1m Volt should move the stylus vertically by 1cms.
  • 9.
    ECG Graph Paper y x Voltage (millivolts;mV) Time (seconds; s) y’ x’ (1  1) mm2 0.04 seconds 0.1 mV Question: What would the bigger square, i.e. the (5  5) mm2, represent? Answer: 0.2 seconds. ‘X’ consider to speed per minute(time) ‘Y’ consider to Amplitute(M.V)
  • 10.
    REASONS FOR PERFORMINGECG Check your heart Rate and rhythm. See if you have poor blood flow to your heart muscle (may be ischemia) Diagnose a heart attack. Check on things that are abnormal, such as thickened heart muscle. Detect if there are significant electrolyte abnormalities, such as high or low potassium level, high or low calcium level. Perceived cardiac dysrhythmias.
  • 11.
  • 12.
    PLACEMENT OF ELECTRODES Basiclandmarks 3-electrode system 5-electrode system 12-lead ECG Right sided ECG electrode placement Posterior leads
  • 13.
  • 14.
    3-ELECTRODE SYSTEM Uses 3electrodes (RA, LA and LL) Monitor displays the bipolar leads (I, II and III) To get best results – Place electrodes on the chest wall equidistant from the heart (rather than the specific limbs)
  • 15.
    5-ELECTRODE SYSTEM Uses 5electrodes (RA, RL, LA, LL and Chest) Monitor displays the bipolar leads (I, II and III) AND a single unipolar lead (depending on position of the brown chest lead (positions V1–6))
  • 16.
    12-LEAD ECG 10 electrodesrequired to produce, 12-lead ECG 4 Electrodes on all 4 limbs (RA, LL, LA, RL) 6 Electrodes on precordium (V1–6) Monitors 12 leads unipolar leads (V1–6) Bipolar leads (I, II, III) and (aVR, aVF, aVL) Allows interpretation of specific areas of the heart • Inferior (II, III, aVF)Lateral (I, aVL, V5, V6)Anterior (V1–4) • Septal (v1, v2) 12-lead Precordial lead placement V1: 4th intercostal space (ICS), RIGHT margin of the sternum V2: 4th ICS along the LEFT margin of the sternum V4: 5th ICS, mid- clavicular line V3: midway between V2 and V4 V5: 5th ICS, anterior axillary line (same level as V4) V6: 5th ICS, mid-axillary line (same level as V4)
  • 17.
    RIGHT SIDED ECGELECTRODE PLACEMENT There are several approaches to recording a right-sided ECG: A complete set of right-sided leads is obtained by placing leads V1-6 in a mirror-image position on the right side of the chest (see diagram, below). It can be simpler to leave V1 and V2 in their usual positions and just transfer leads V3-6 to the right side of the chest (i.e. V3R to V6R).
  • 18.
    POSTERIOR LEADS Leads V7-9are placed on the posterior chest wall in the following positions: V7 – Left posterior axillary line, in the same horizontal plane as V6. V8 – Tip of the left scapula, in the same horizontal plane as V6. V9 – Left paraspinal region, in the same horizontal plane as V6. Posterior NSTEMI
  • 19.
    Pacemakers of theHeart : SA Node - Dominant pacemaker with an intrinsic rate of 60 - 100 beats/minute. AV Node - Back-up pacemaker with an intrinsic rate of 40 - 60 beats/minute. Ventricular cells - Back-up pacemaker with an intrinsic rate of 20 - 45 bpm.
  • 20.
    Electrical Conduction System •Depolarization that starts with pacemaker cells in the sinoatrial node, spreads out through the atrium, atrioventricular node Bundle of His Right and Left Bundle Branches Purkinje fibers spreading down and to the left throughout the ventricles.
  • 21.
    WAVE IN ECG The“PQRST” Wave • P wave - Atrial depolarization (contraction) • QRS wave - Ventricular depolarization (contraction) • T wave - Ventricular repolarization (relaxtion) • J point- is the the junction between the termination of the QRS complex and the beginning of the ST segment. • U waves- is a deflection following the T wave. Hypokalemia causes enlarged and prominent T waves on the EKG
  • 24.
    10 POINTS INECG Rate Rhythms Axis P wave Q wave QRS Complex T wave ST segments Conduction blockage Hypertropy
  • 25.
    Rate: • Relationship betweenthe number of large squares covered by r-r interval and the heart rate r-r interval(large squares) heart rate (beats/min) There are 3 methods to determents the rate: Rule of 300( usually for sinus Rhythms) 10 seconds ( for every rhythms) Count small box R wave to R wave then divide into 1500..
  • 26.
    Rhythms • Sinus rhythms •Irregular rhythms • Sinus irregular irregular rhythms.
  • 30.
  • 31.
    P WAVE • Thenormal P-wave: • Has a smooth contour • Is monophasic in lead II • Is biphasic in lead V1 • Has a duration 0f less than 0.12 seconds or 3 small boxes.
  • 32.
    P-wave Abnormalities Seenin Lead II • In lead II two types of P-wave abnormalities can be seen. • Right atrial enlargement is seen as a taller than normal P-wave( increased amplitude) • Left atrial enlargement seen as a P-wave with a notch in it.
  • 33.
    Q-Wave Myocardial Infarction •This is the classic presentation for MI’s. • The developing MI is seen as ST segment elevation followed by deepening Q-waves in the leads where ST segment elevation was 1st seen. • Q waves are “significant” if they are greater than 1 box in width (longer than 0.04 msec), or are larger than 1/4 of the R wave. • Significant Q waves are indicative of myocardial infarction. • However signifigant Q-waves in lead III alone are NOT diagnostic of an infarction, even they are otherwise “significant” in size and width. • Therefore signifigant Q-waves in lead III are ignored unless other abnormalities are seen.
  • 34.
    Non Q-Wave MyocardialInfarction • In this case you get classic signs and symptoms of an MI(i.e elevated cardiac enzymes and markers and of course physical signs of an MI ( chest pain ,nausea ,vomiting , etc) But non of the usual ECG changes ( i.e. ST segment elevation and deepening Q-waves). In fact sometimes the only clue on the ECG are inverted T-waves.
  • 35.
    The QRS Complex •As well as showing ventricular conduction defects, the QRS complex along with ST segment analysis is used to diagnose myocardial oxygen deficits and myocardial infarctions. • The QRS complex is also used to diagnose accessory conduction pathways in the heart.
  • 36.
    S-T Segment Analysis •In order to assess the S-T segment we must first define the J-point. • The J point in the ECG is the point where the QRS complex joins the ST segment. It represents the approximate end of depolarization and the beginning of repolarization.
  • 37.
    The Isoelectric Point •S-T segments can be elevated, depressed or isoelectric. • The J-point is deemed to be isoelectric if the S-T line/segment is not elevated or depressed with respect to the P-Q line/segment. As in the diagram below. See arrows   
  • 38.
    S-T Changes • Youcan see both S-T elevation and S-T depression on ECG’s. • S-T elevation is indicative of a myocardial infarction. So in other words myocardial cell death is occuring. • S-T depression is indicative of myocardial ischemia. The myocardial cells are not getting enough oxygen and are at risk of dying.
  • 39.
  • 40.
  • 41.
  • 46.
    Categorizing Rhythms With RespectTo An Interventional Hierarchy . Know when to worry! 10/26/2019 46
  • 47.
  • 48.
    Immediate Action Needed •Asystole •VentricularFibrillation •Pulseless Ventricular Tachycardia •Third degree heart block •Tachyarythmias in which perfussion is compromised 10/26/2019 48
  • 49.
    Action Required WithinMinutes ( This group is also known as pre-arrest syndromes ) • Significant Bradycardia. • Runs of unifocal PVC’s ( i.e. triplets , couplets etc.) • Multifocal PVC’s. • Second degree type 2 heart block ( because it often is the precursor for third degree heart block. • Tachyarrhythmia's in which perfusion is not yet compromised. 10/26/2019 49
  • 50.
    Referral Required (prior to dental treatment) With No immediate Action Needed •Any other abnormality noted which the patient was unaware of in their medical history. 10/26/2019 50
  • 51.
    • Instruct patientto be calm and no movement, Then print the result • The test is completely painless and takes less than a minute to perform once the leads are in position. • After the test, the electrodes are removed & clean the skin
  • 52.
    Summary You hopefully nowunderstand ECG interpretation. • This can be applied in preoperative intraoperative and post operative patient assessment. • You can utilize this knowledge in courses designed to teach arrhythmia treatment such as ILS and ALS and in your emergency simulation courses. 10/26/2019 52
  • 53.
    References • Brunner &Suddarth’s Medical Surgical Nursing. 10th ed • Kozier & Erbs’ Fundamentals of Nursing . Eighth ed. 2008 • Only EKG Book You ll Ever Need, Thaler, Malcom S, 2007 LippincottWilliams & Wilkins 5th Edition•