Conduction System
• Eachcomponent of the conductive
system has its own intrinsic rate of self-
excitation.
• SA node = 60–100 beats per minute
• AV node = 40–60 beats per minute
• Purkinje system = 15–40 beats per minute
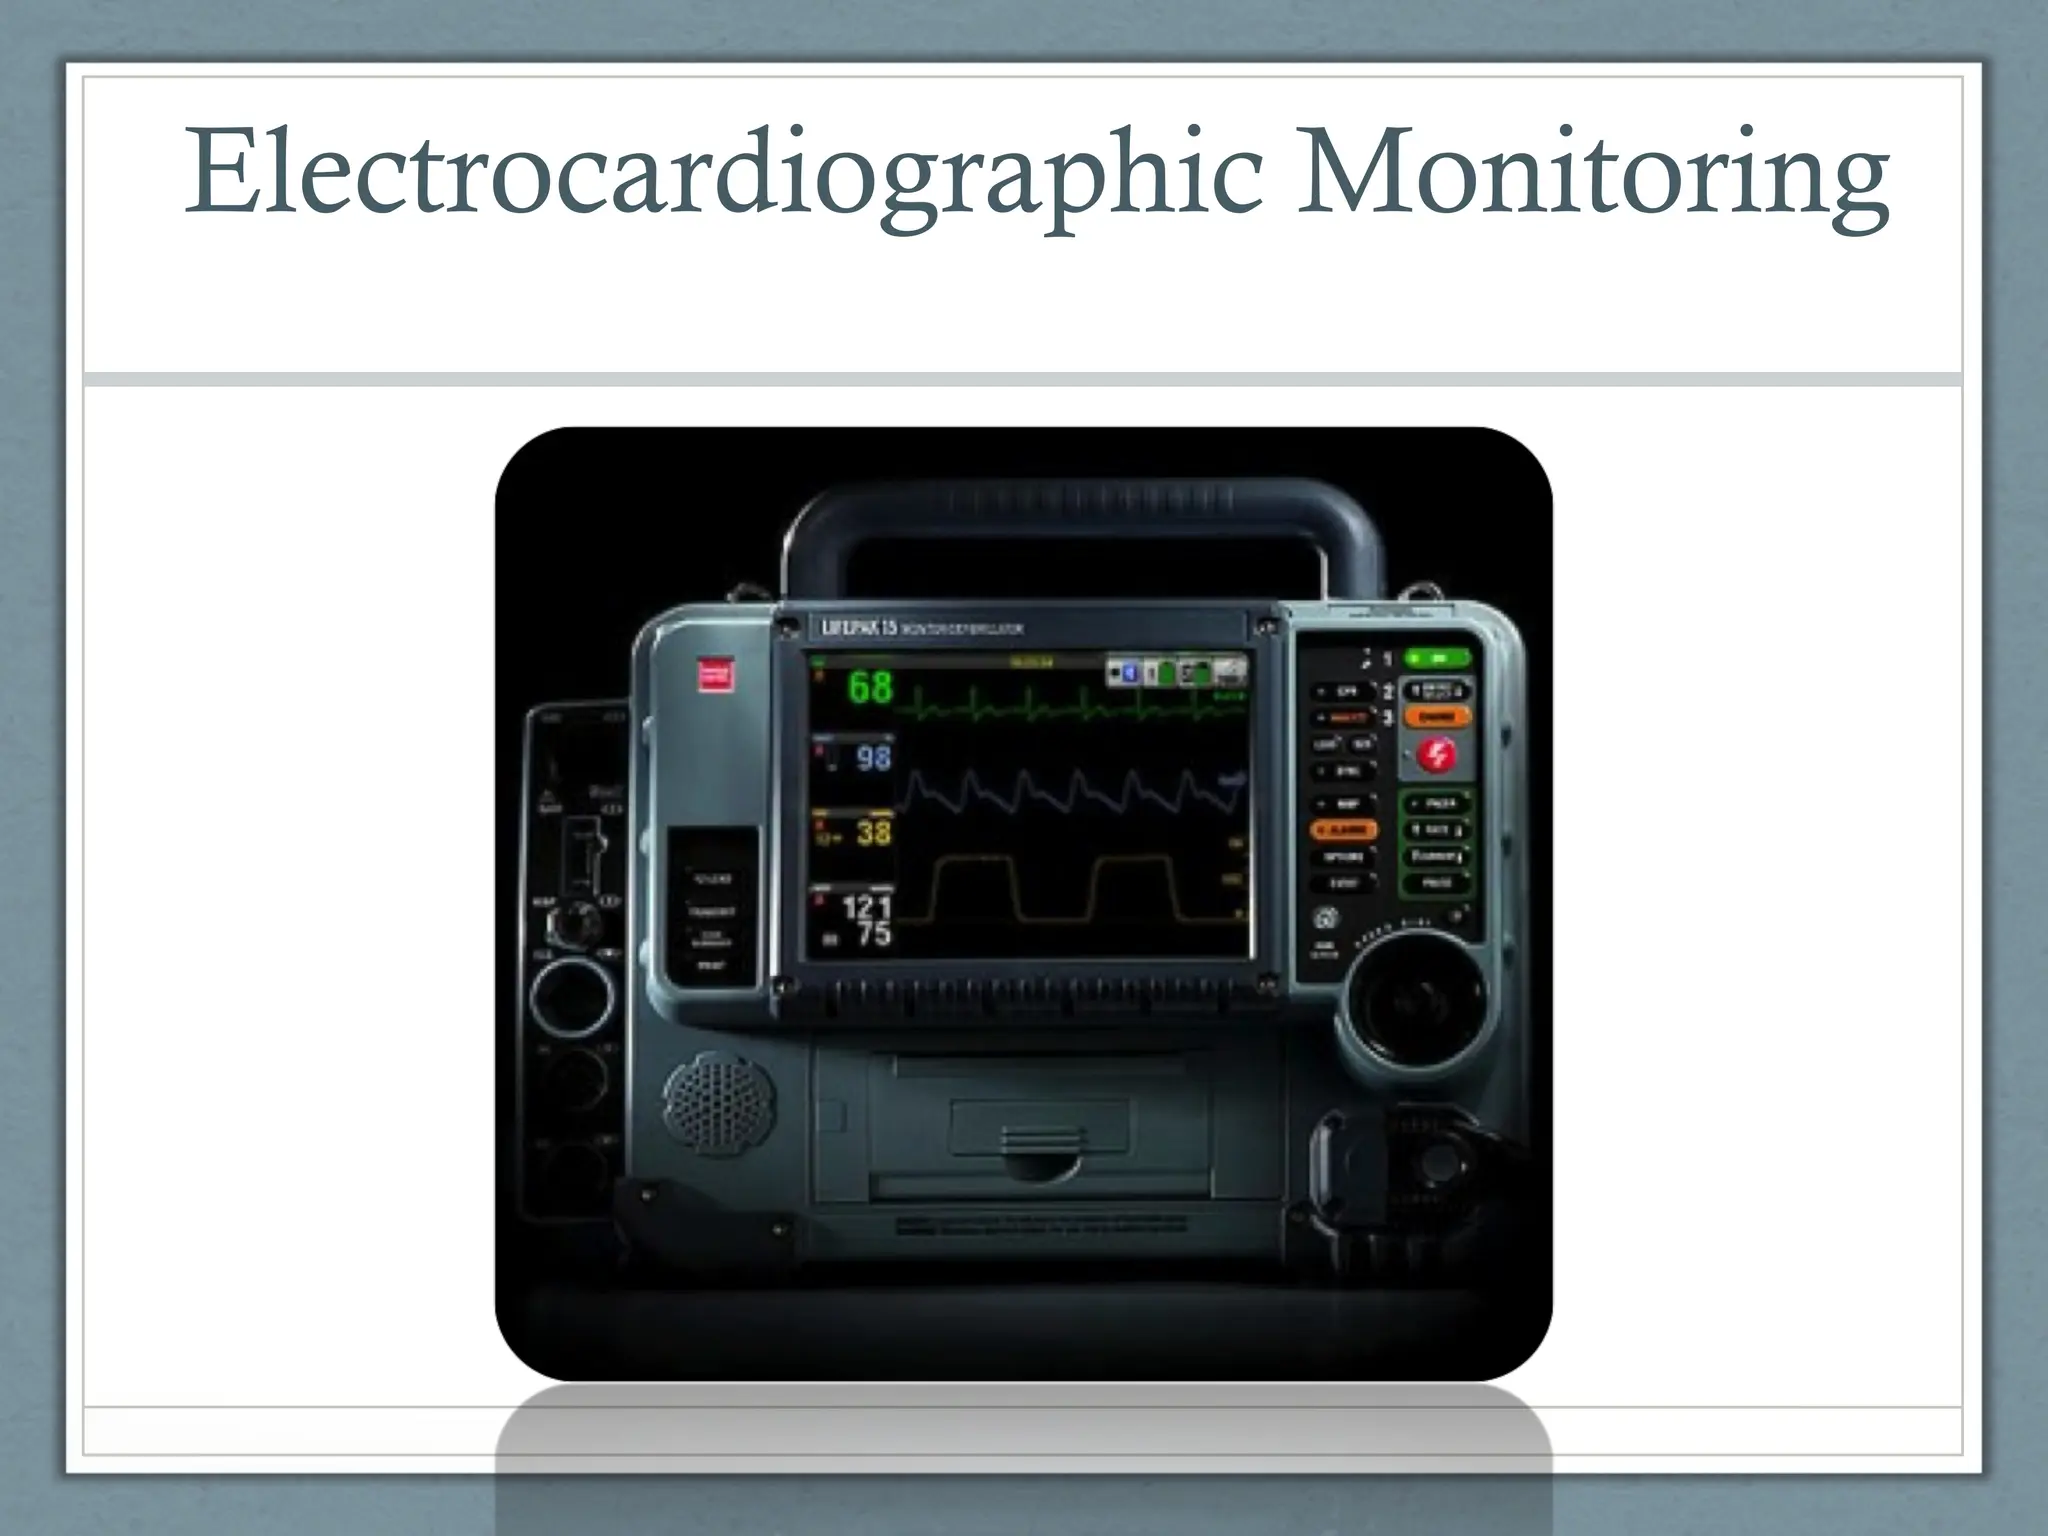
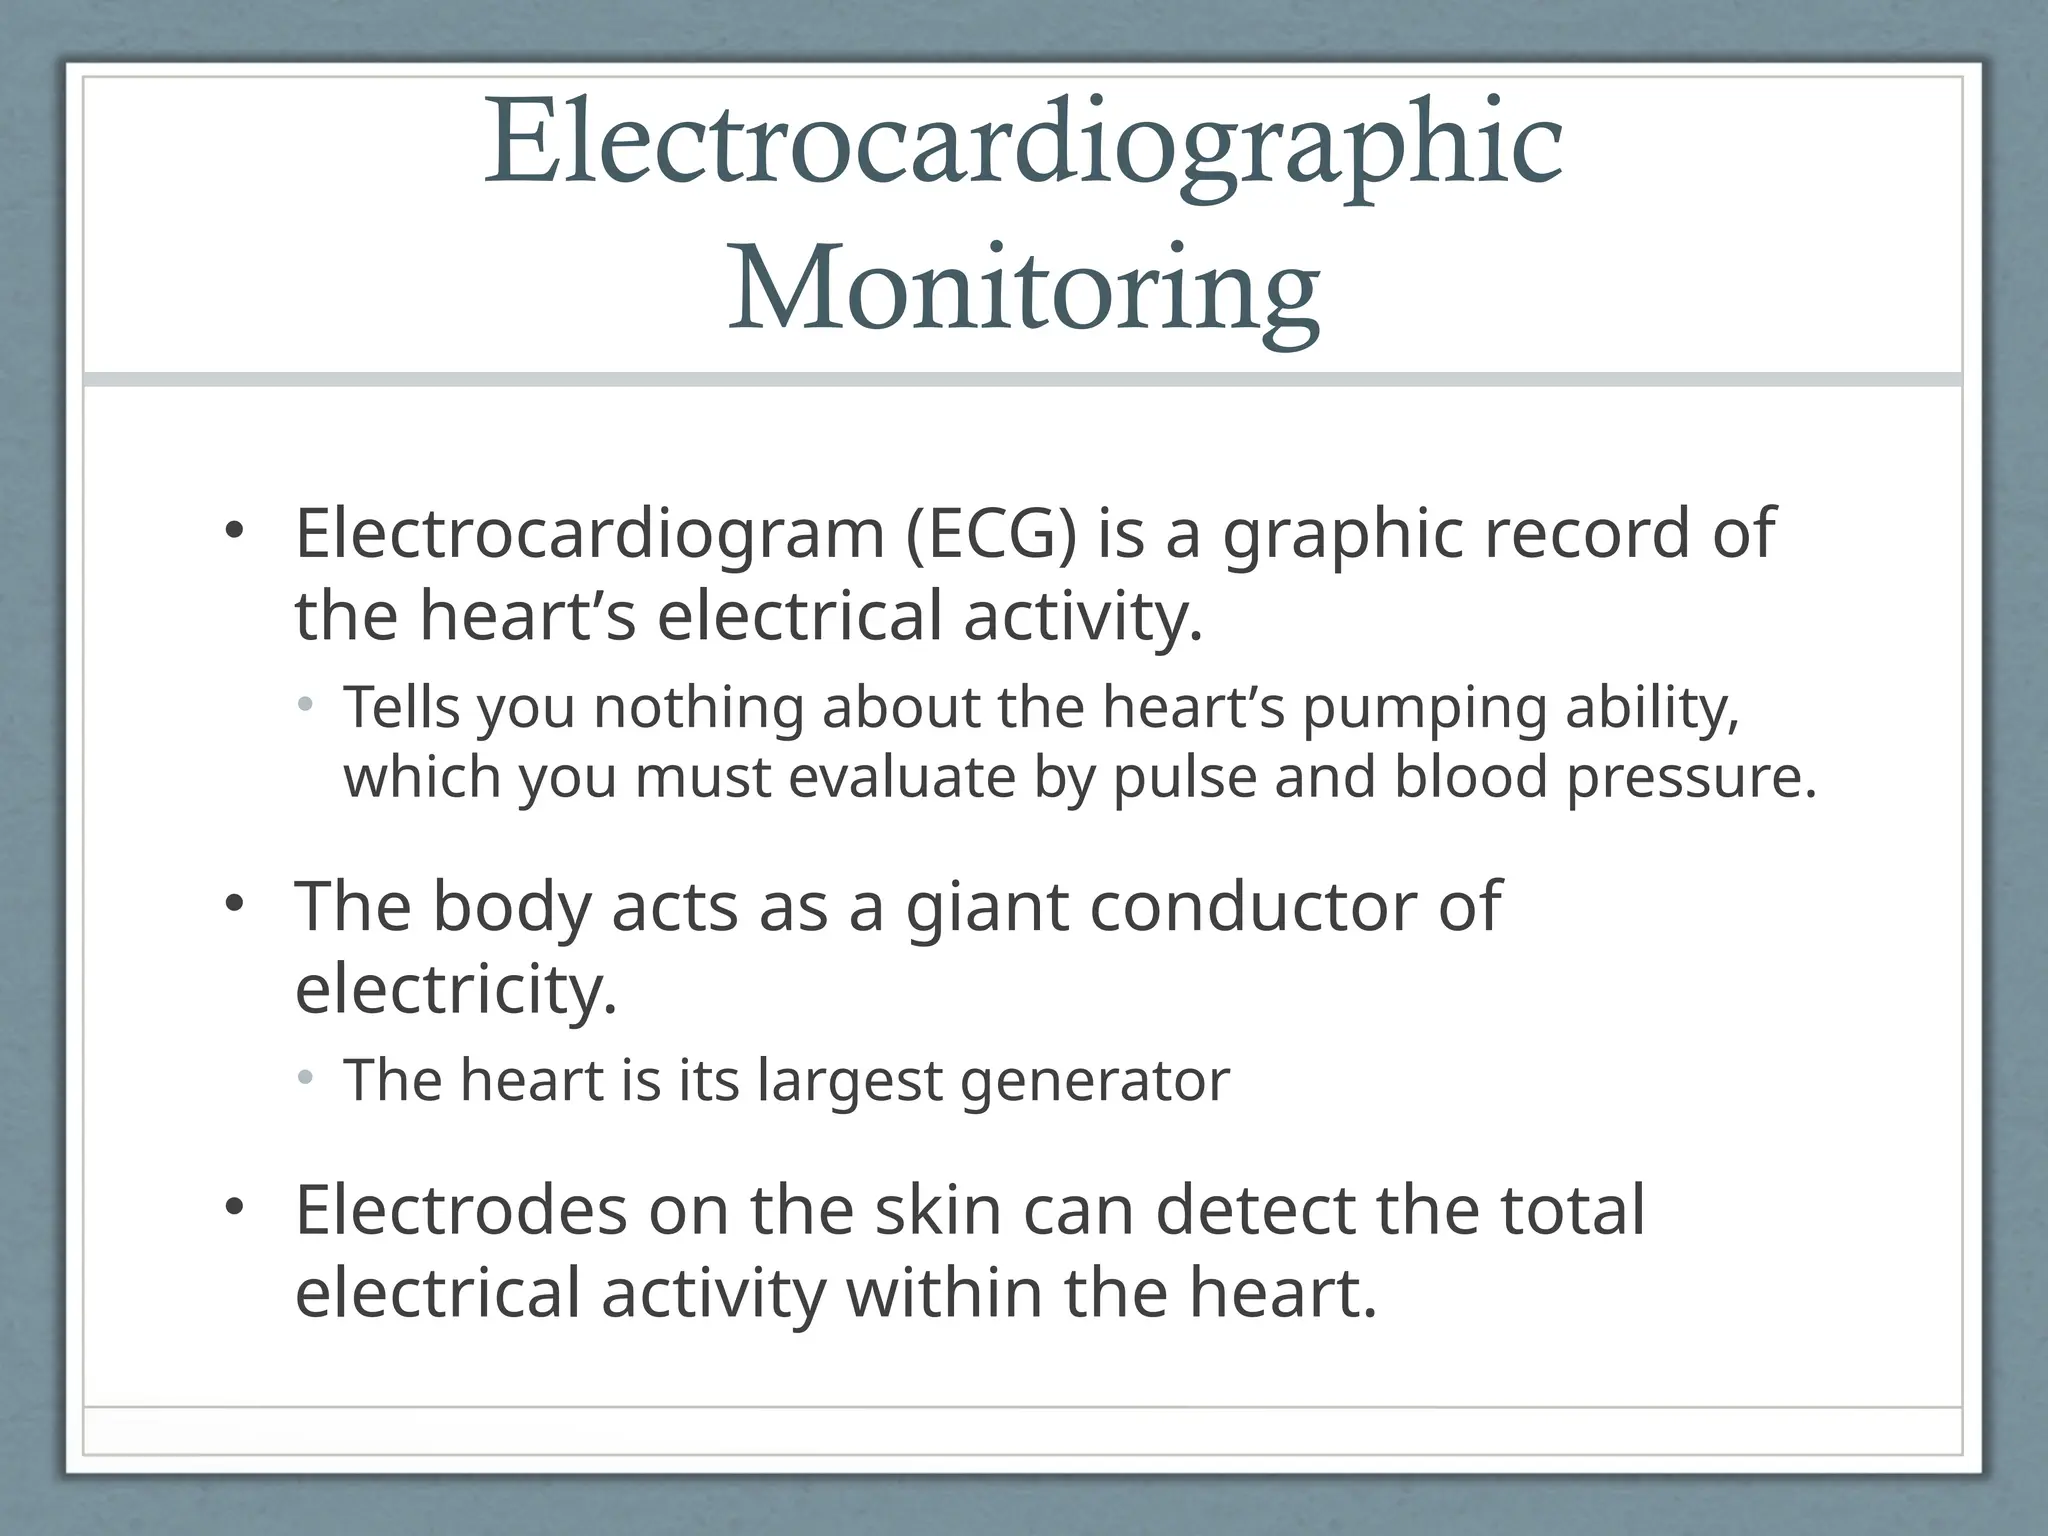
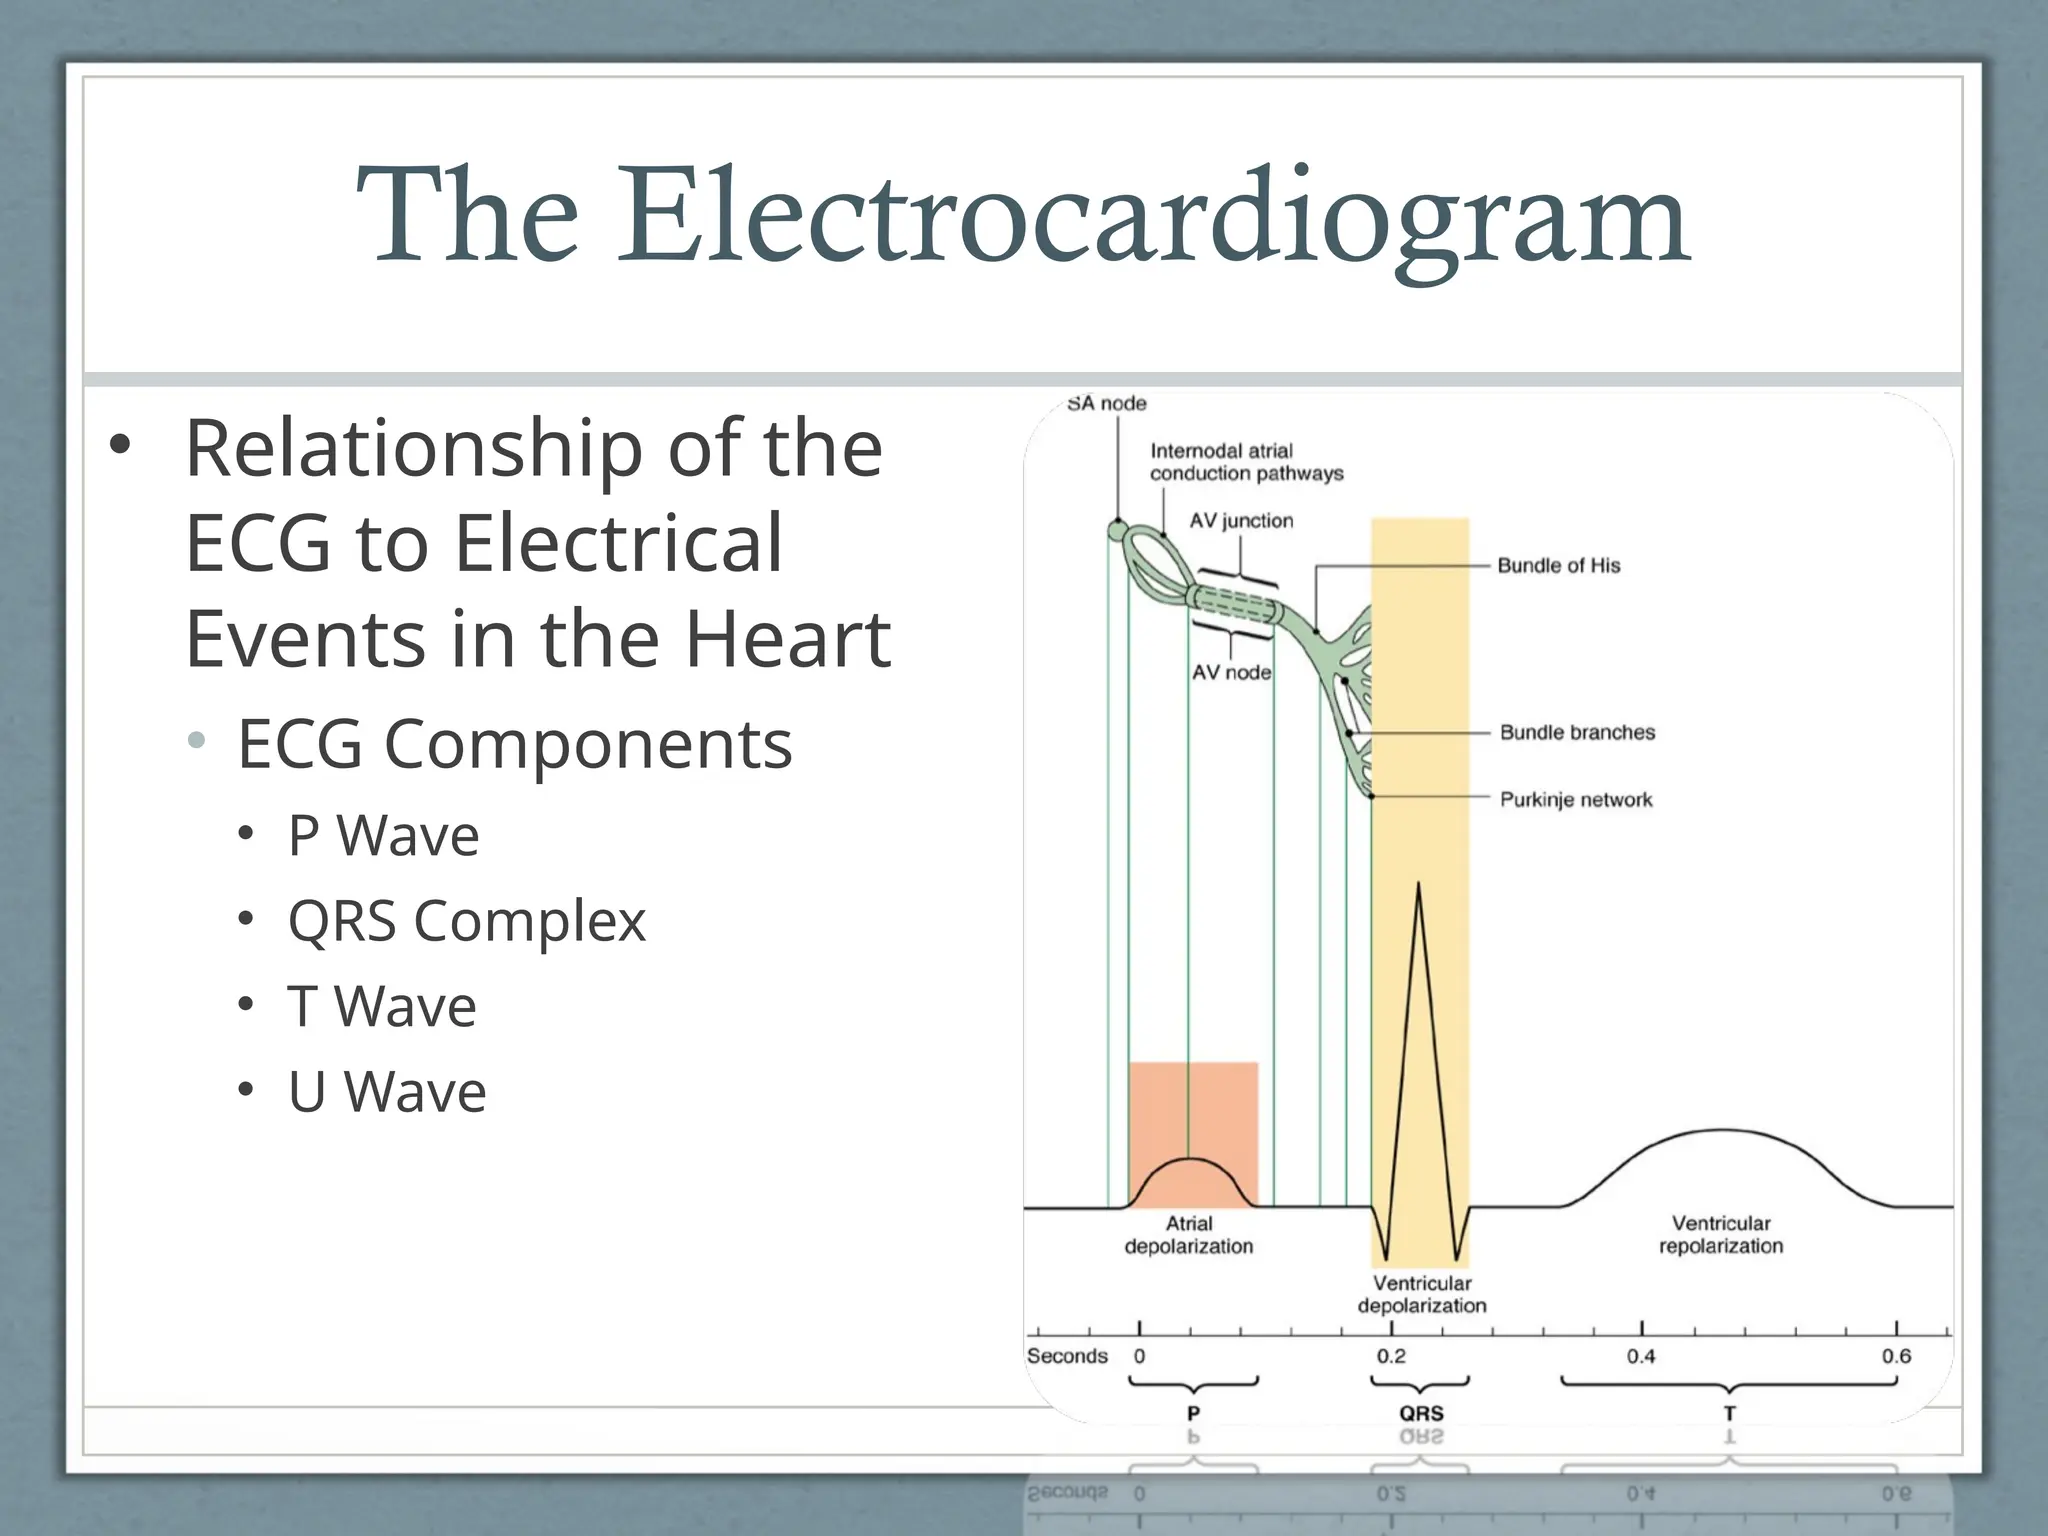
Electrocardiographic
Monitoring
• Electrocardiogram (ECG)is a graphic record of
the heart’s electrical activity.
• Tells you nothing about the heart’s pumping ability,
which you must evaluate by pulse and blood pressure.
• The body acts as a giant conductor of
electricity.
• The heart is its largest generator
• Electrodes on the skin can detect the total
electrical activity within the heart.
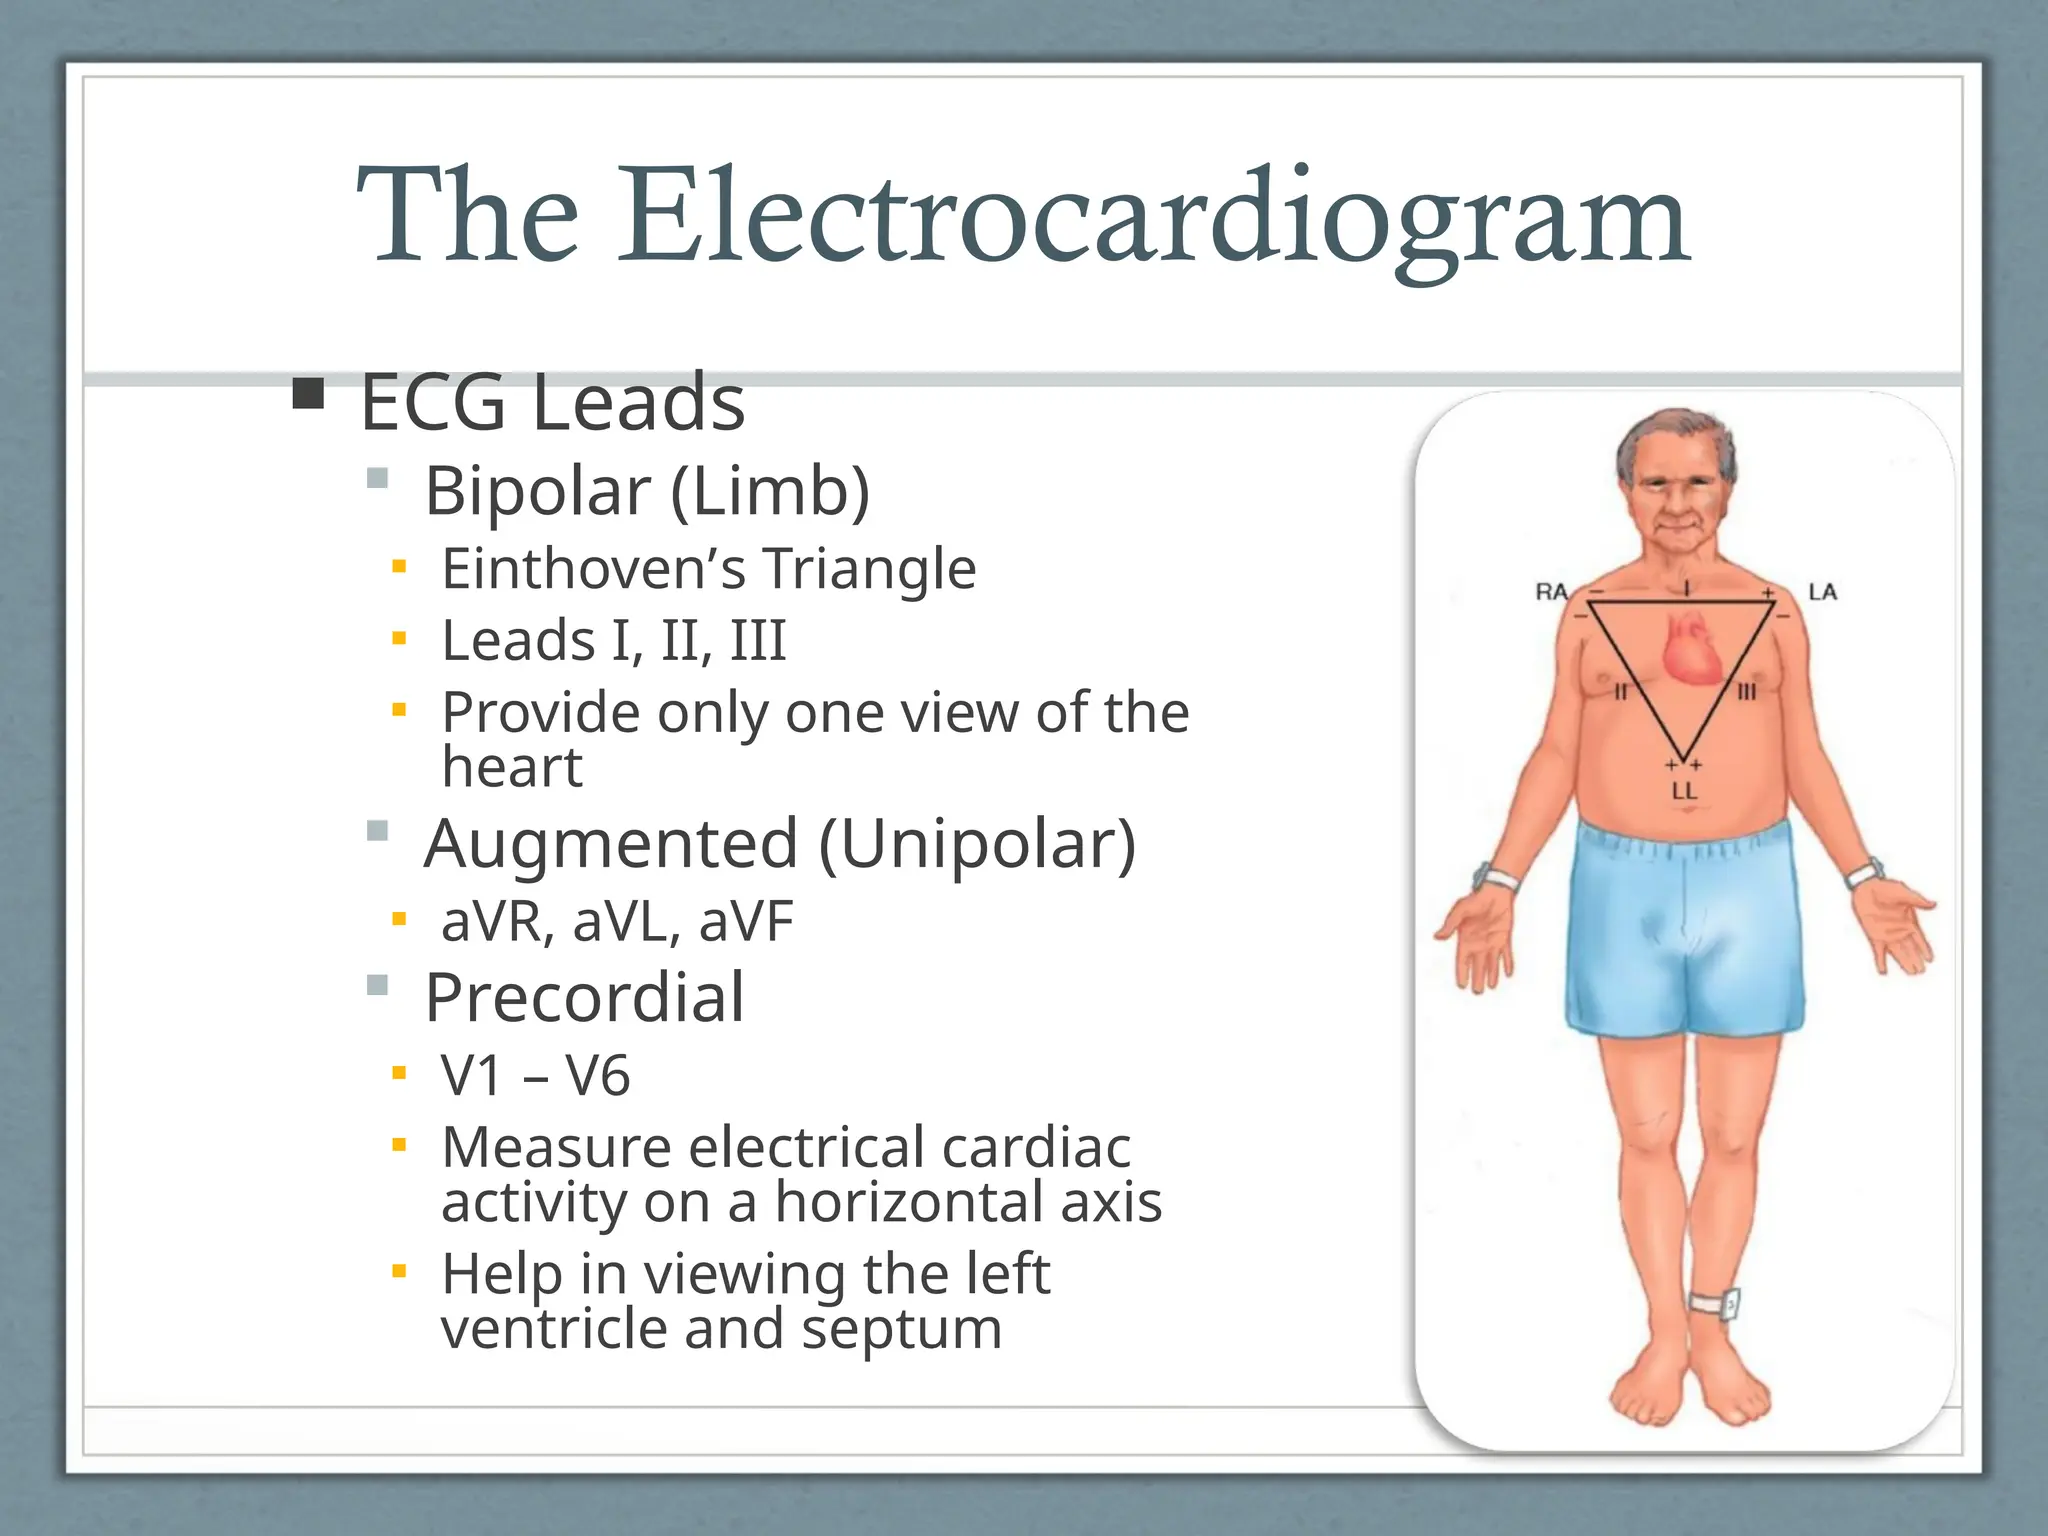
The Electrocardiogram
ECGLeads
Bipolar (Limb)
▪ Einthoven’s Triangle
▪ Leads I, II, III
▪ Provide only one view of the
heart
Augmented (Unipolar)
▪ aVR, aVL, aVF
Precordial
▪ V1 – V6
▪ Measure electrical cardiac
activity on a horizontal axis
▪ Help in viewing the left
ventricle and septum
10.
The Electrocardiogram
• RoutineMonitoring
• Routine ECG monitoring generally uses only one
lead
• Most common monitoring leads are either lead II
or the modified chest lead 1 (MCL1)
• Einthoven’s triangle offers a basis for placing the
leads
• Place the electrodes on the chest wall
• Lead placement
11.
Single Lead Monitoring
•Information from a
single lead shows:
• Rate
• Regularity
• Time to conduct an
impulse
• Single lead cannot show:
• Presence of an infarct
• Axis deviation or chamber
enlargement
• Right-to-left differences in
conduction
• Quality or presence of
pumping action
12.
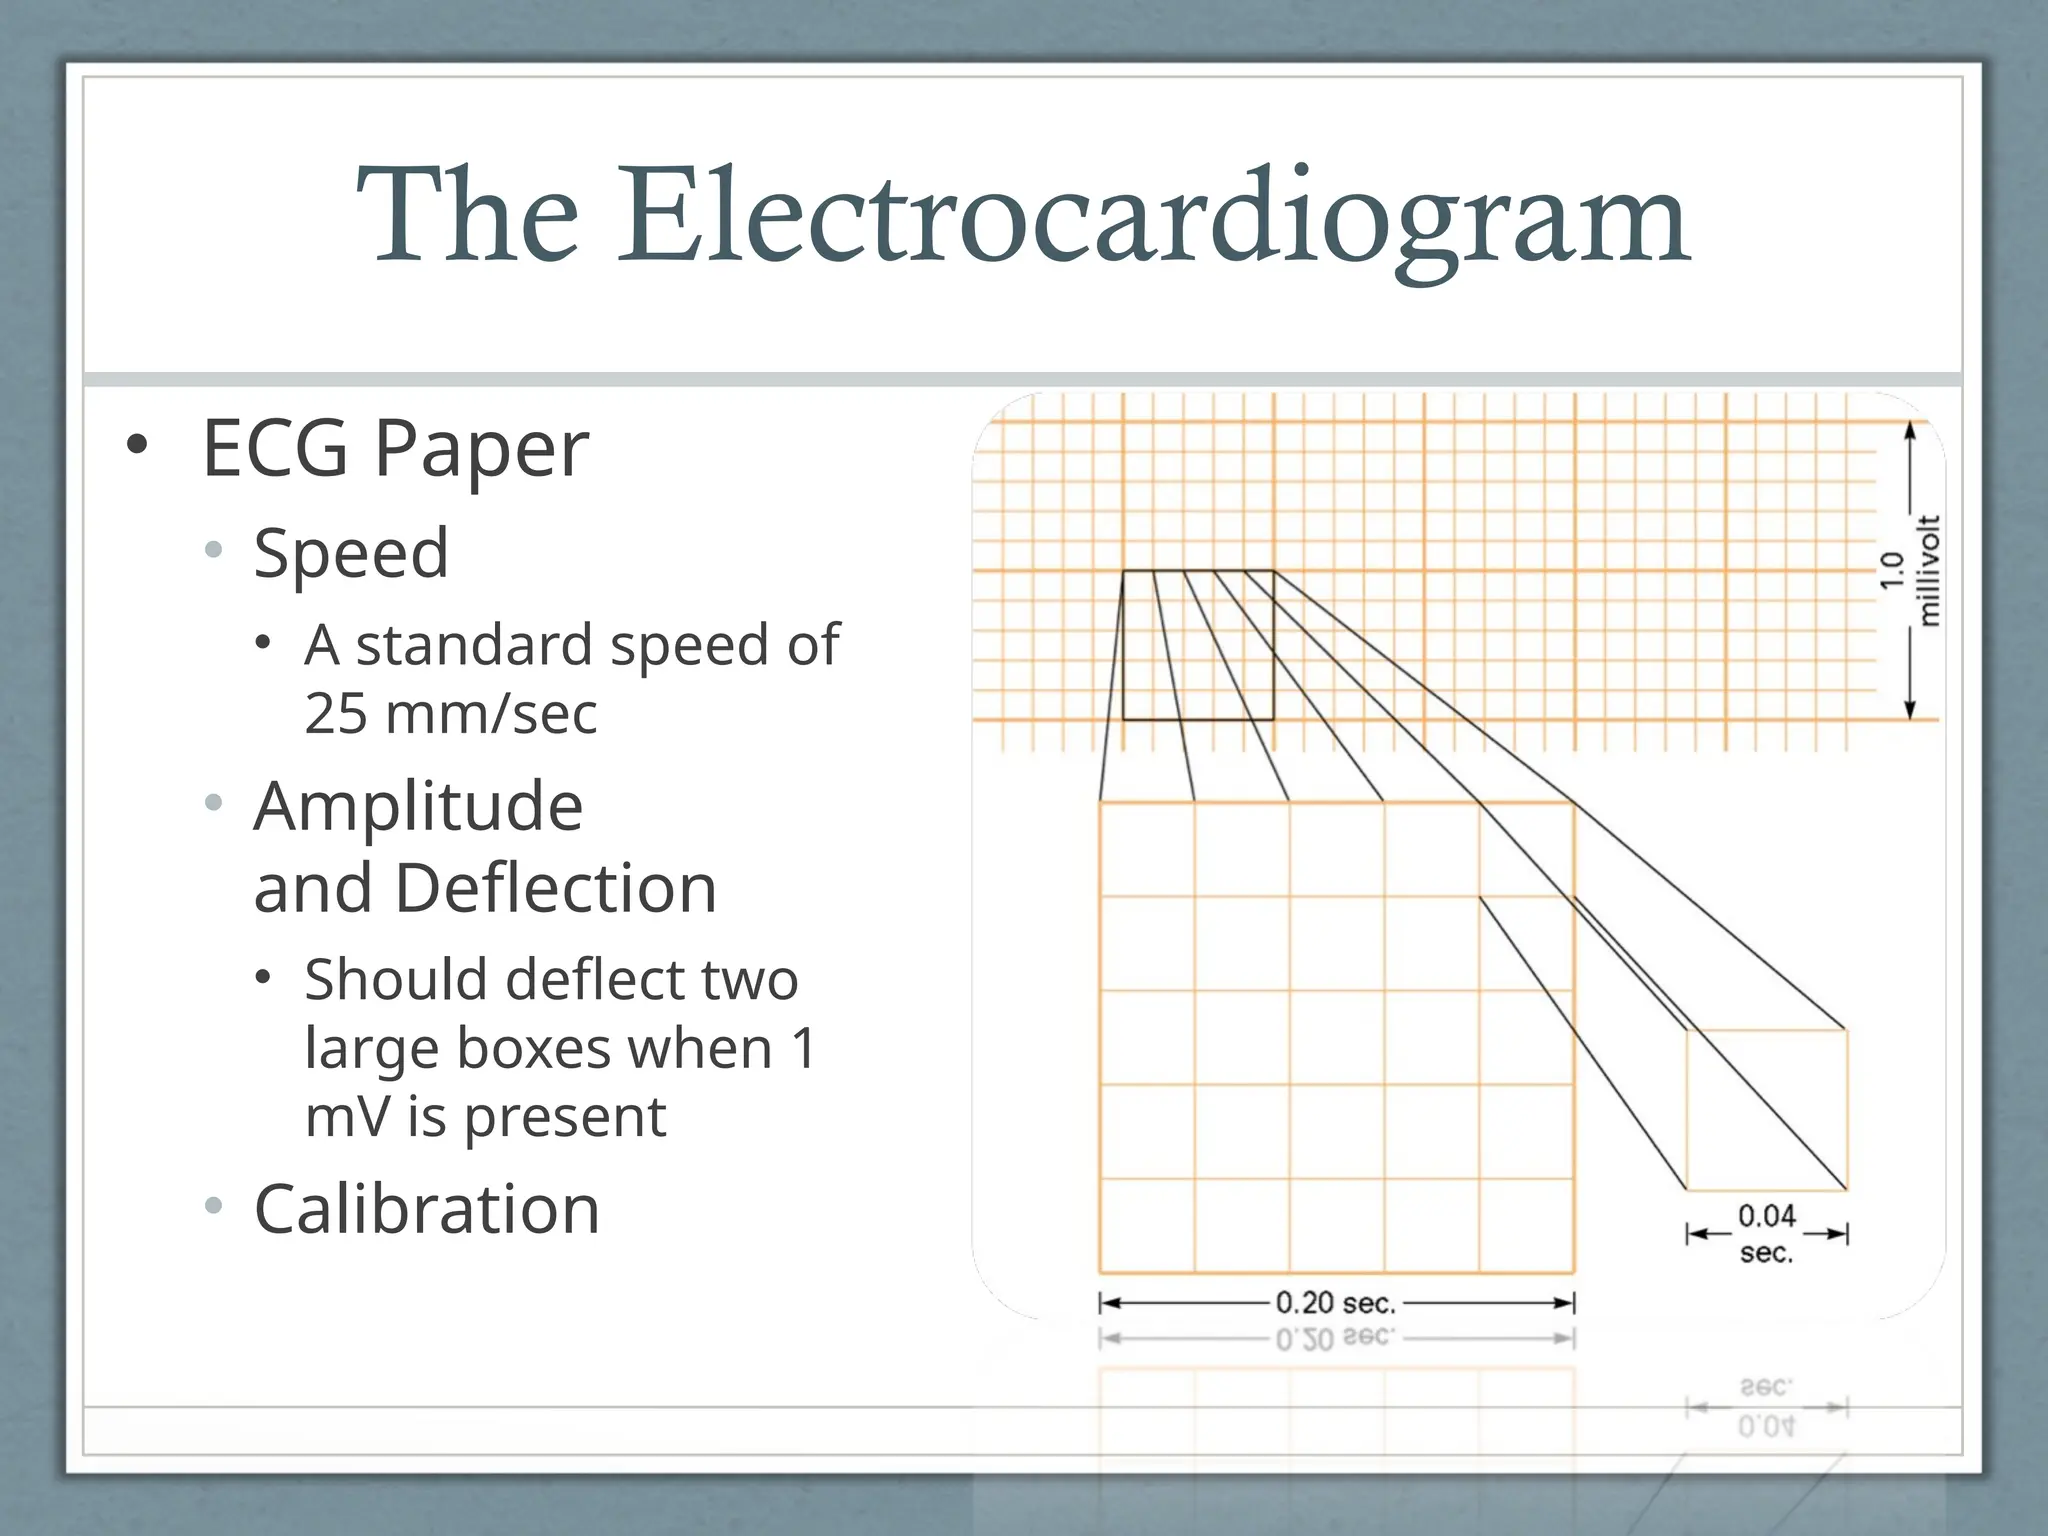
The Electrocardiogram
• ECGPaper
• Speed
• A standard speed of
25 mm/sec
• Amplitude
and Deflection
• Should deflect two
large boxes when 1
mV is present
• Calibration
The Electrocardiogram
• TimeIntervals
• PR Interval (PRI) or
PQ Interval (PQI)
• 0.12–0.20 seconds
• QRS Interval
• 0.08–0.12 seconds
• ST Segment
• QT Interval
• 0.33–0.42 seconds
22.
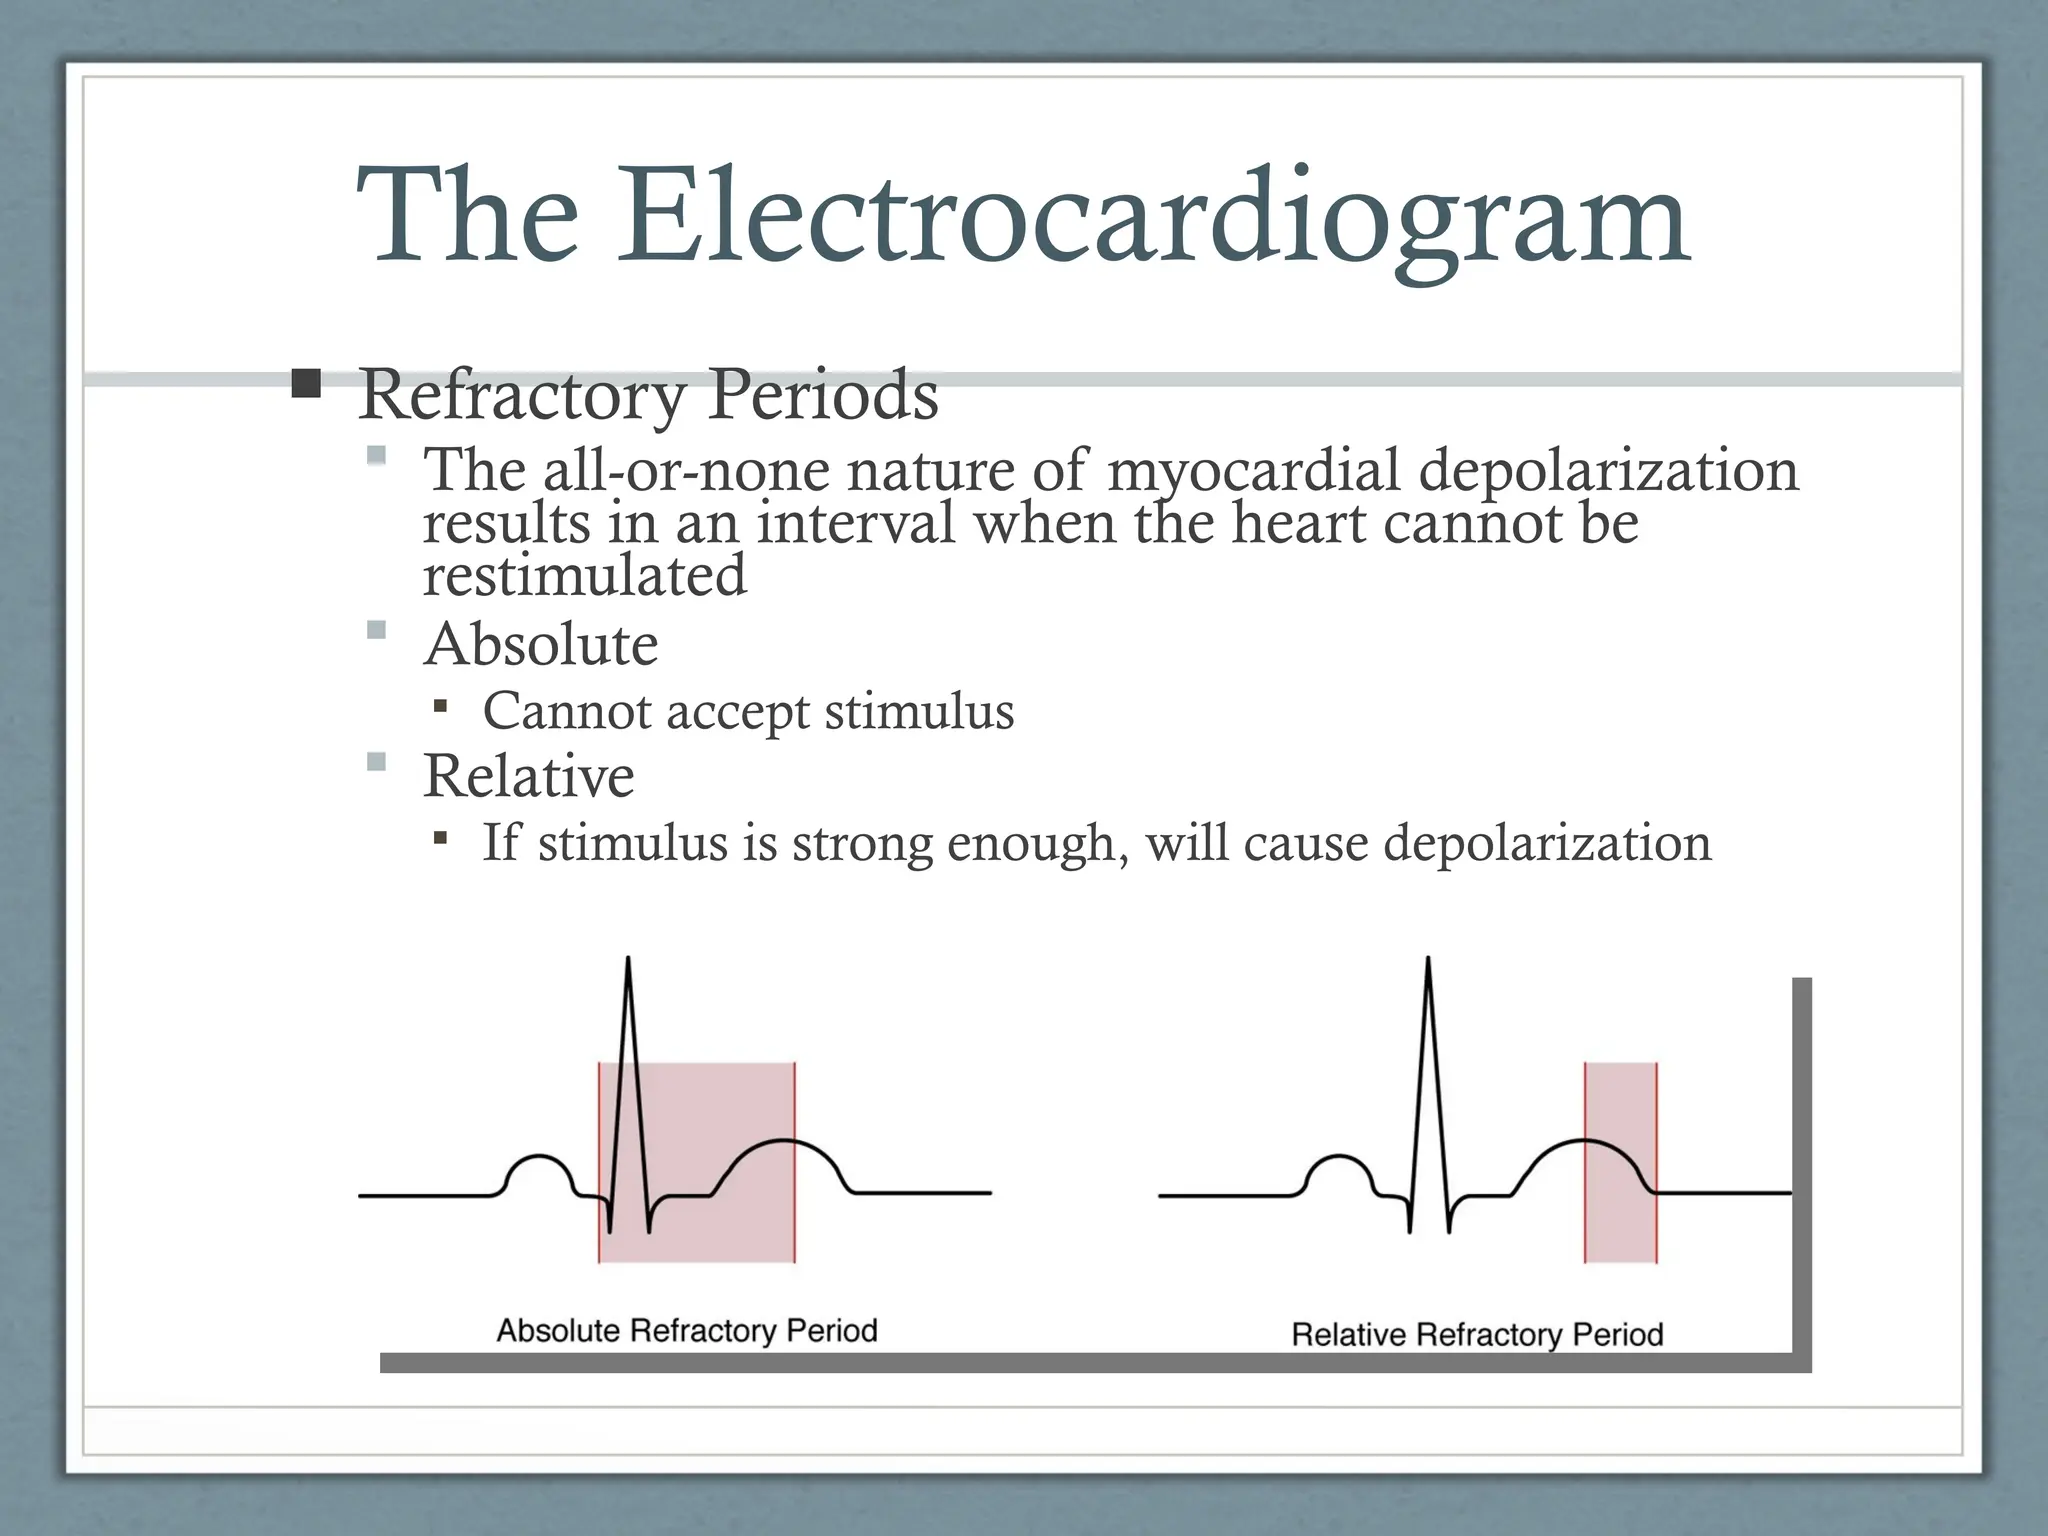
The Electrocardiogram
RefractoryPeriods
The all-or-none nature of myocardial depolarization
results in an interval when the heart cannot be
restimulated
Absolute
▪ Cannot accept stimulus
Relative
▪ If stimulus is strong enough, will cause depolarization
23.
The Electrocardiogram
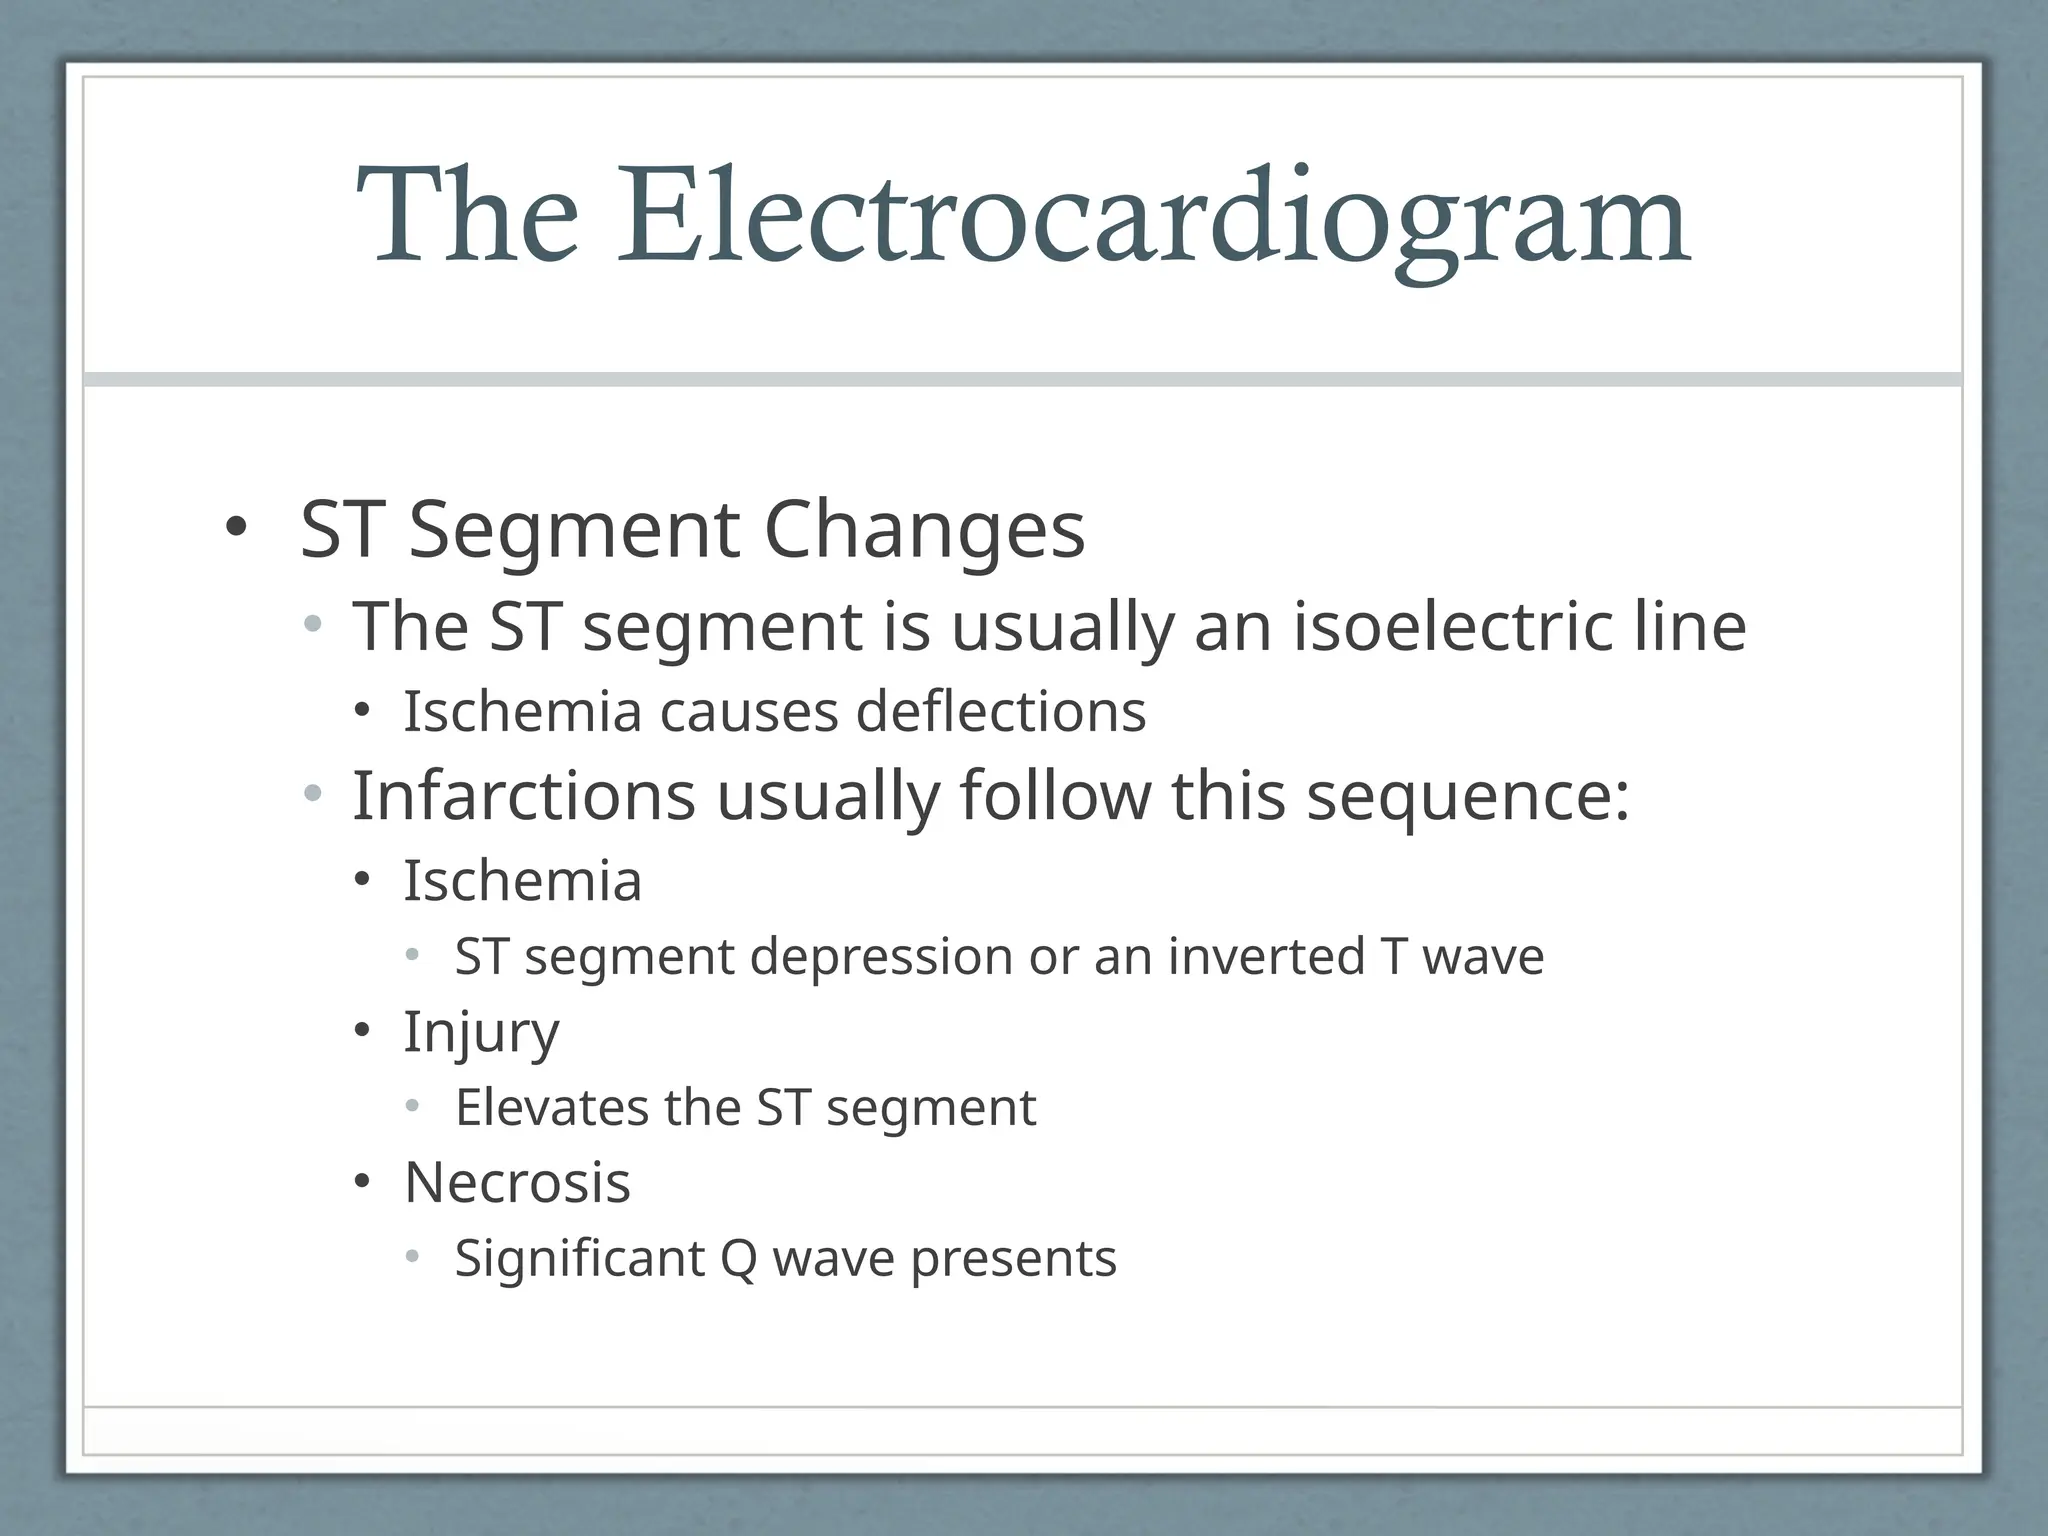
• STSegment Changes
• The ST segment is usually an isoelectric line
• Ischemia causes deflections
• Infarctions usually follow this sequence:
• Ischemia
• ST segment depression or an inverted T wave
• Injury
• Elevates the ST segment
• Necrosis
• Significant Q wave presents
24.
The Electrocardiogram
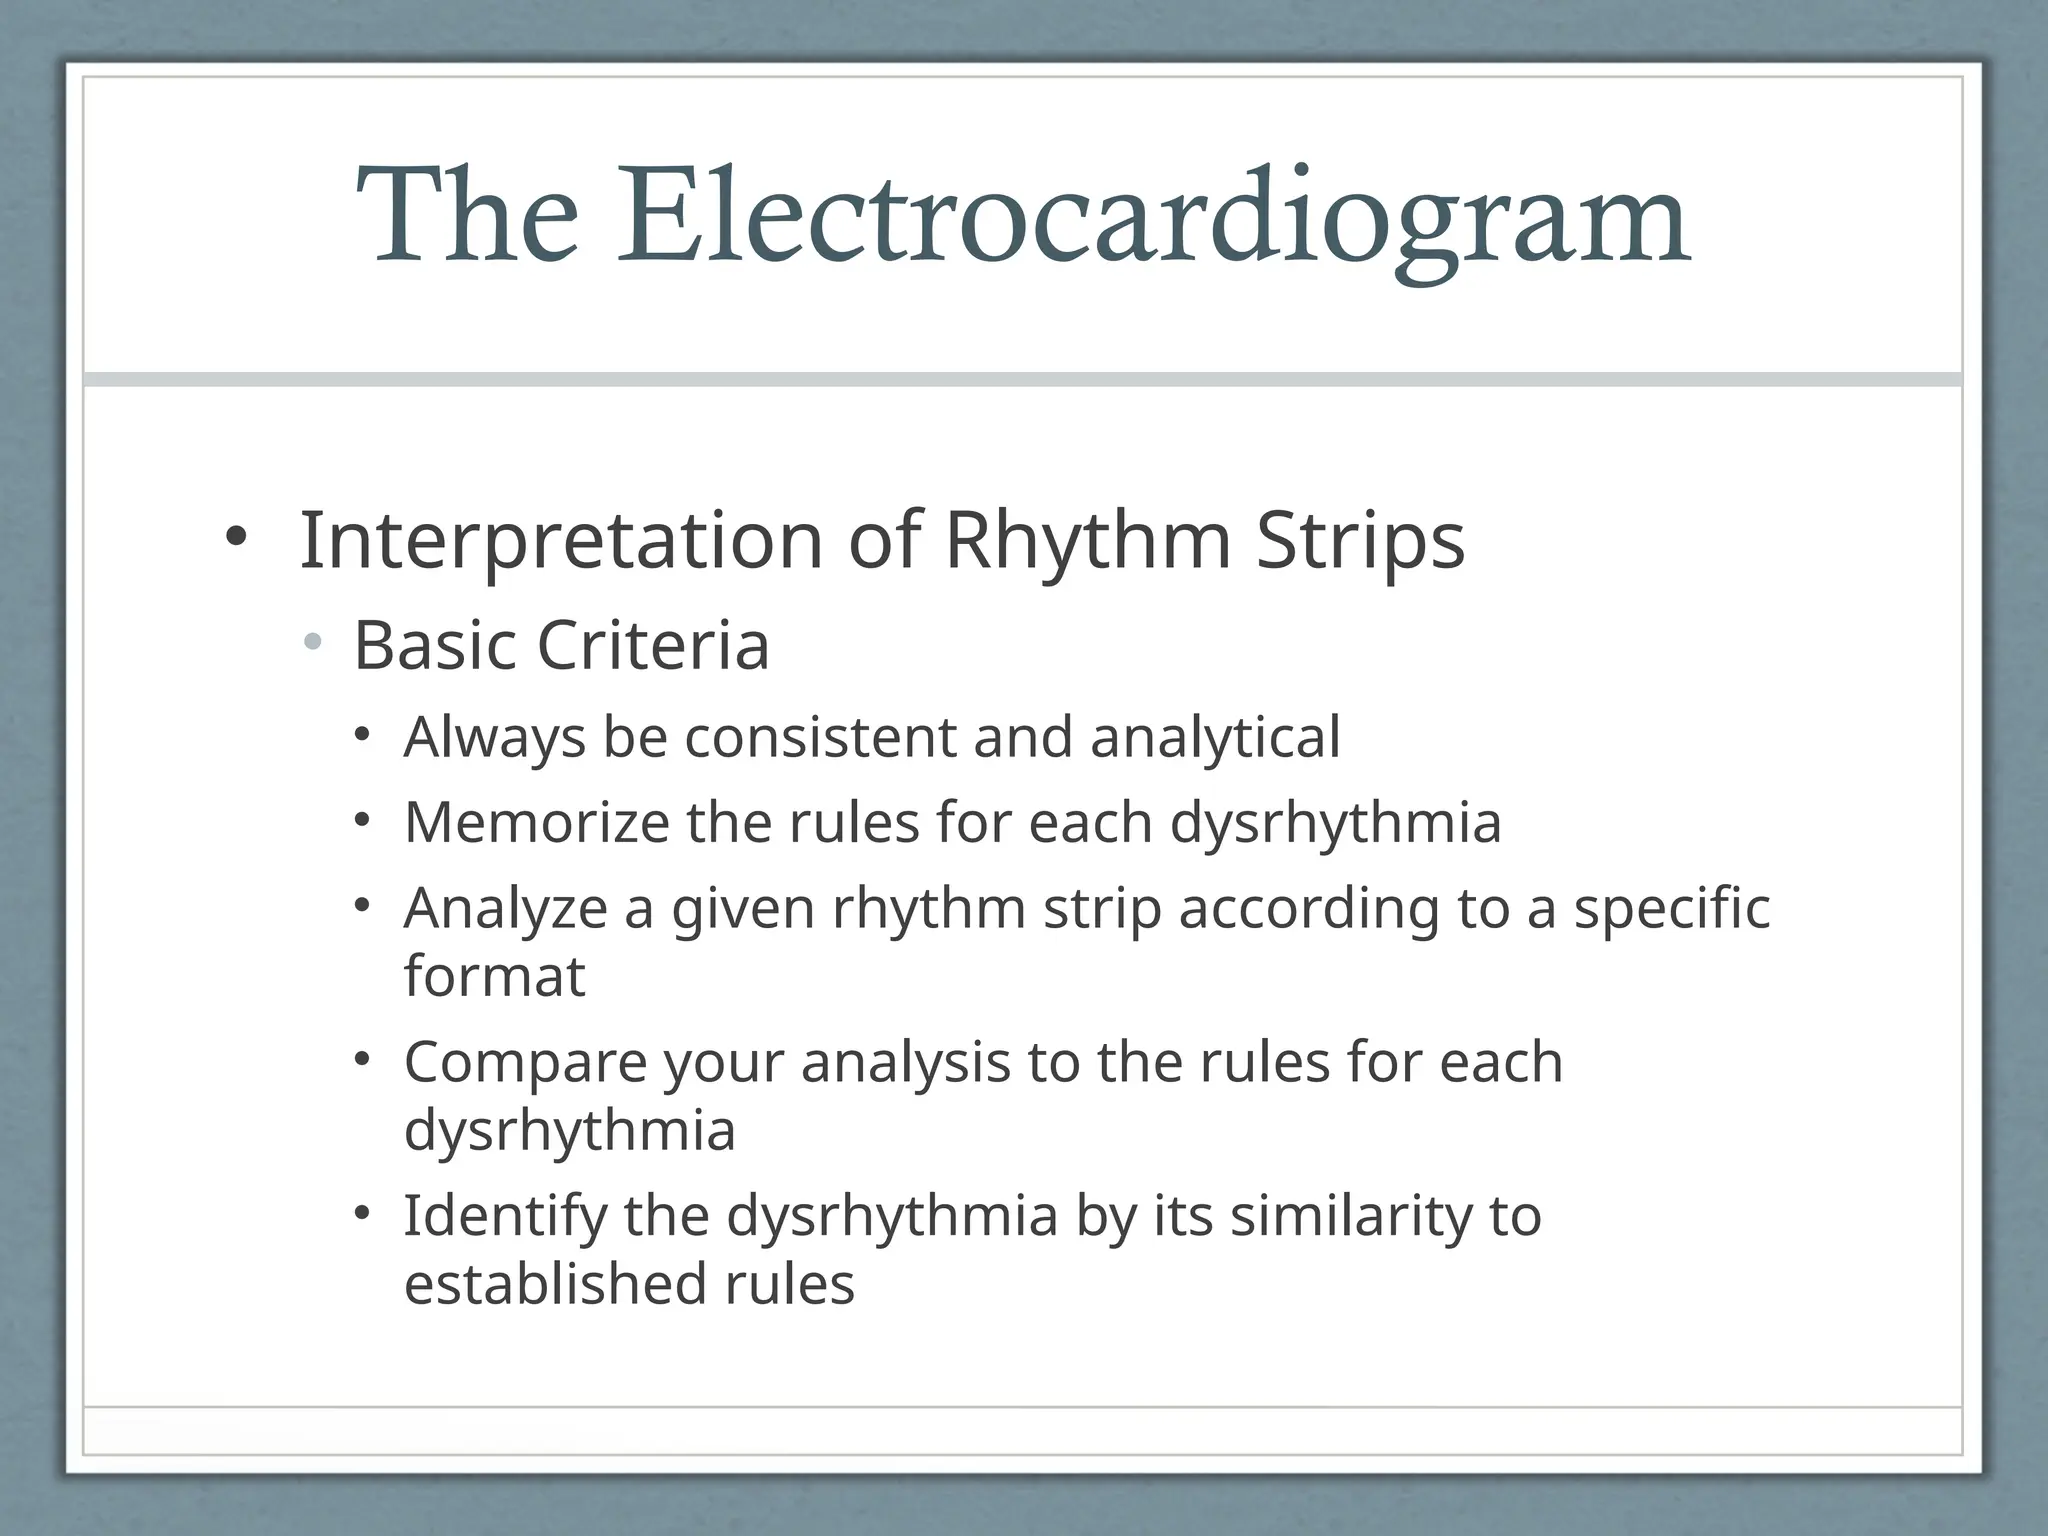
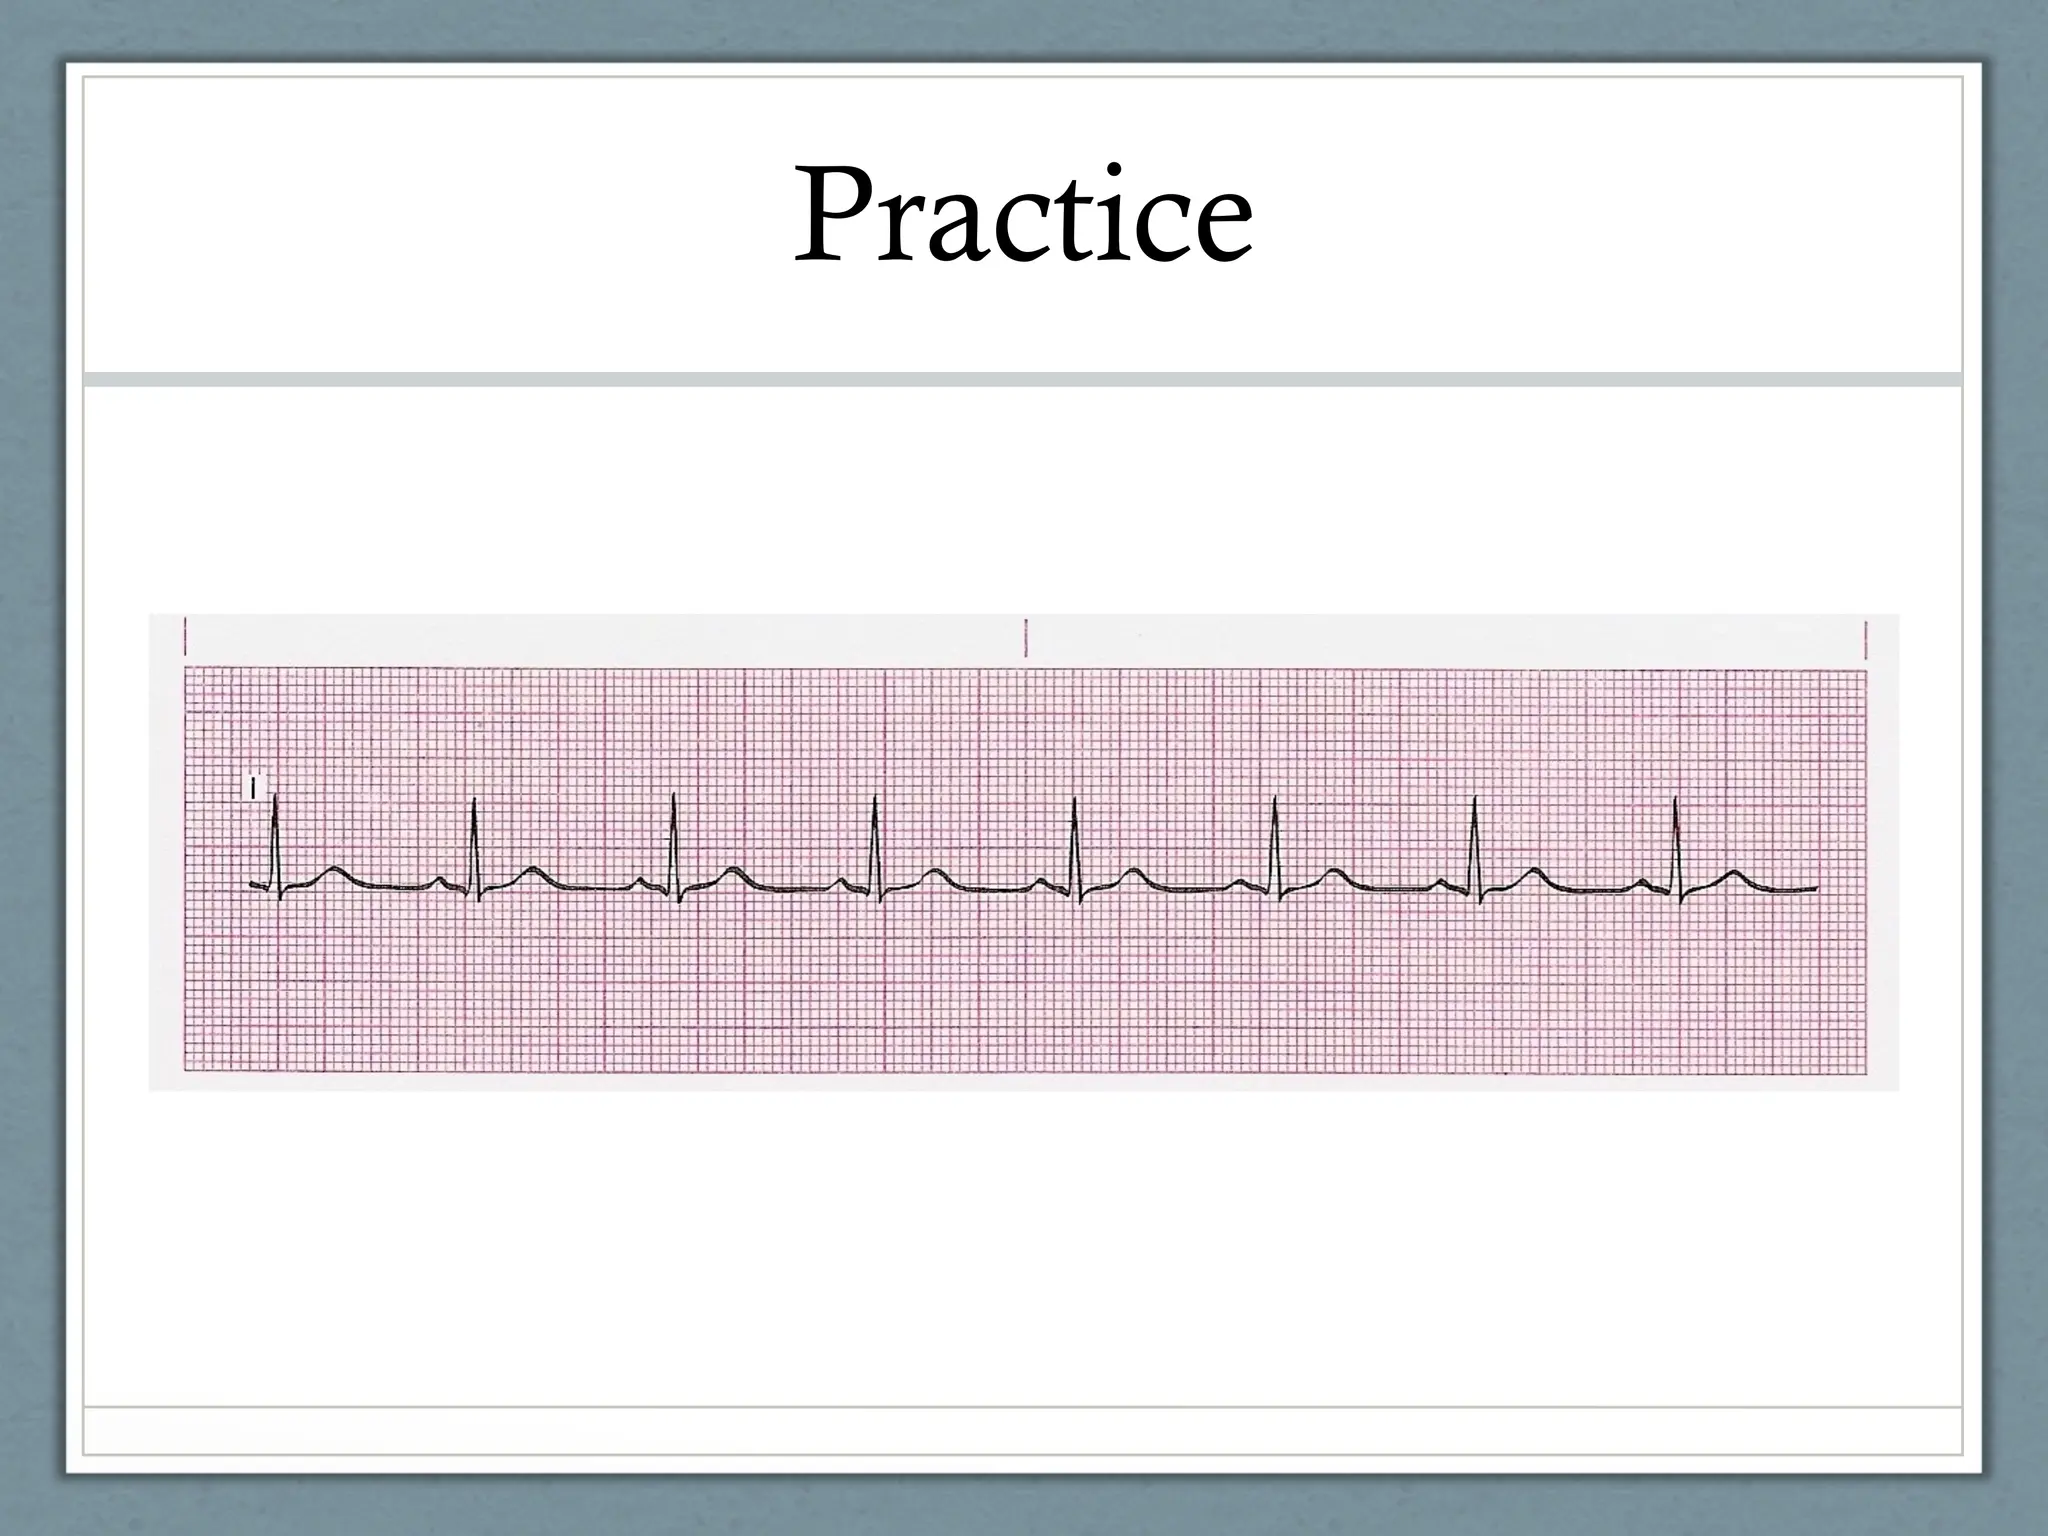
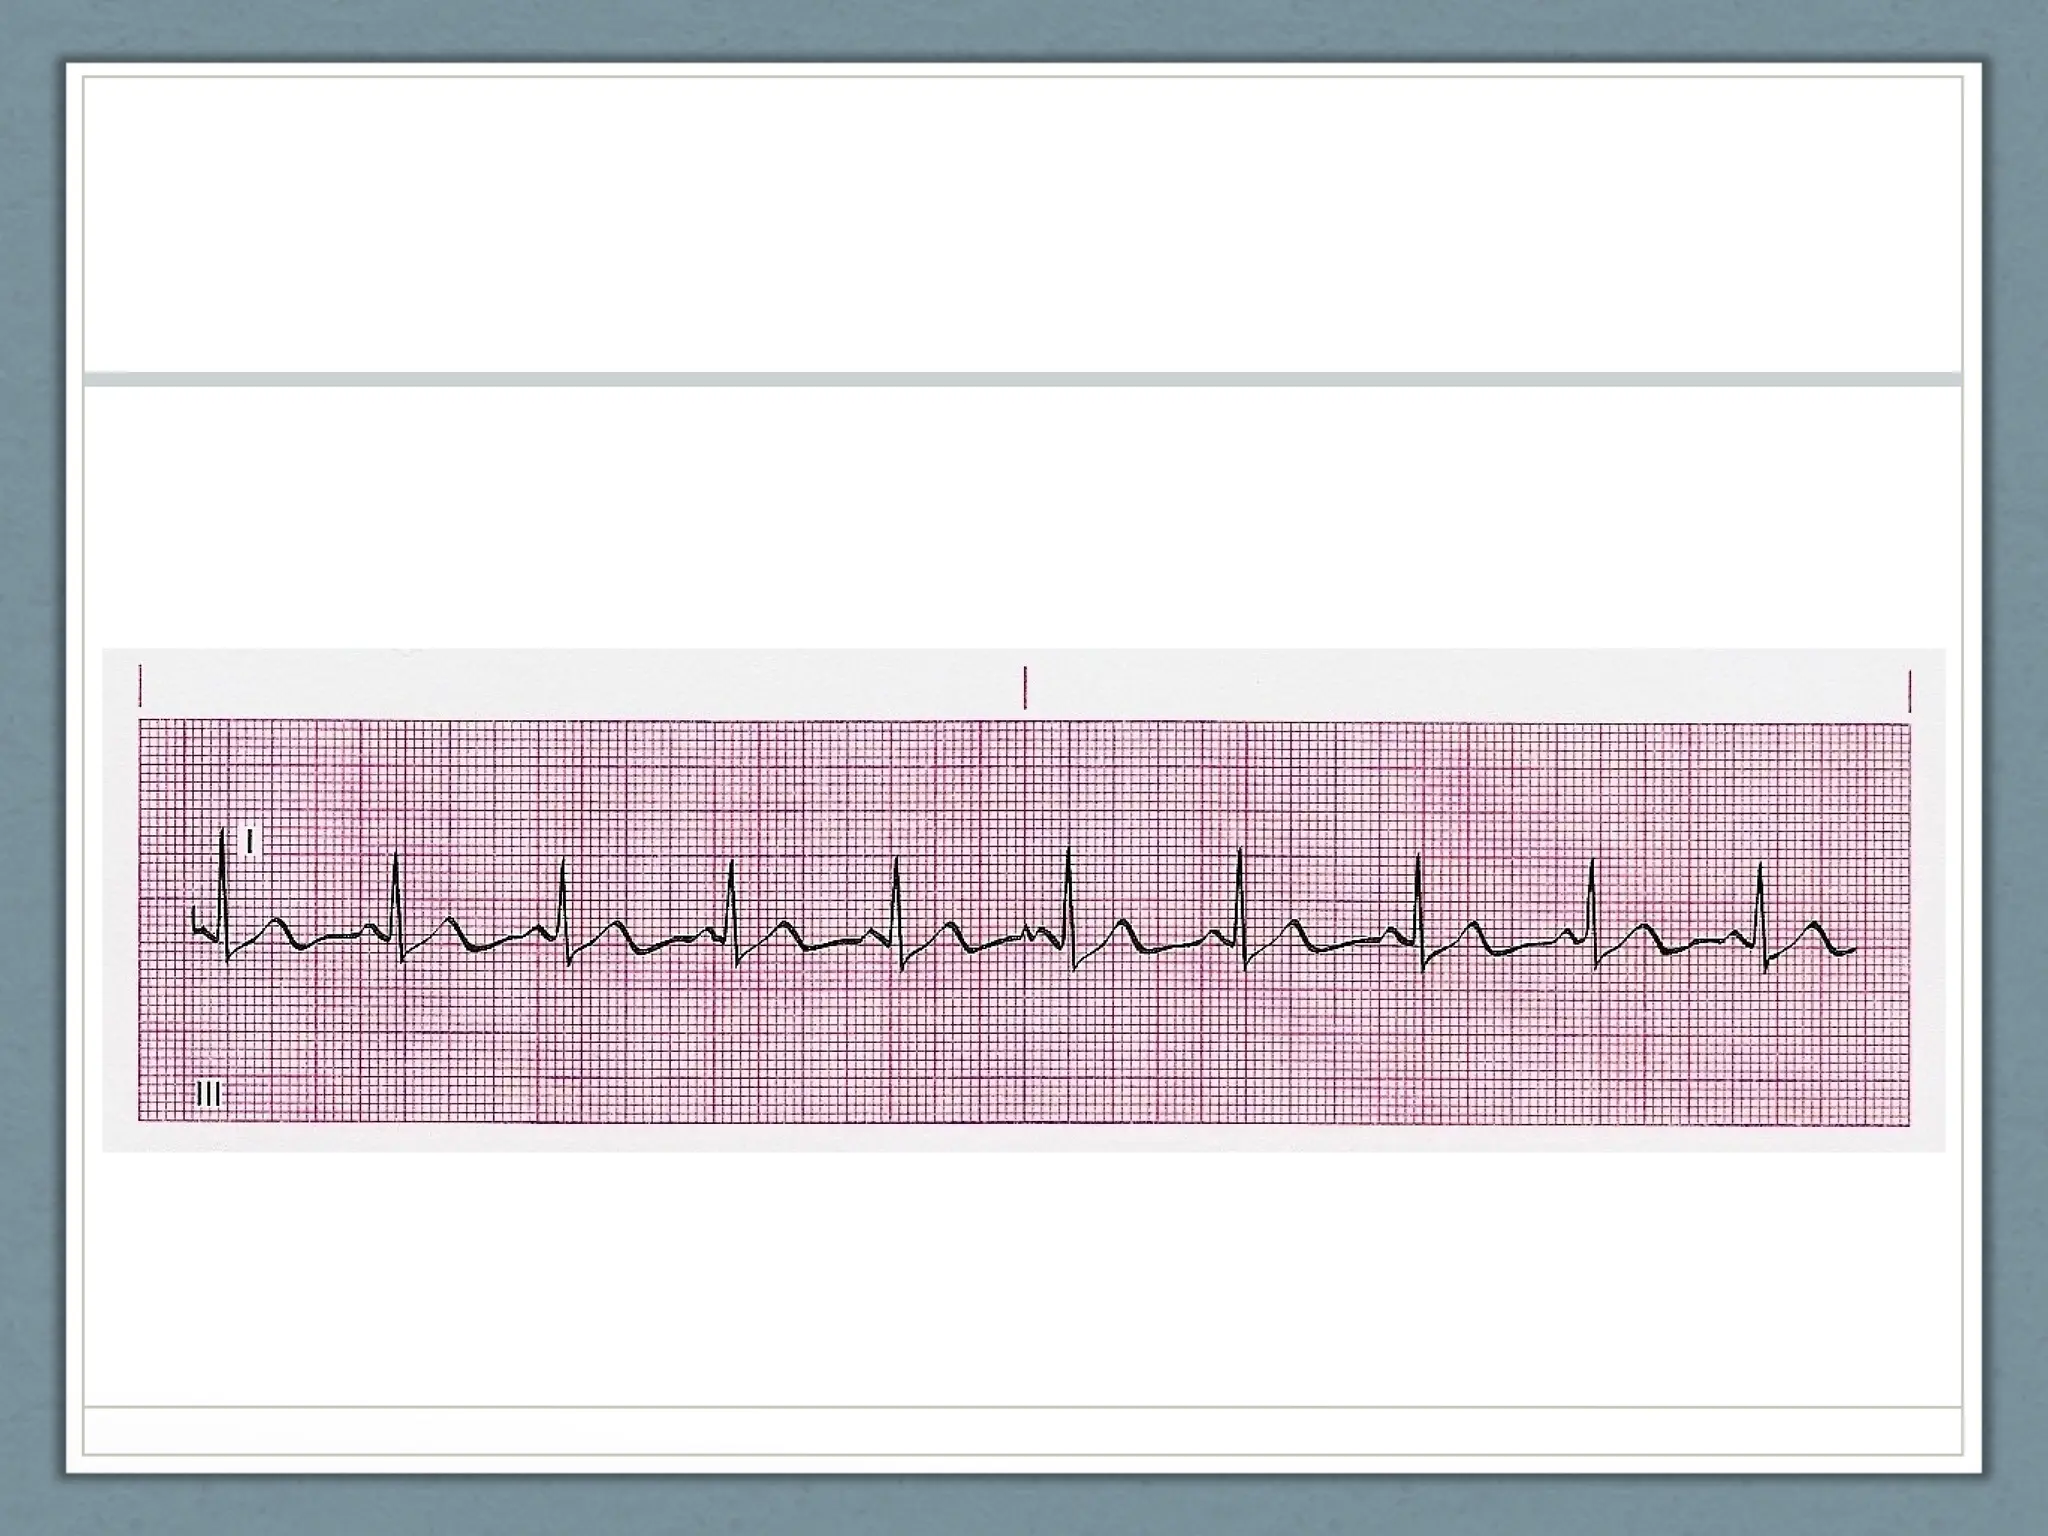
• Interpretationof Rhythm Strips
• Basic Criteria
• Always be consistent and analytical
• Memorize the rules for each dysrhythmia
• Analyze a given rhythm strip according to a specific
format
• Compare your analysis to the rules for each
dysrhythmia
• Identify the dysrhythmia by its similarity to
established rules
25.
The Electrocardiogram
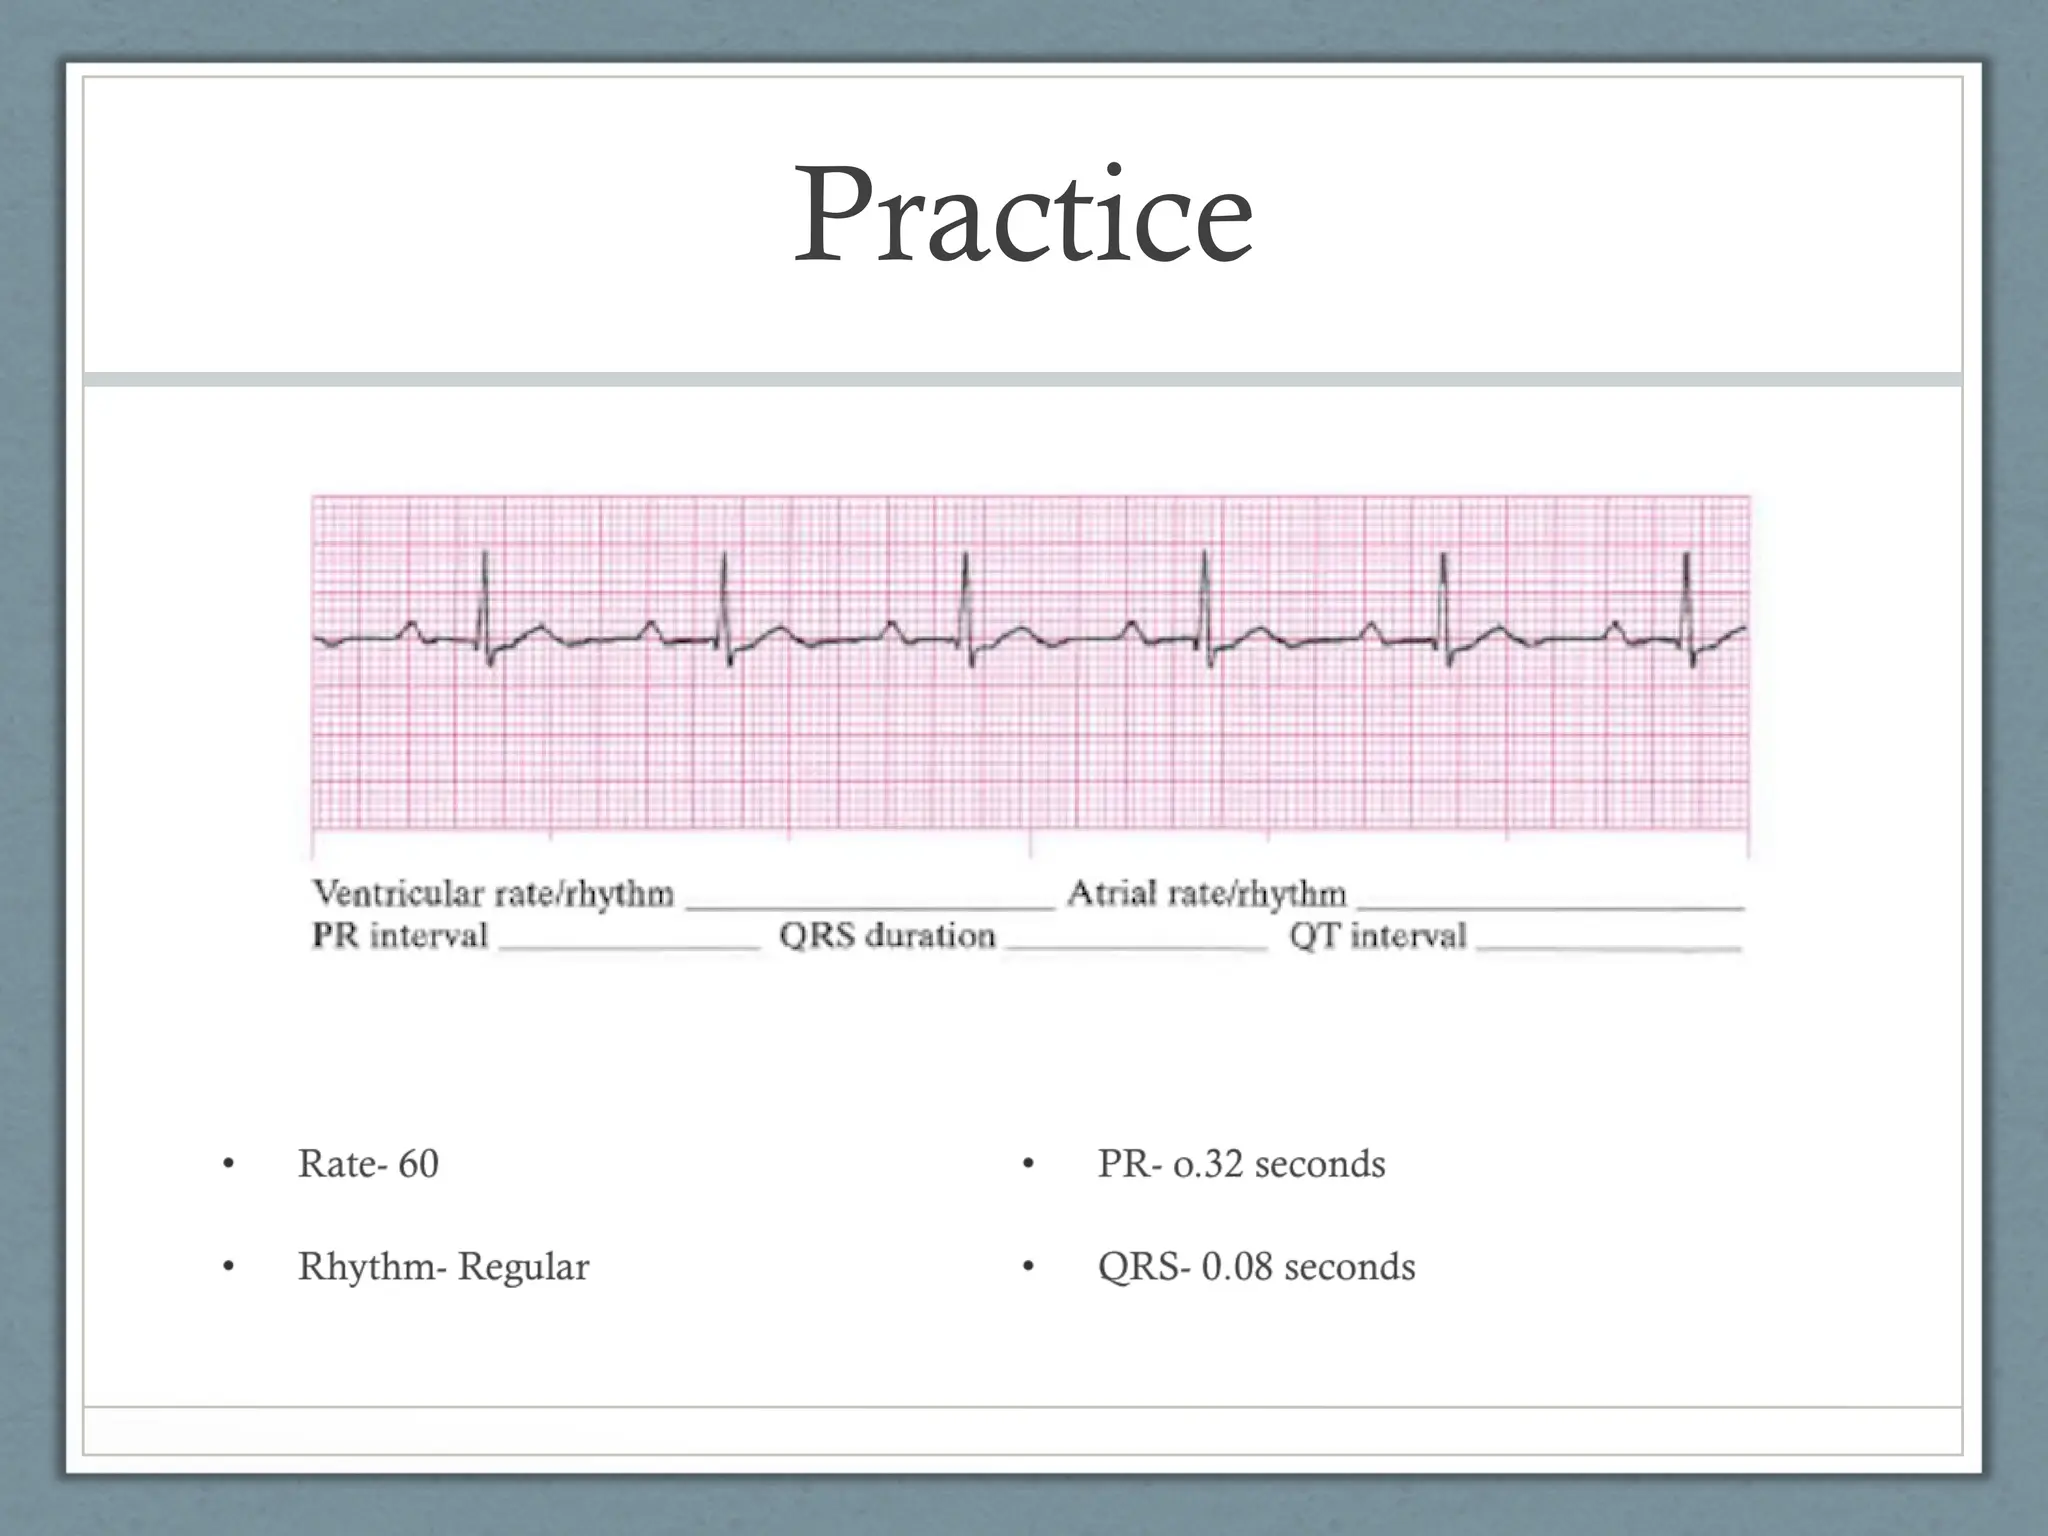
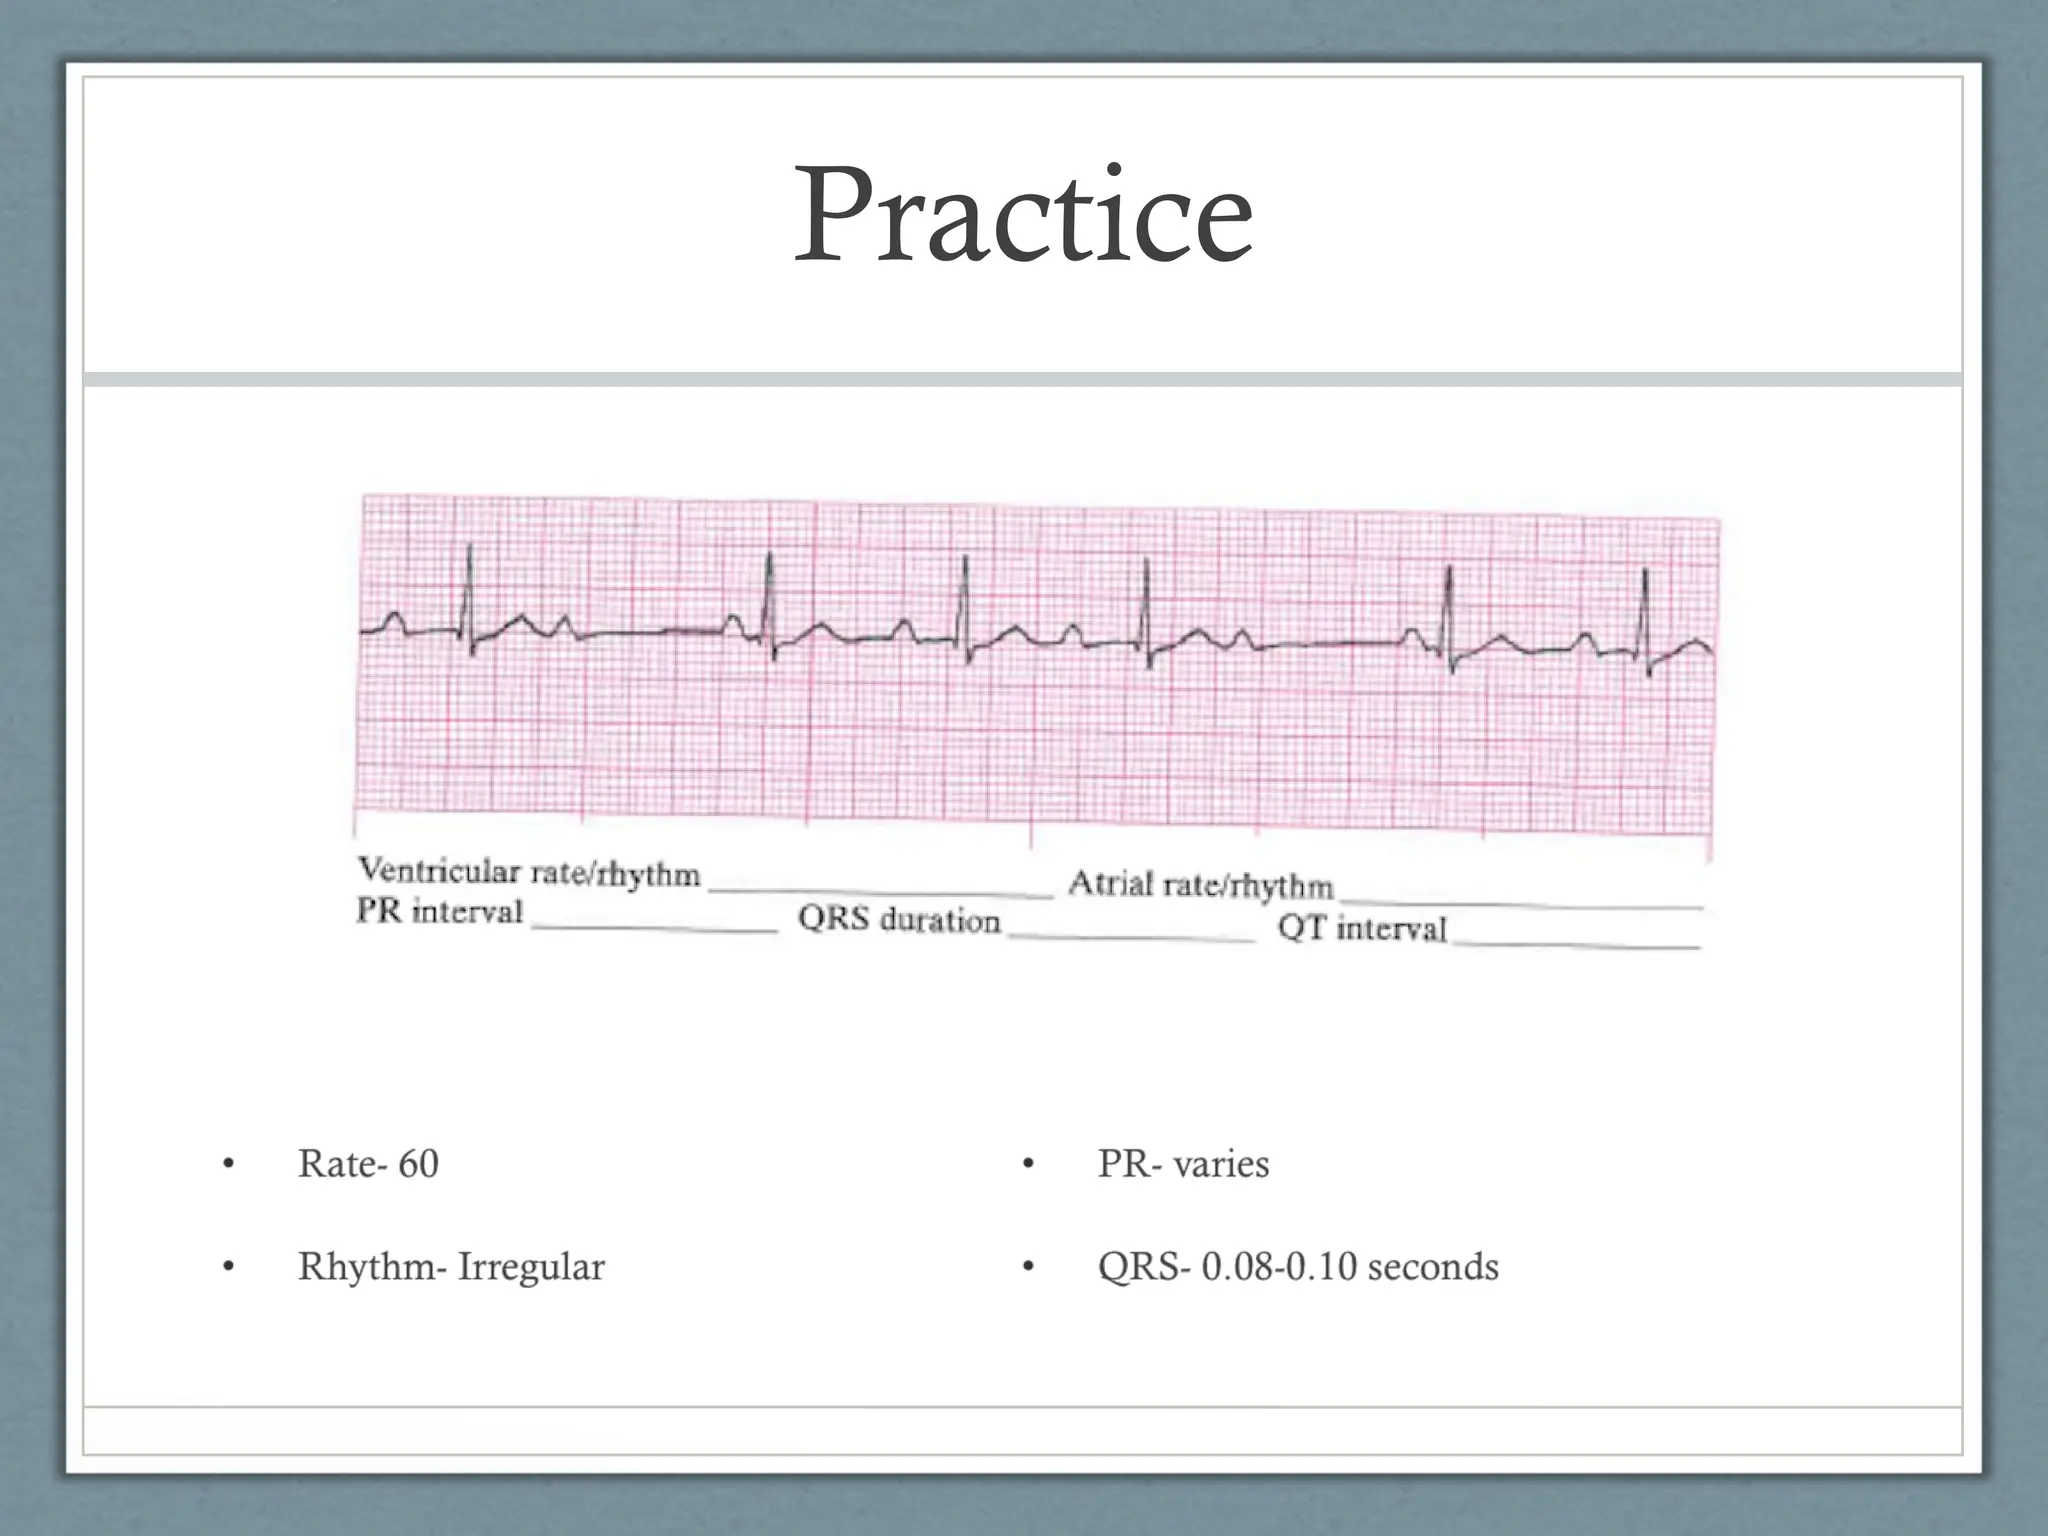
• Five-StepProcedure
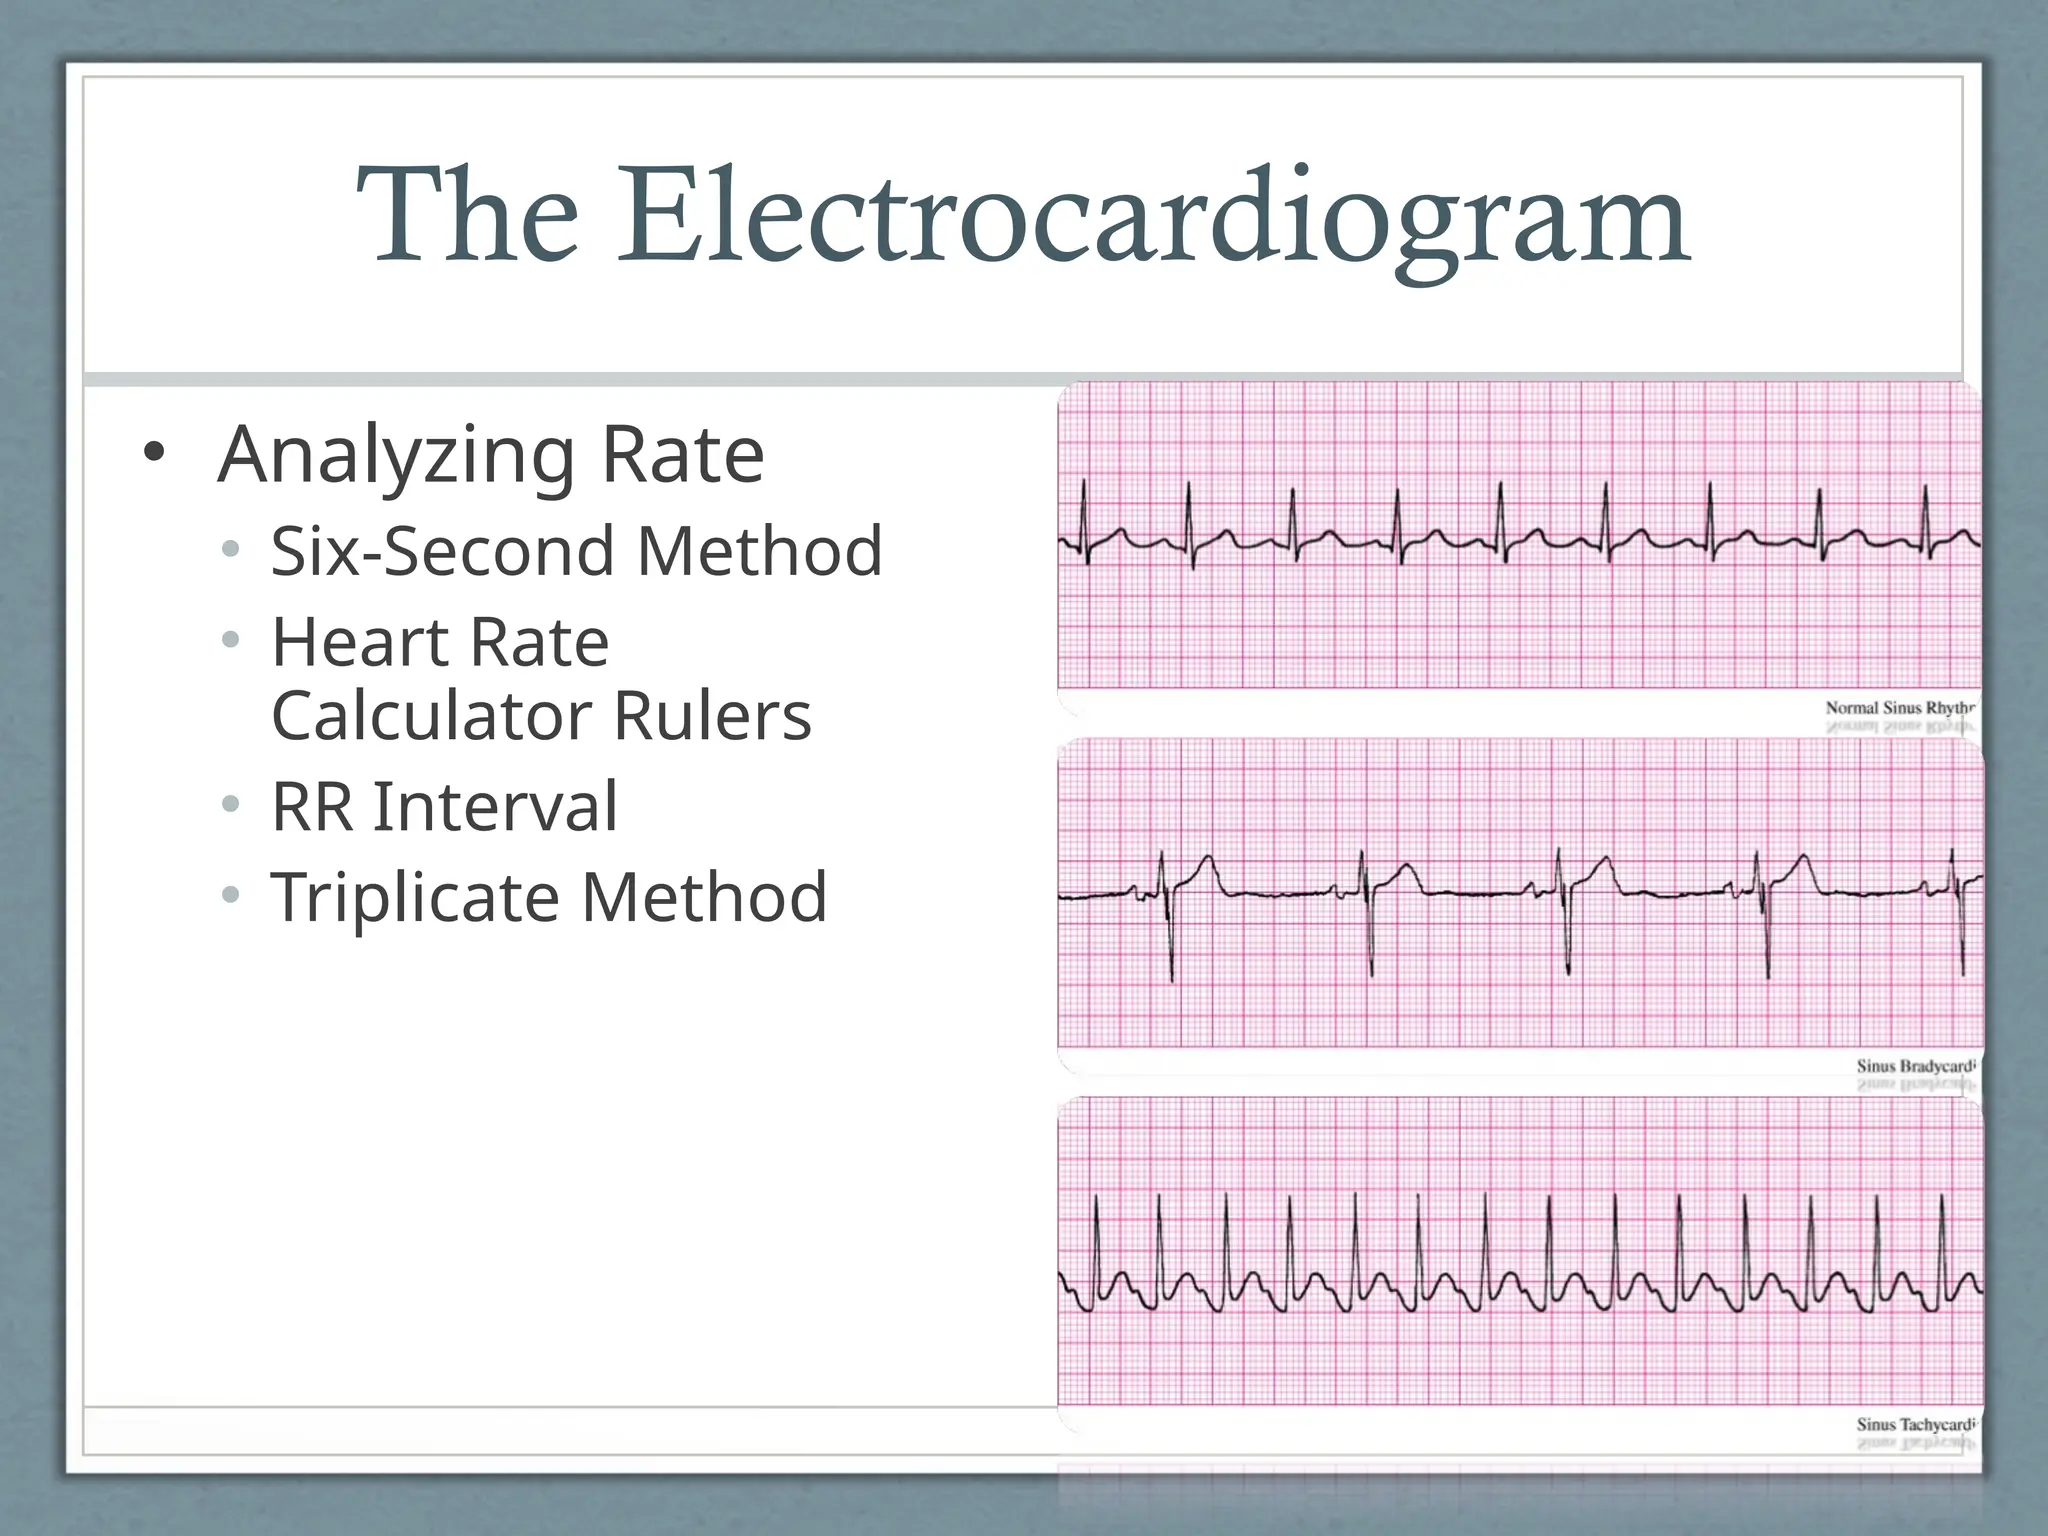
• Analyze the rate
• Analyze the rhythm
• Analyze the P waves
• Analyze the PR interval
• Analyze the QRS complex
The Electrocardiogram
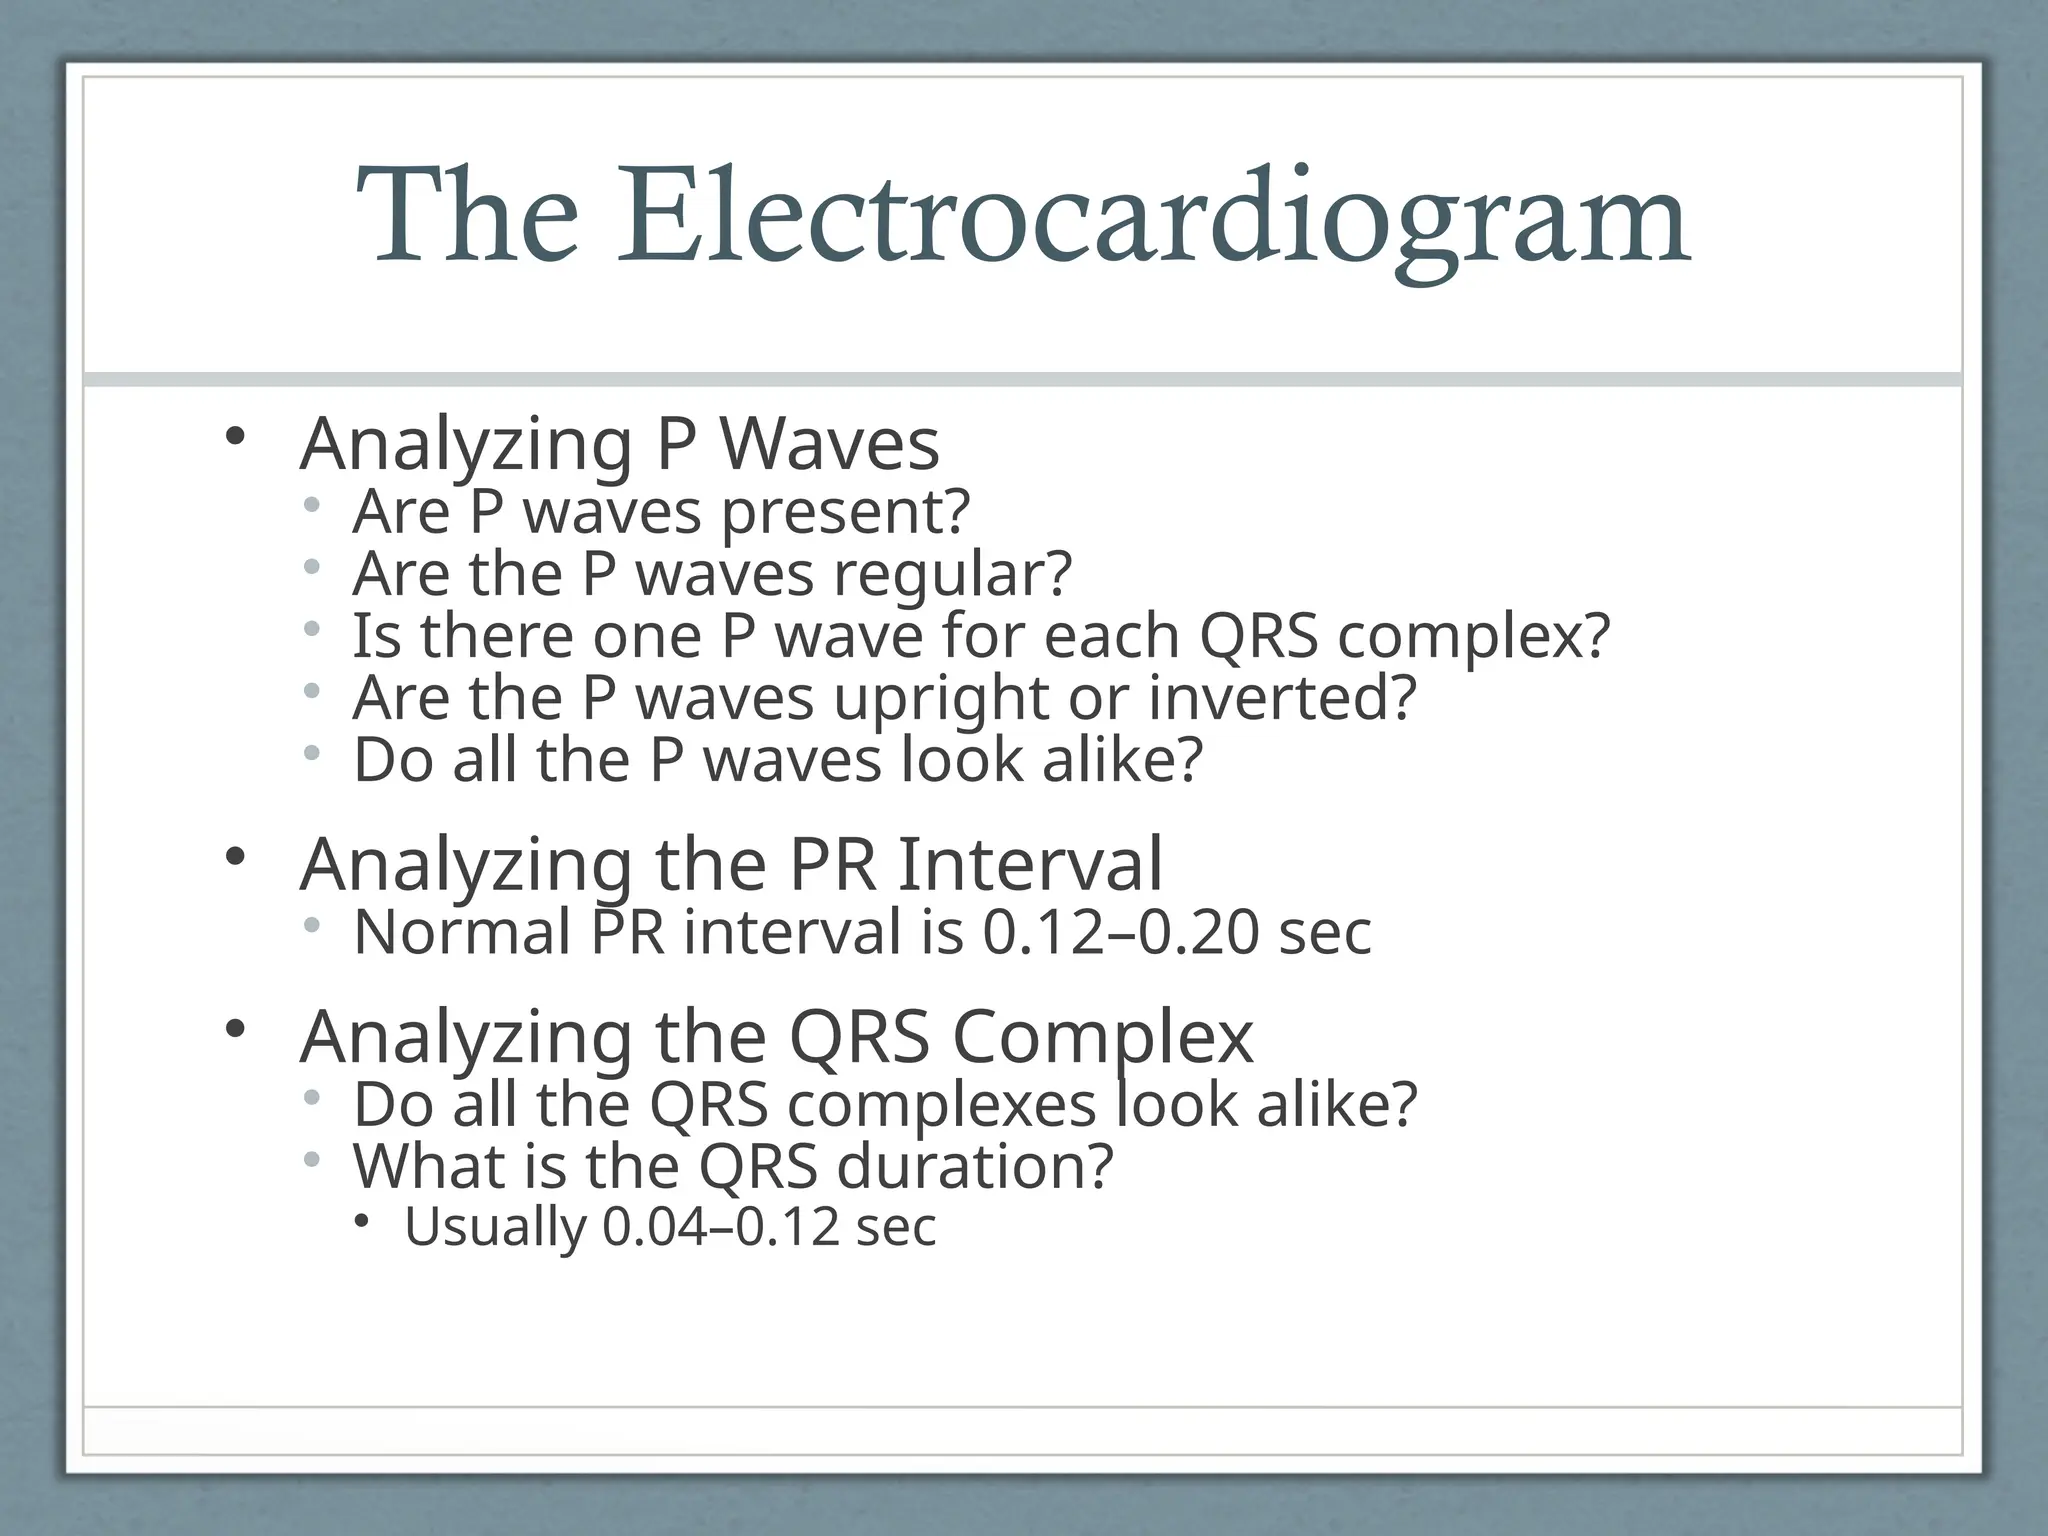
• AnalyzingP Waves
• Are P waves present?
• Are the P waves regular?
• Is there one P wave for each QRS complex?
• Are the P waves upright or inverted?
• Do all the P waves look alike?
• Analyzing the PR Interval
• Normal PR interval is 0.12–0.20 sec
• Analyzing the QRS Complex
• Do all the QRS complexes look alike?
• What is the QRS duration?
• Usually 0.04–0.12 sec
Causes of Dysrhythmias
•Myocardial Ischemia, Necrosis, or Infarction
• Autonomic Nervous System Imbalance
• Distention of the Chambers of the Heart
• Blood Gas Abnormalities
• Electrolyte Imbalances
43.
Causes of Dysrhythmias
•Trauma to the Myocardium
• Drug Effects and Drug Toxicity
• Electrocution
• Hypothermia
• CNS Damage
• Idiopathic Events
• Normal Occurrences
44.
Dysrhythmias
• Mechanism ofImpulse Formation
• Ectopic Foci
• Result of enhanced automaticity
• Cells other than the pacemaker cells automatically
depolarize
• PVC’s, PAC’s, and PJC’s
• Reentry
• Ischemia or another disease process alters two
branches of a conduction pathway
• Can result in rapid rhythms such as paroxysmal
supraventricular tachycardia or atrial fibrillation
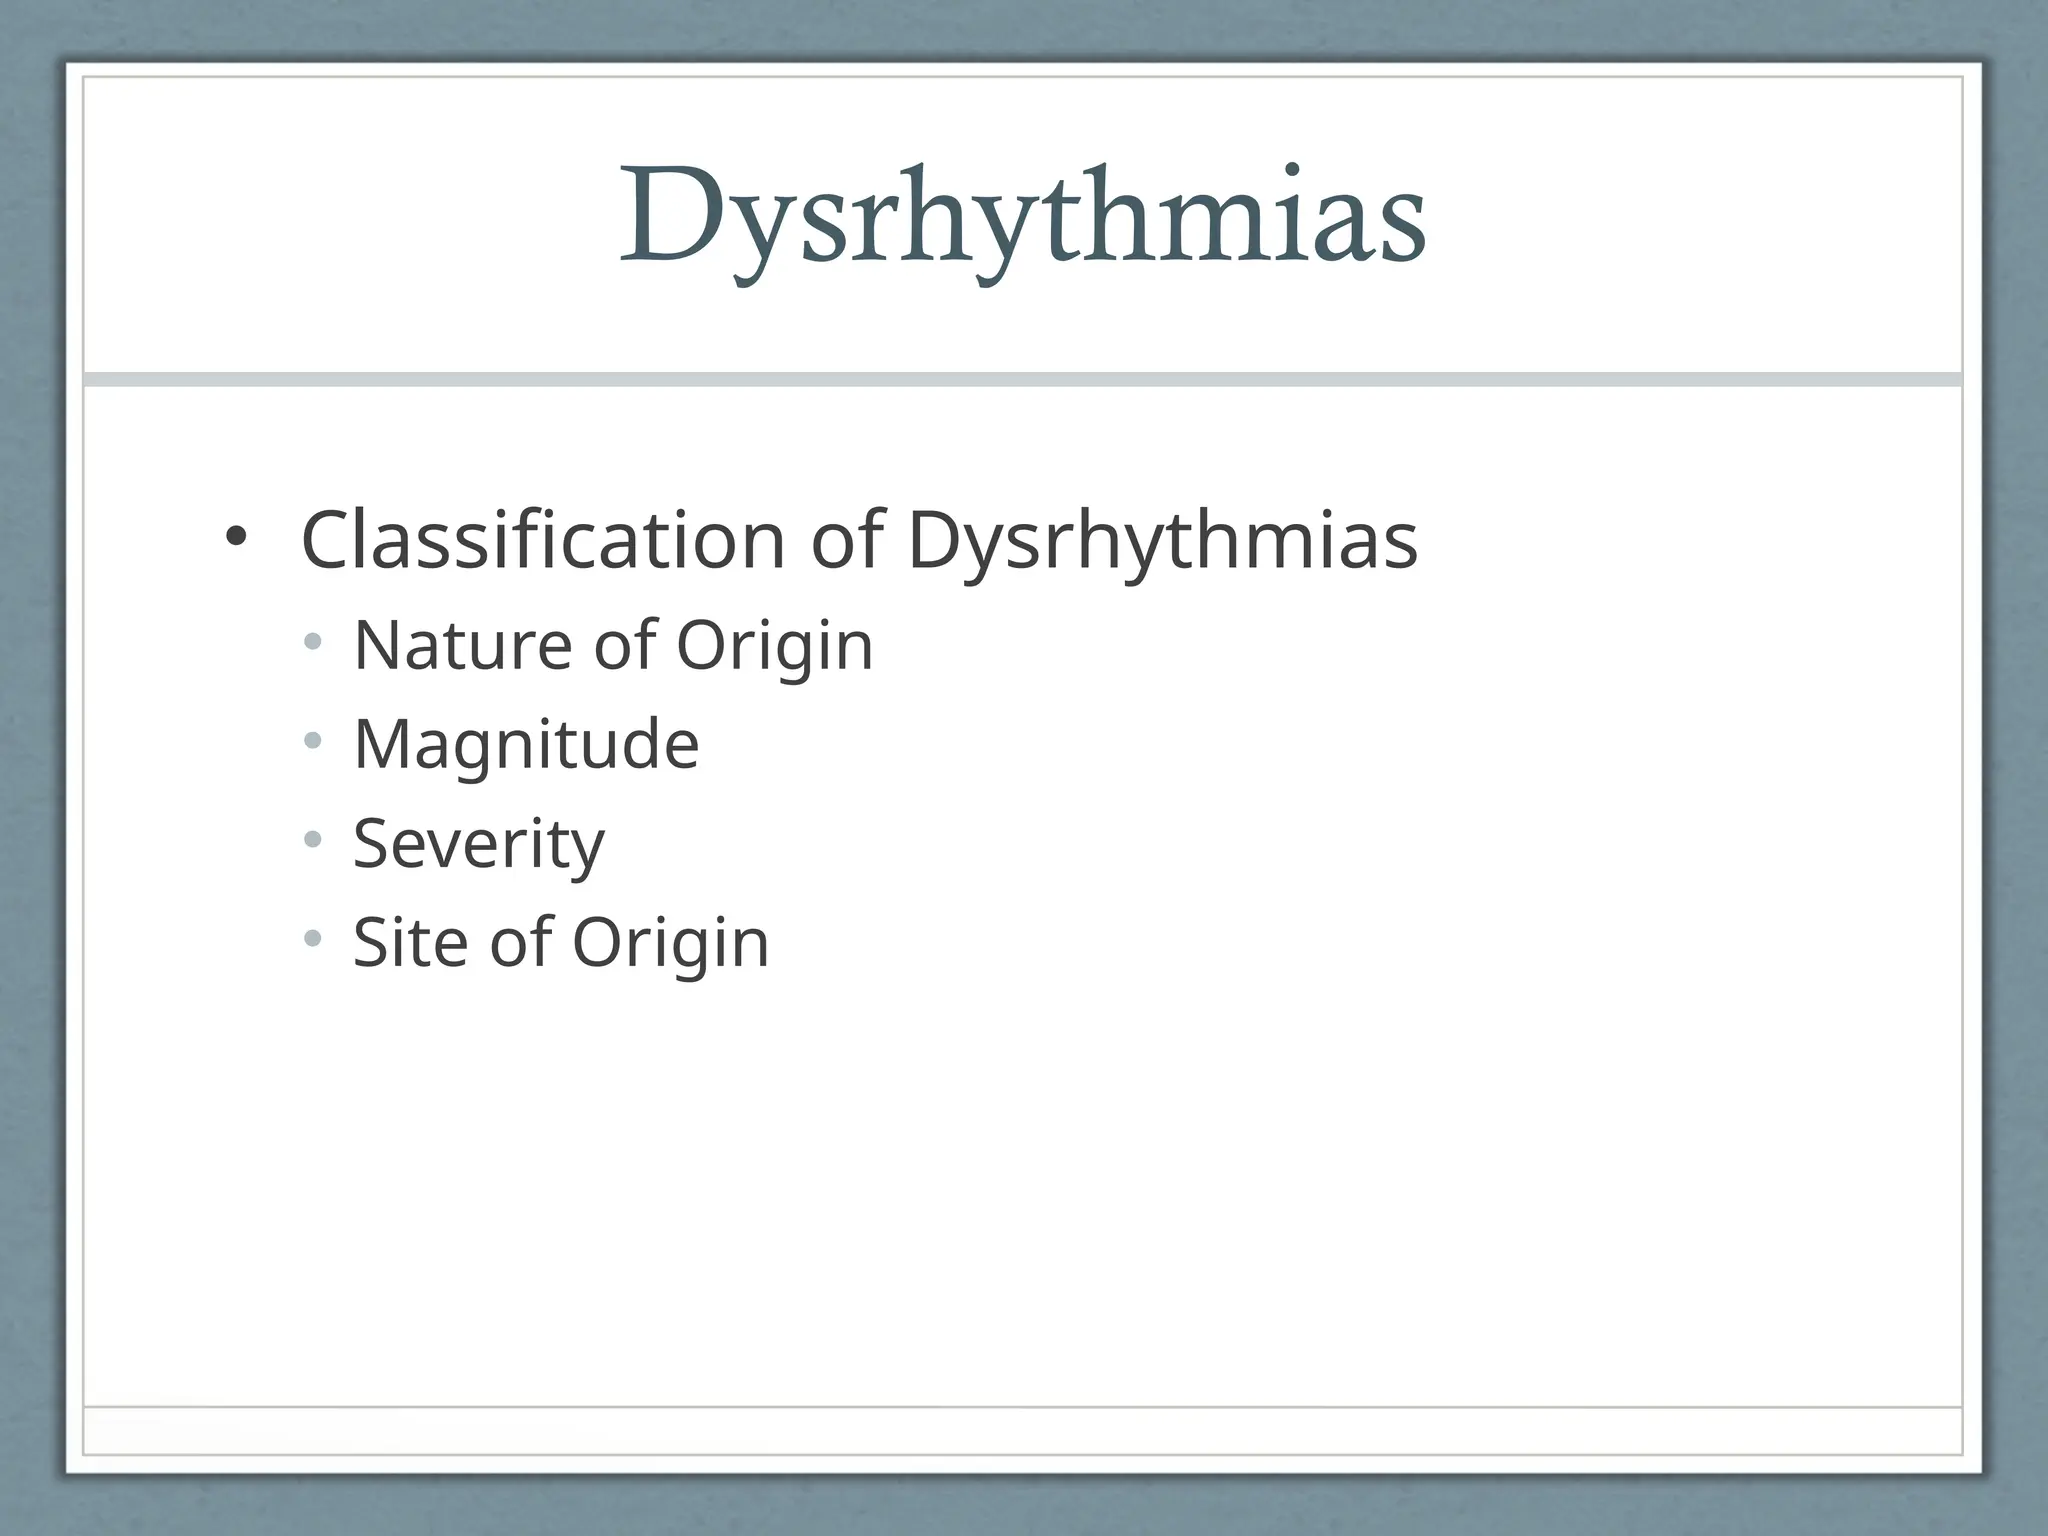
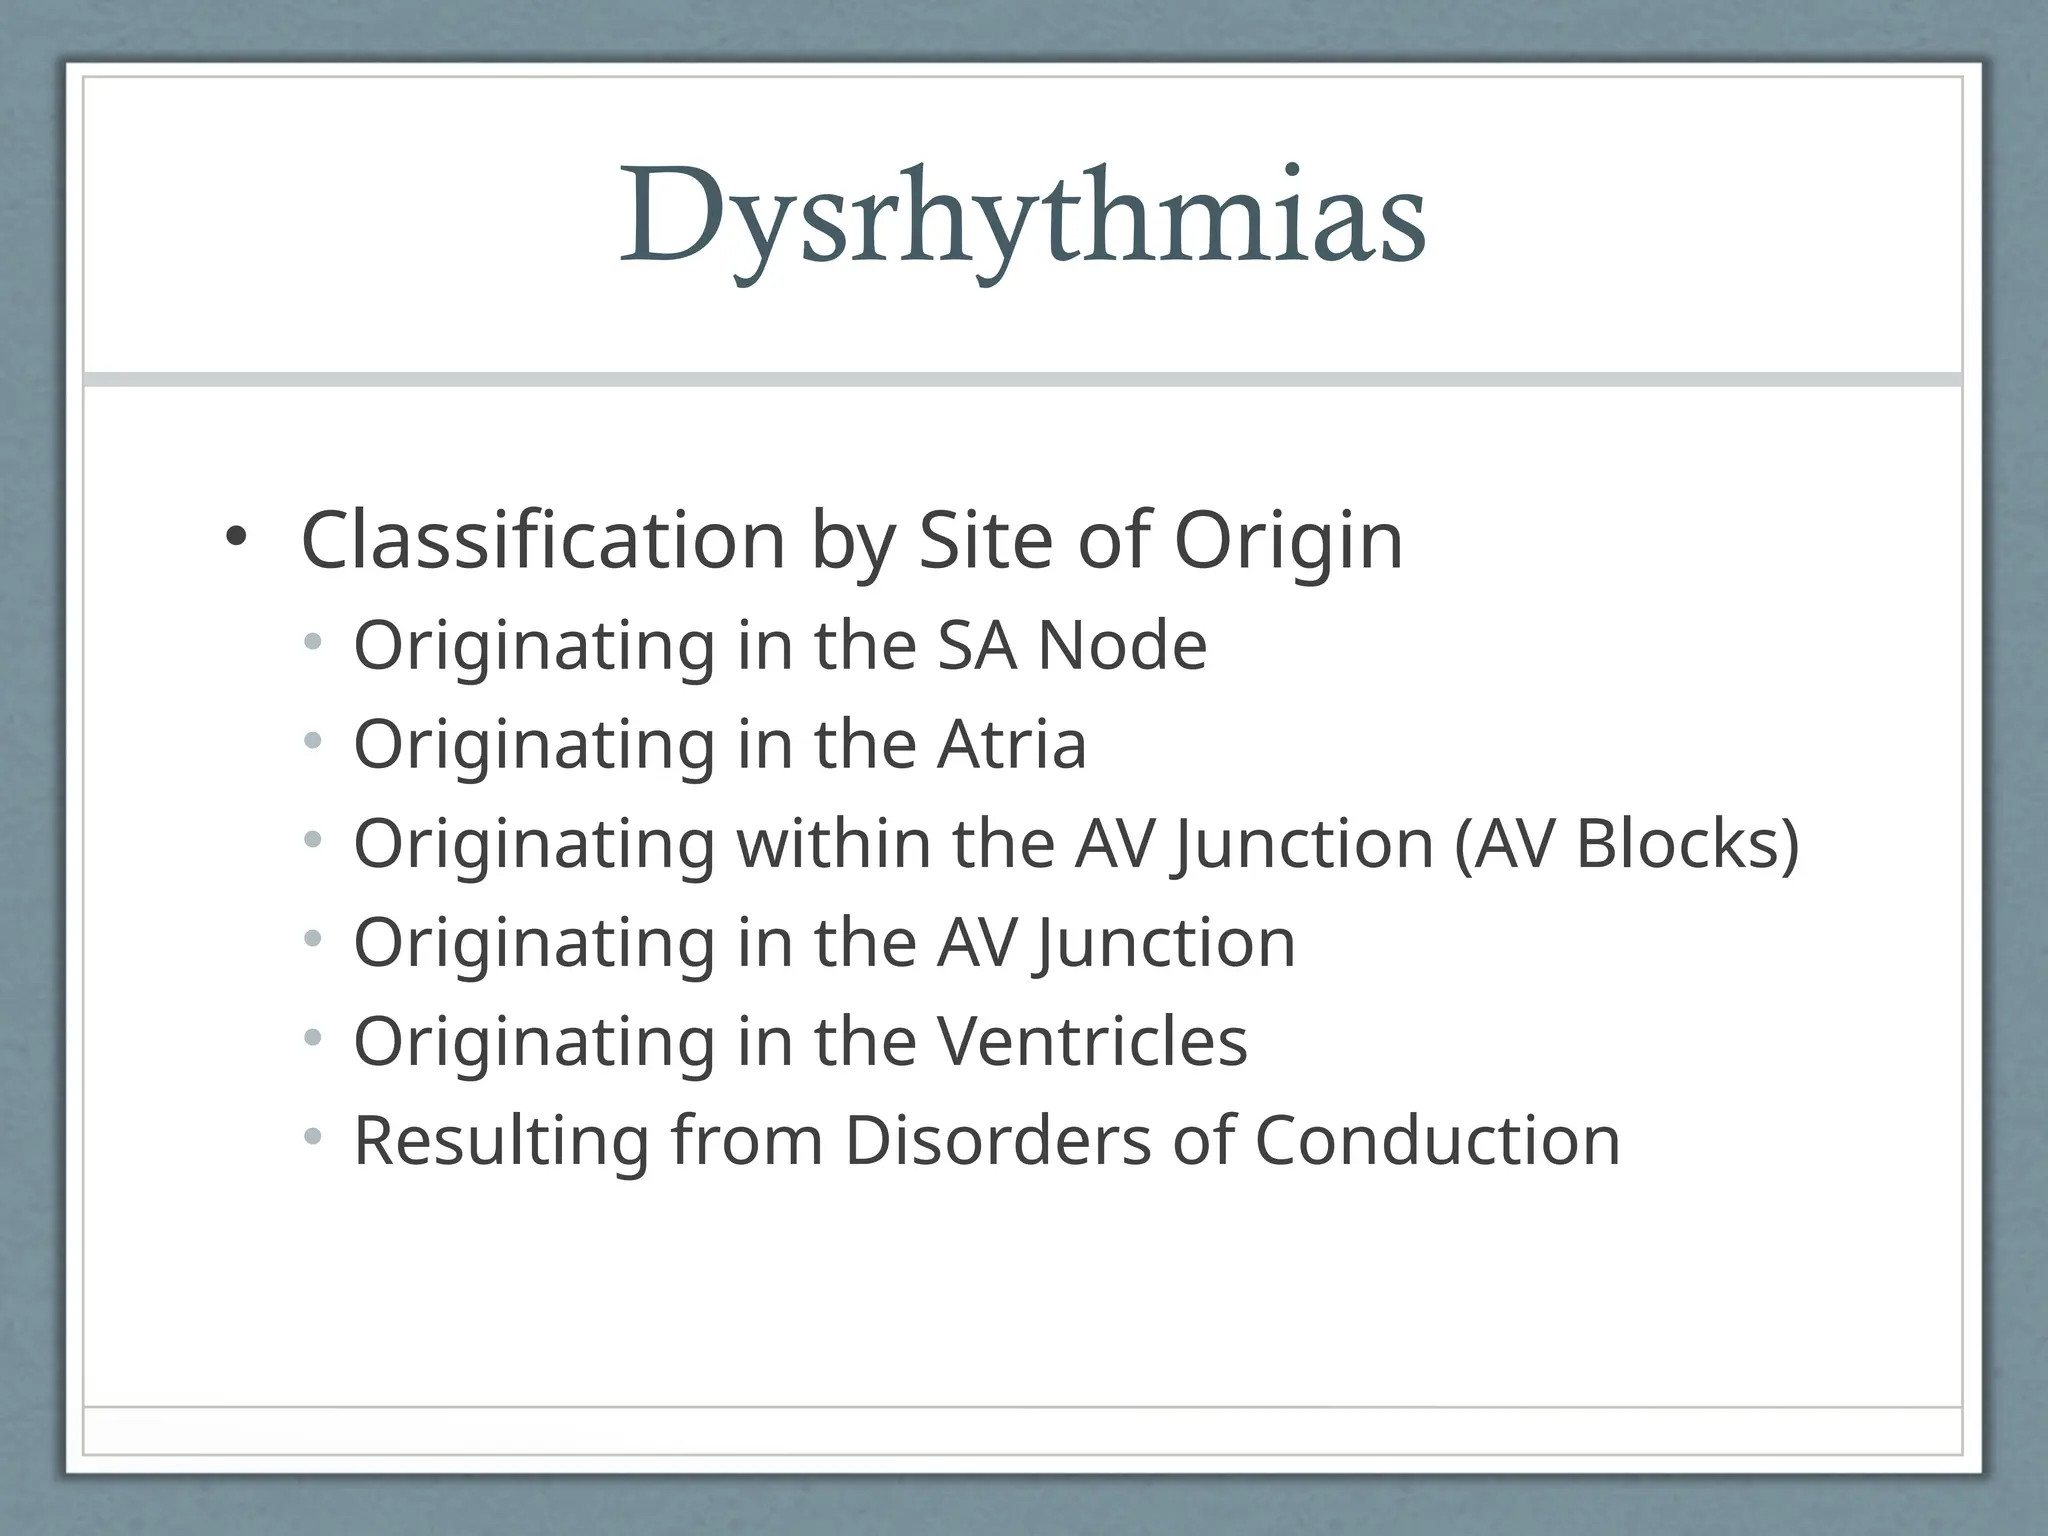
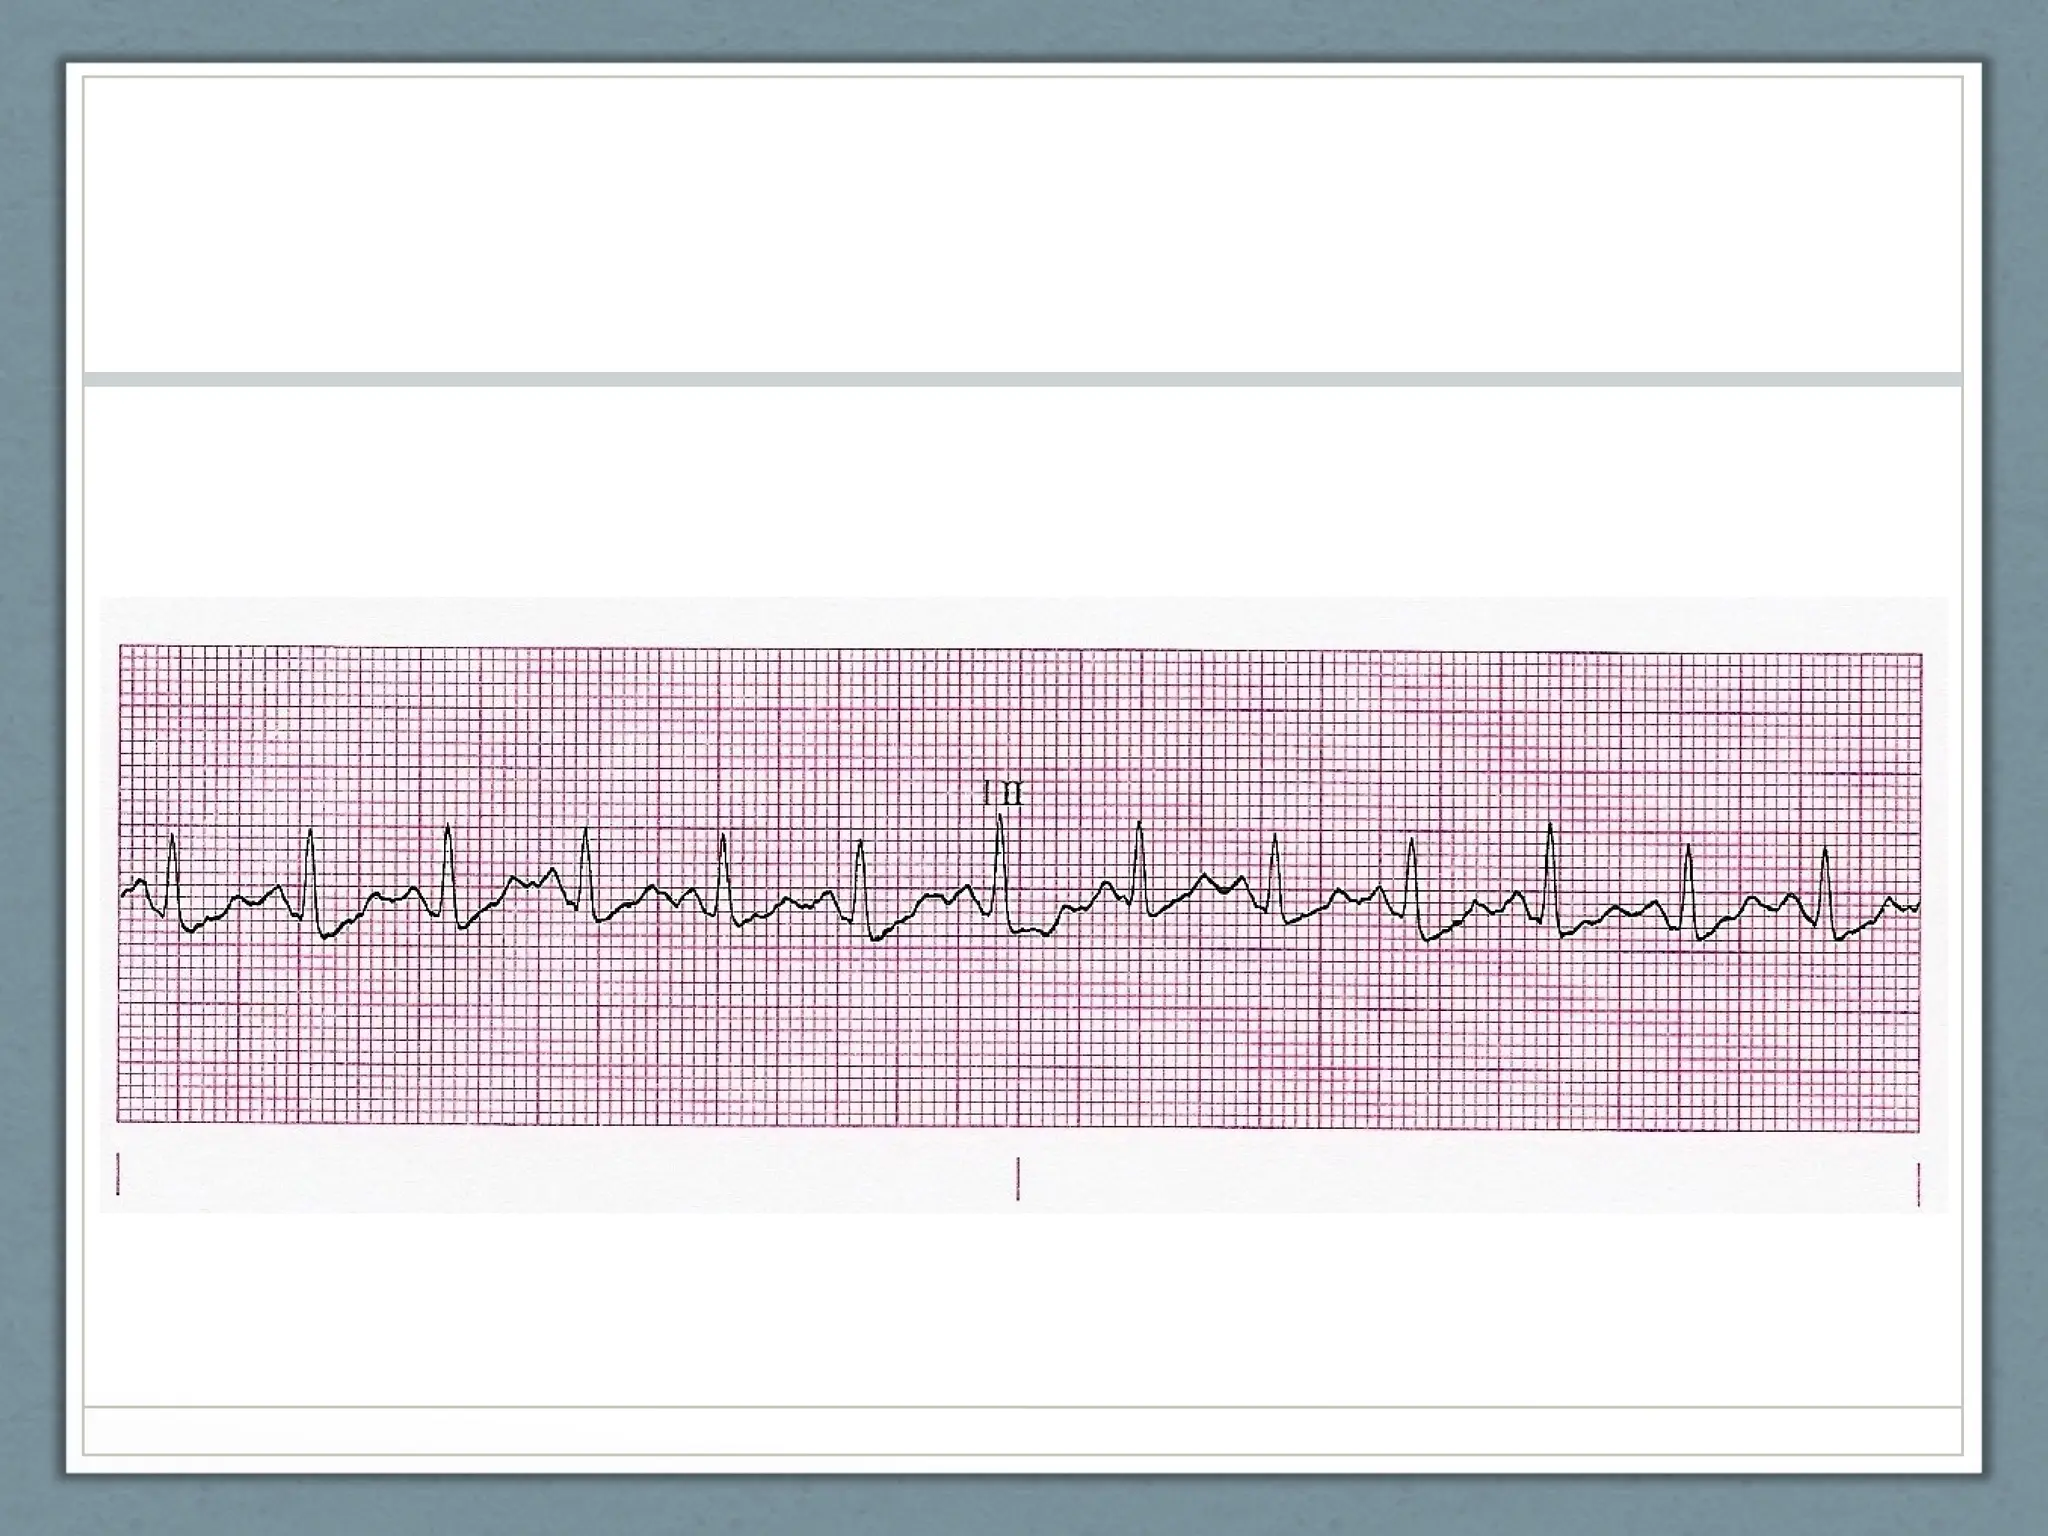
Dysrhythmias
• Classification bySite of Origin
• Originating in the SA Node
• Originating in the Atria
• Originating within the AV Junction (AV Blocks)
• Originating in the AV Junction
• Originating in the Ventricles
• Resulting from Disorders of Conduction
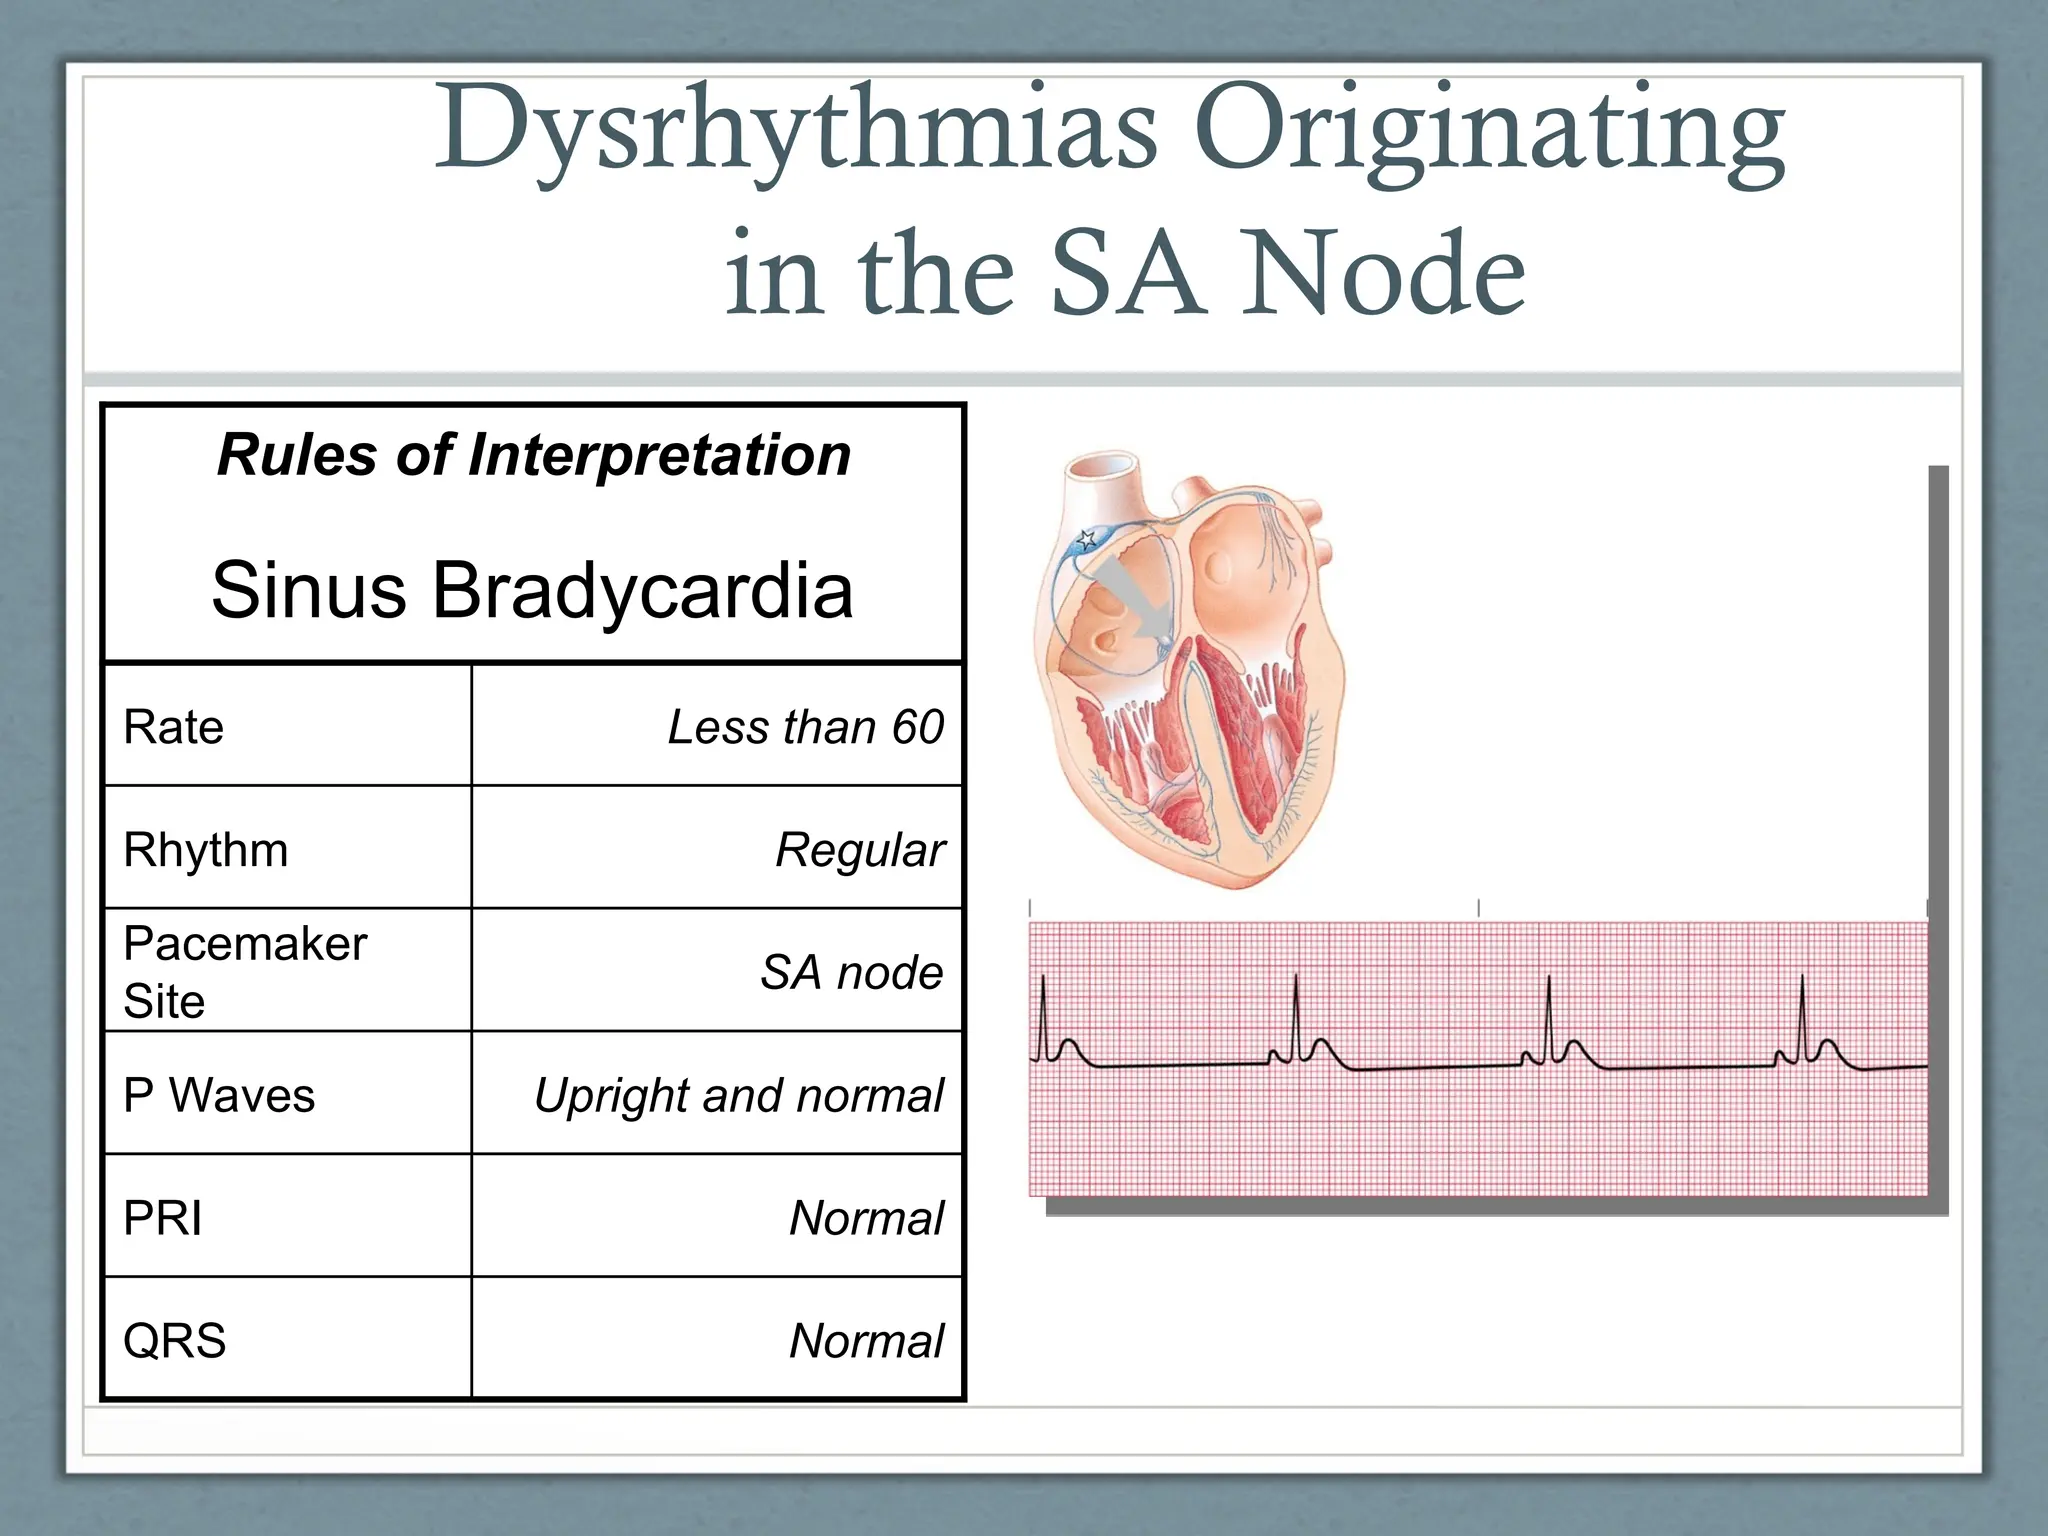
Dysrhythmias Originating
in theSA Node
Normal
QRS
Normal
PRI
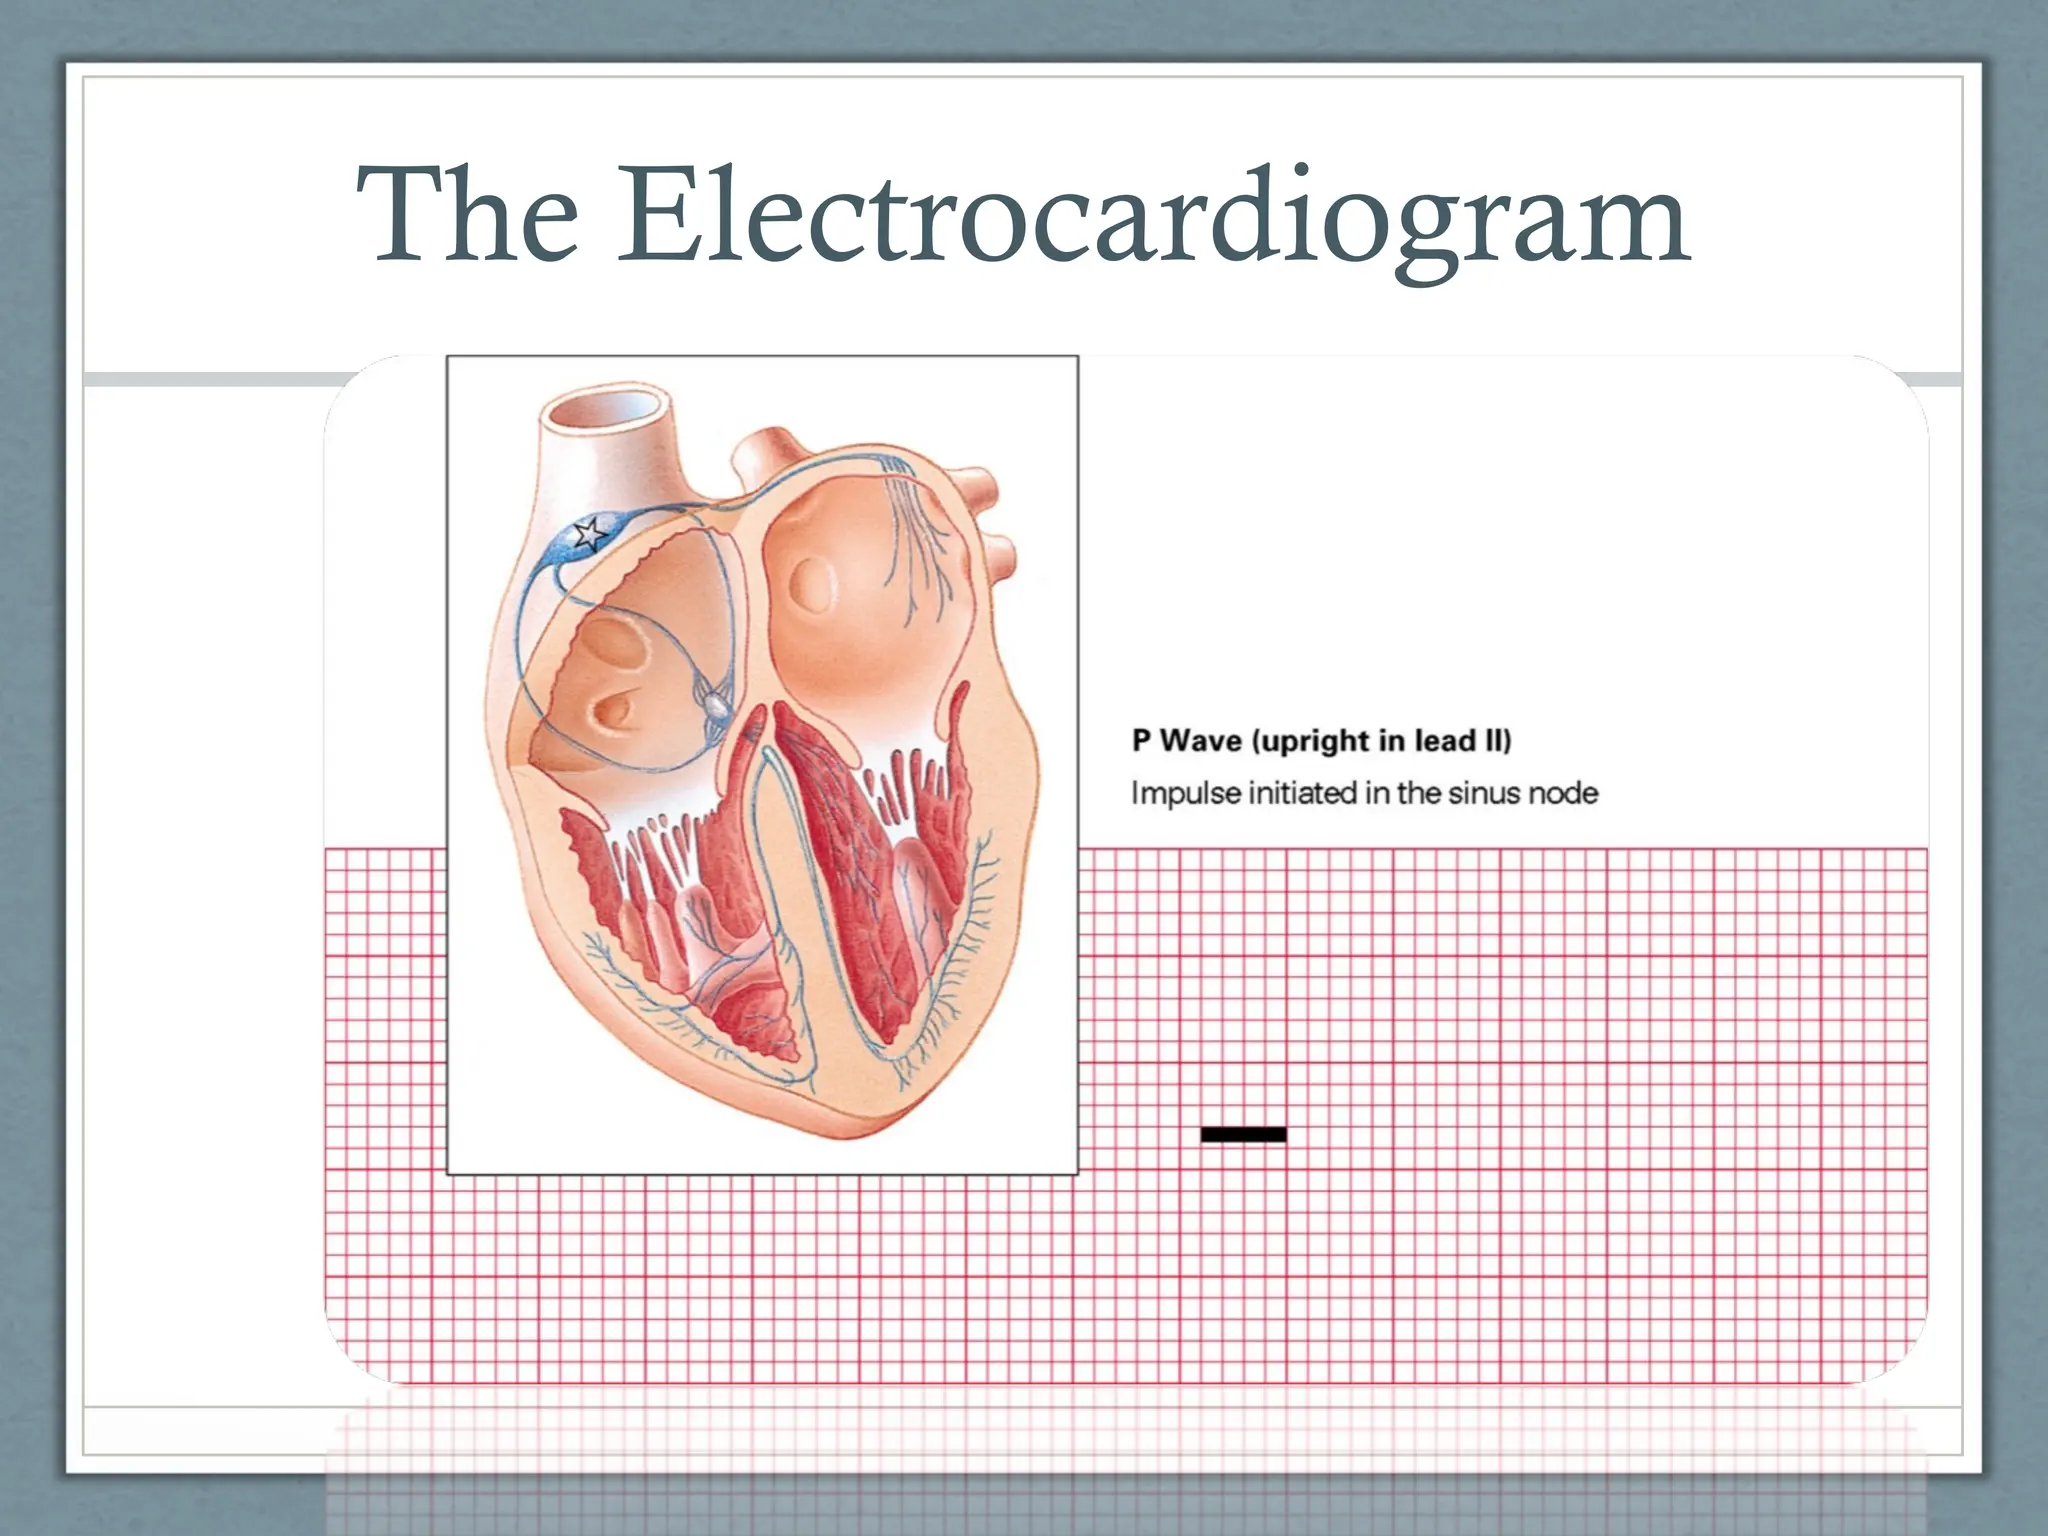
Upright and normal
P Waves
SA node
Pacemaker
Site
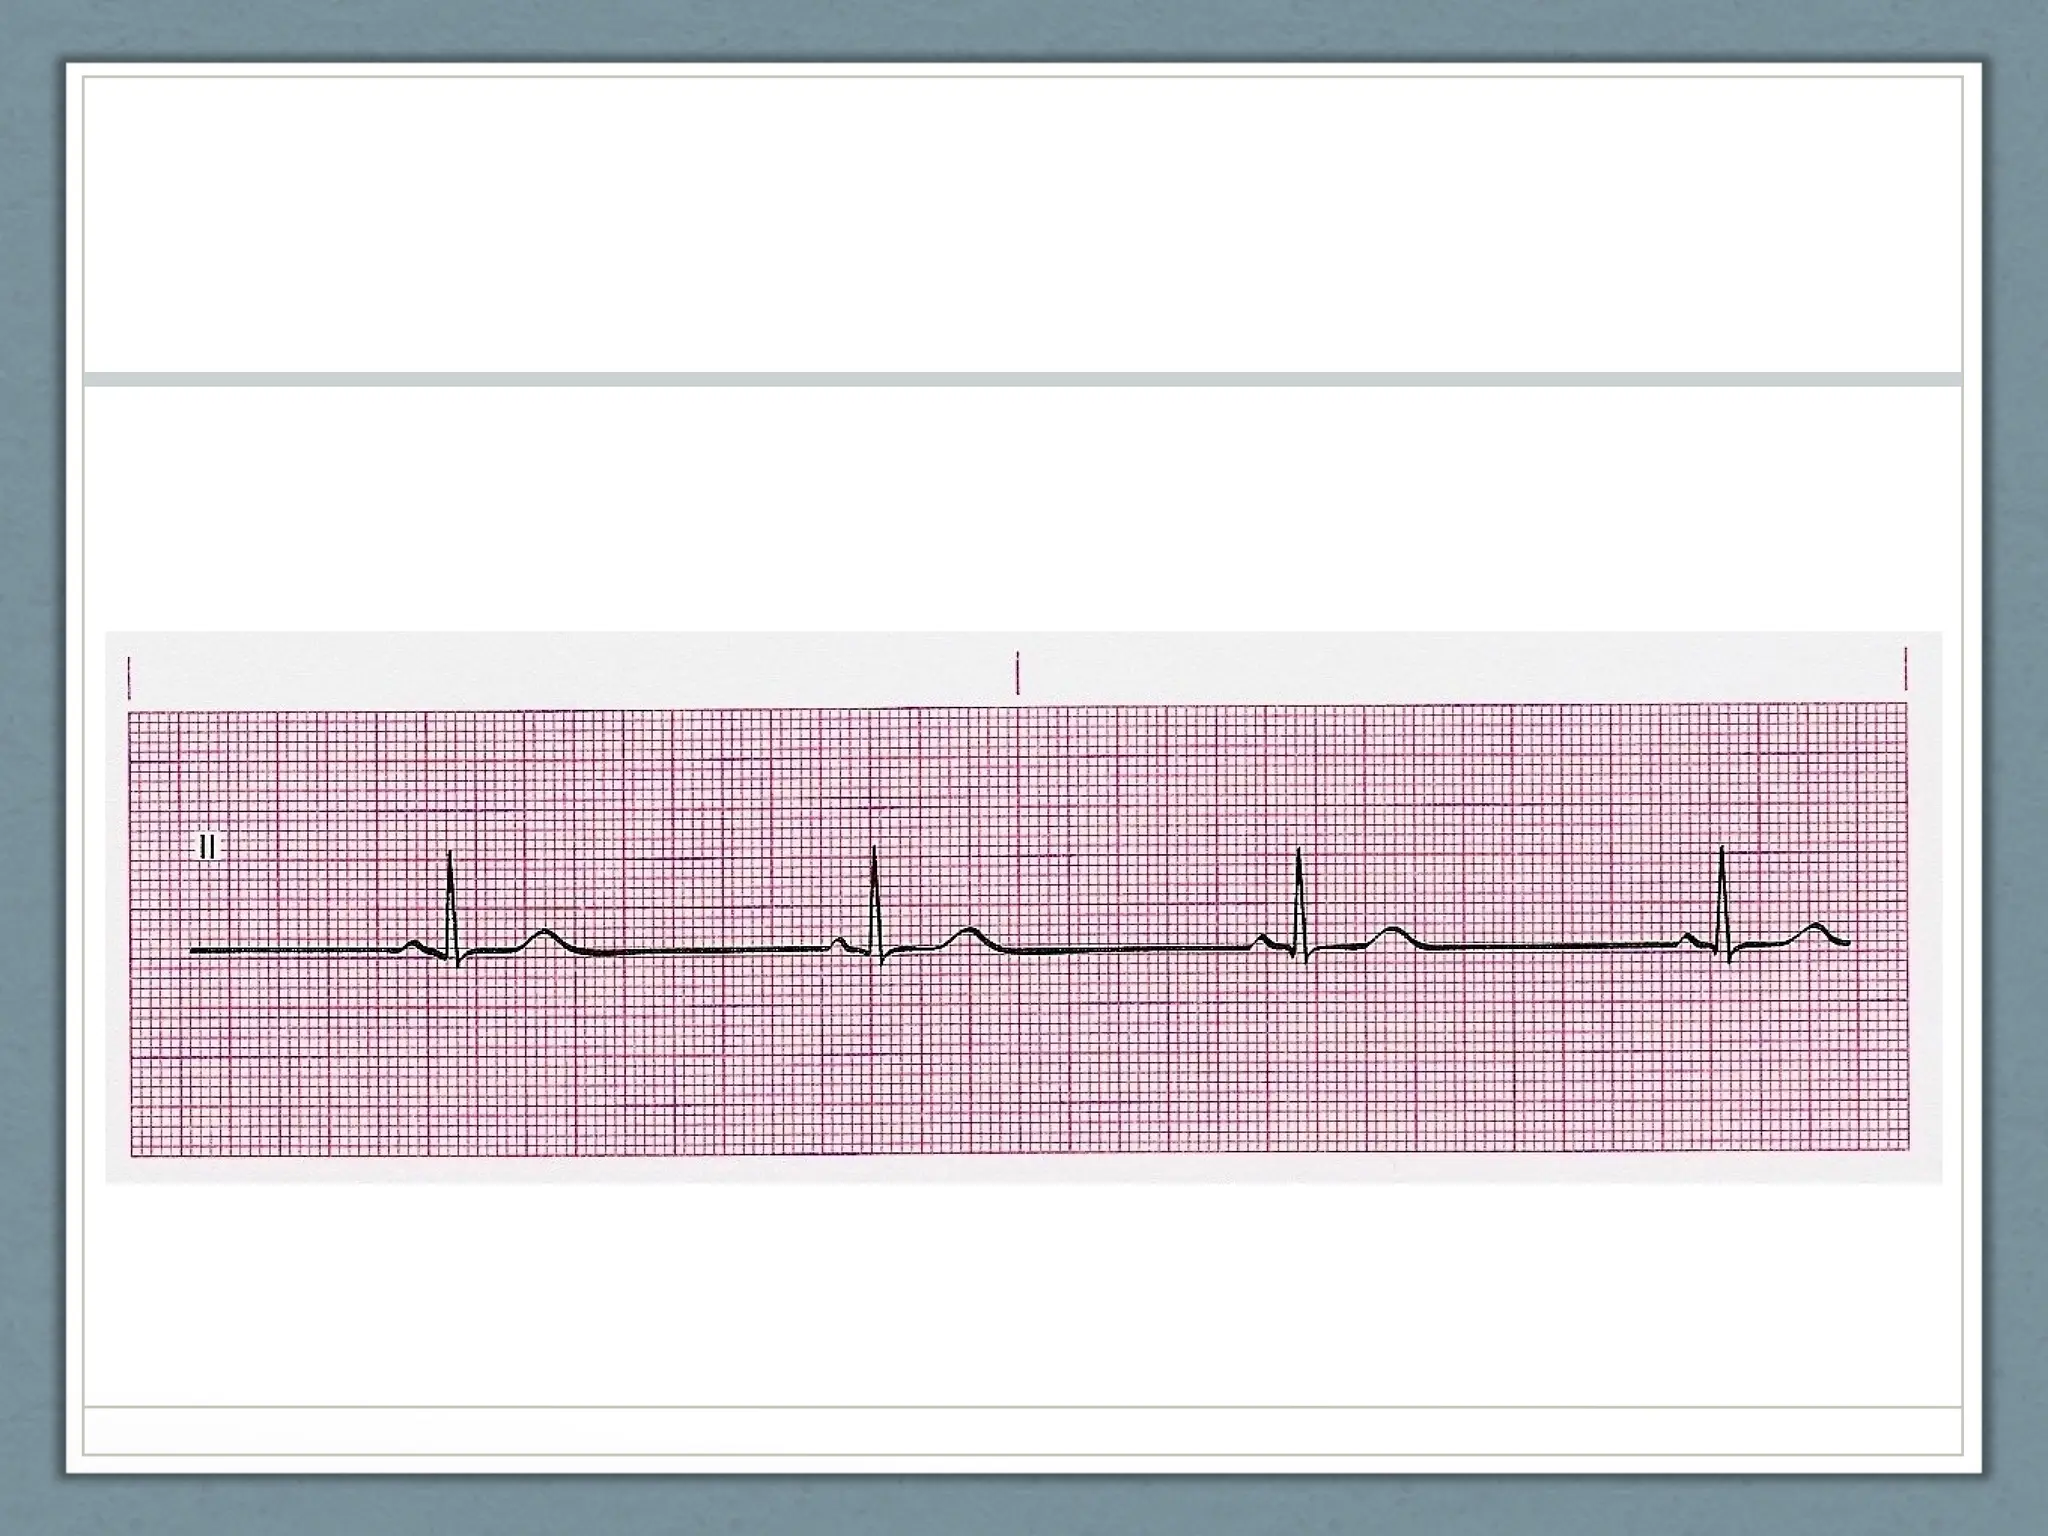
Regular
Rhythm
Less than 60
Rate
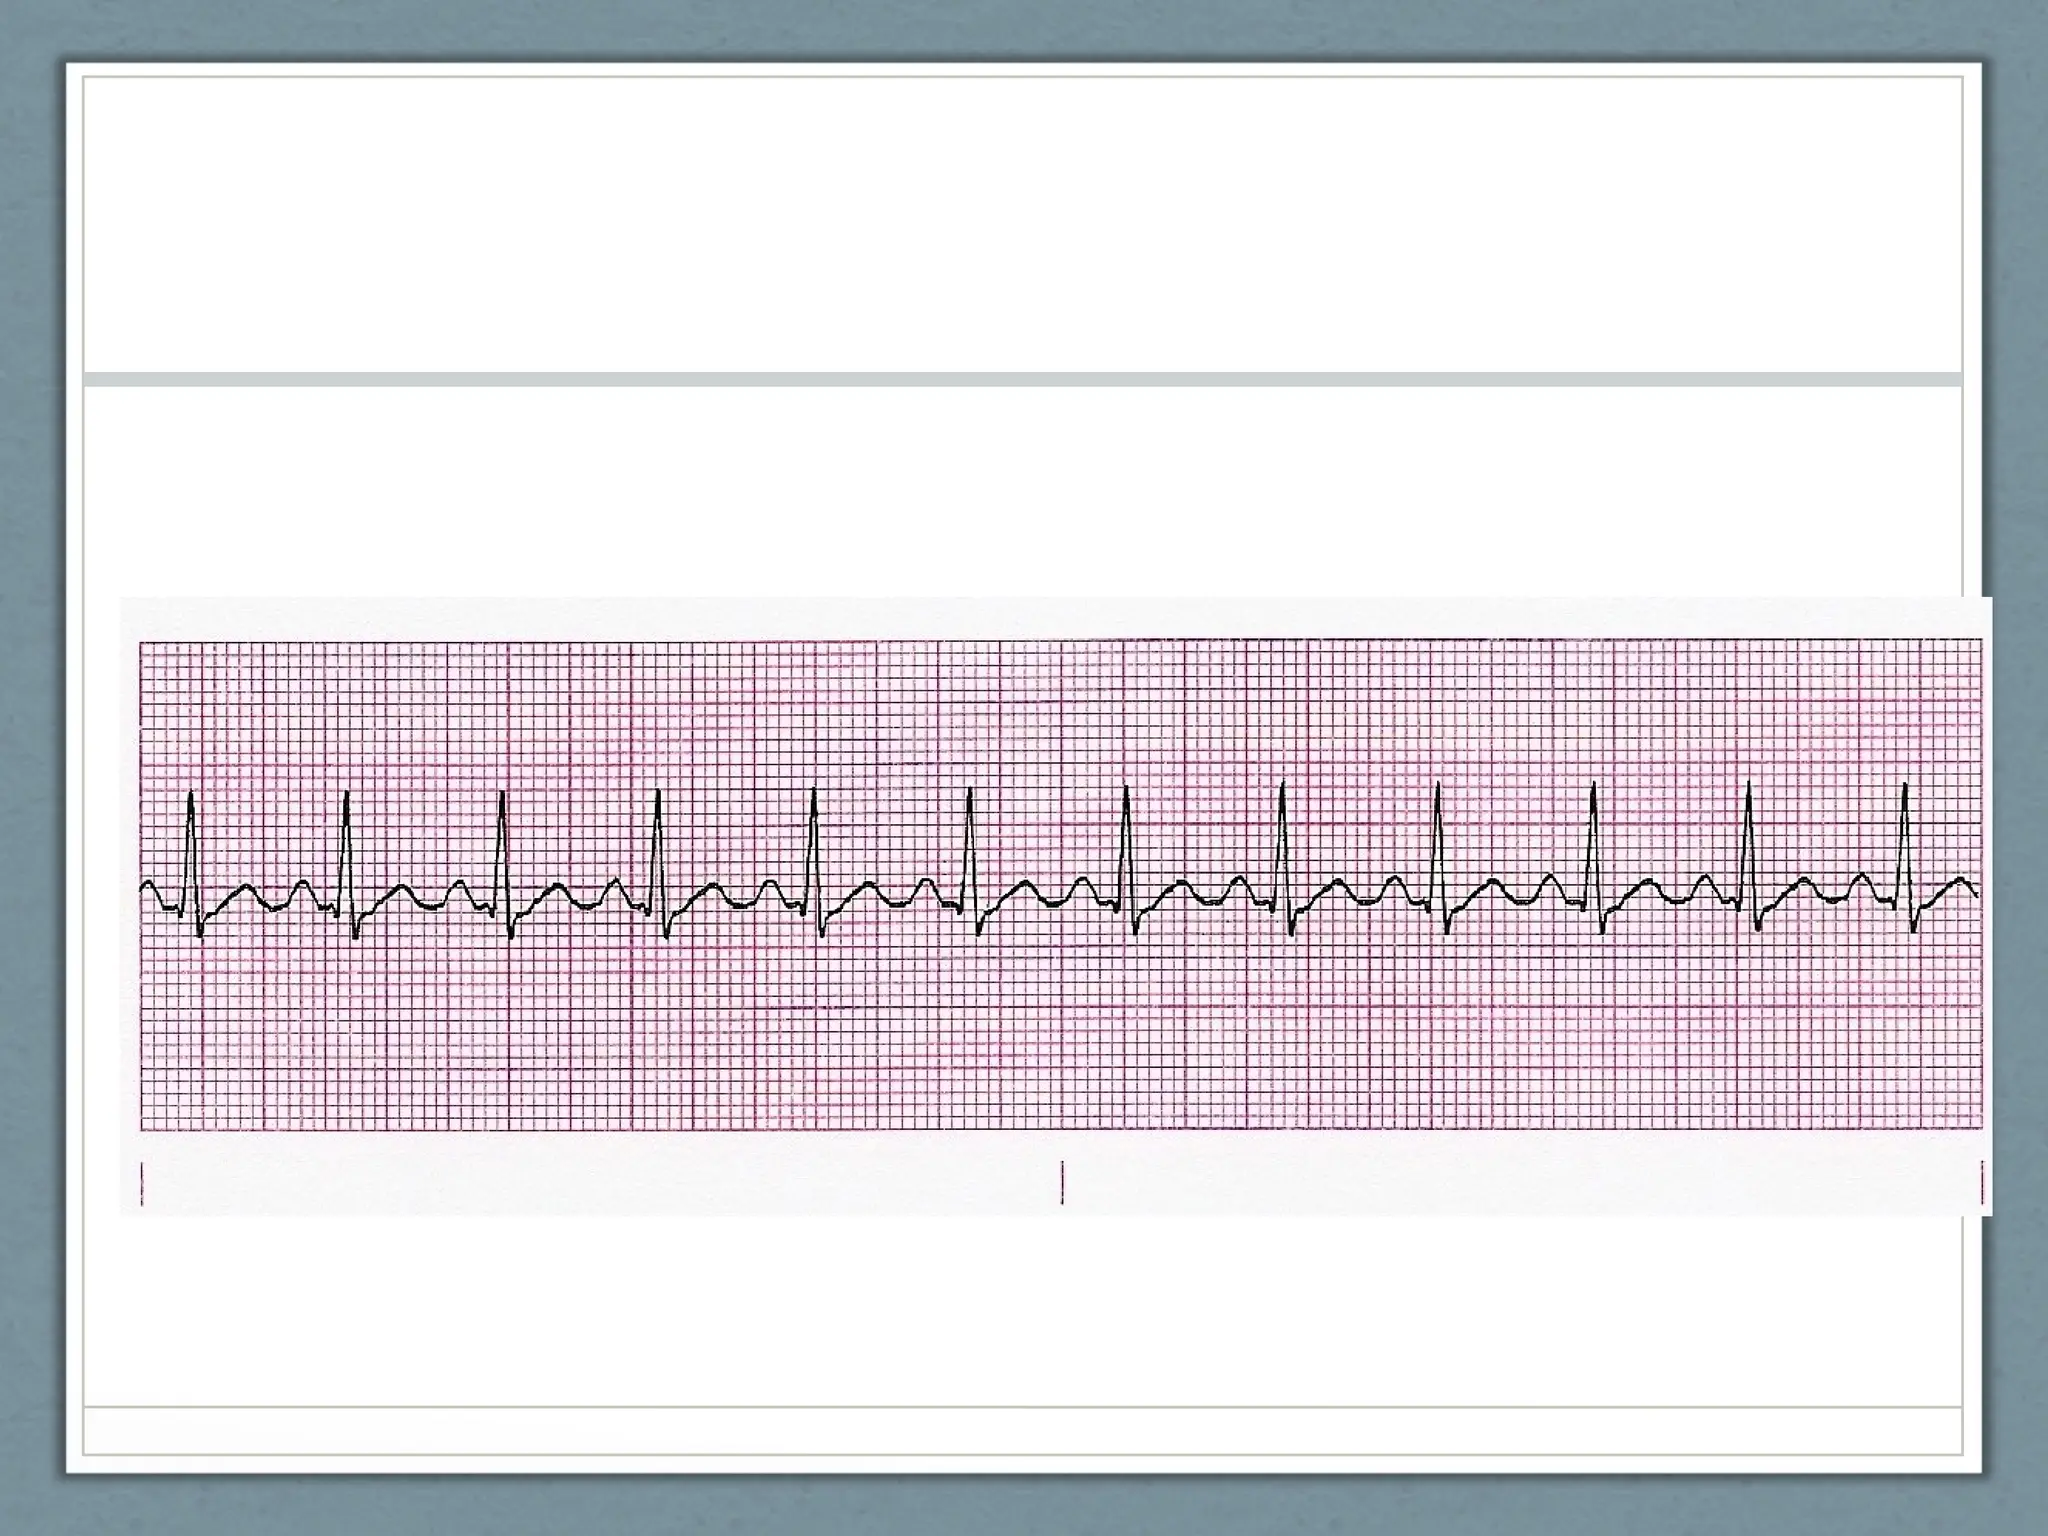
Sinus Bradycardia
Rules of Interpretation
49.
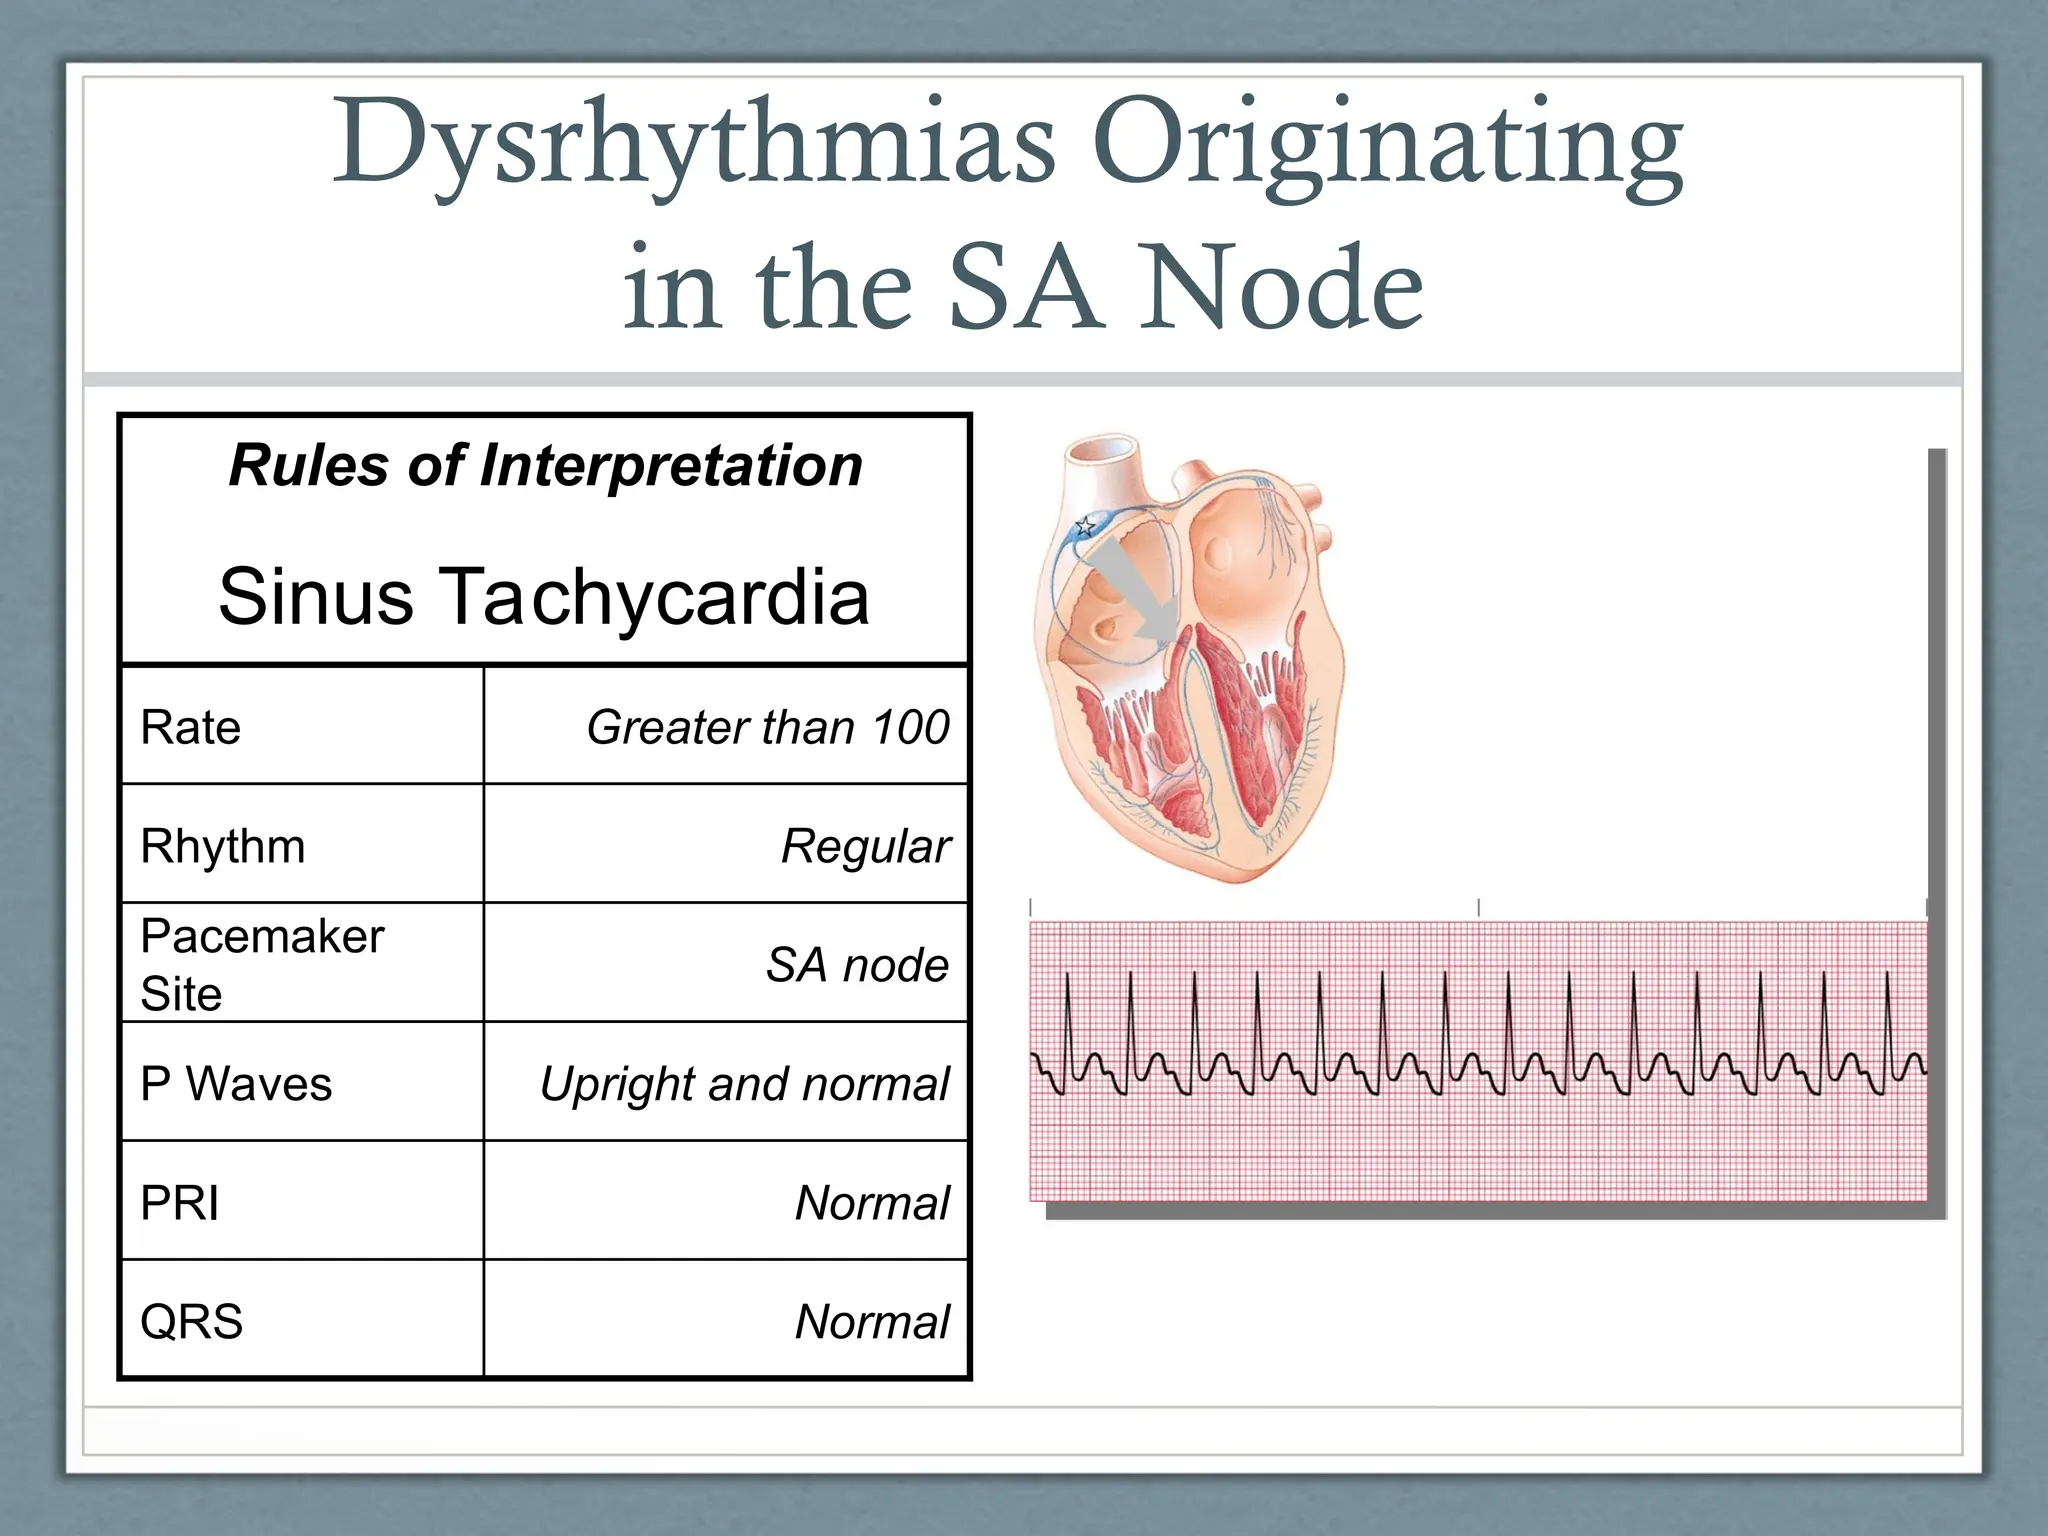
Normal
QRS
Normal
PRI
Upright and normal
PWaves
SA node
Pacemaker
Site
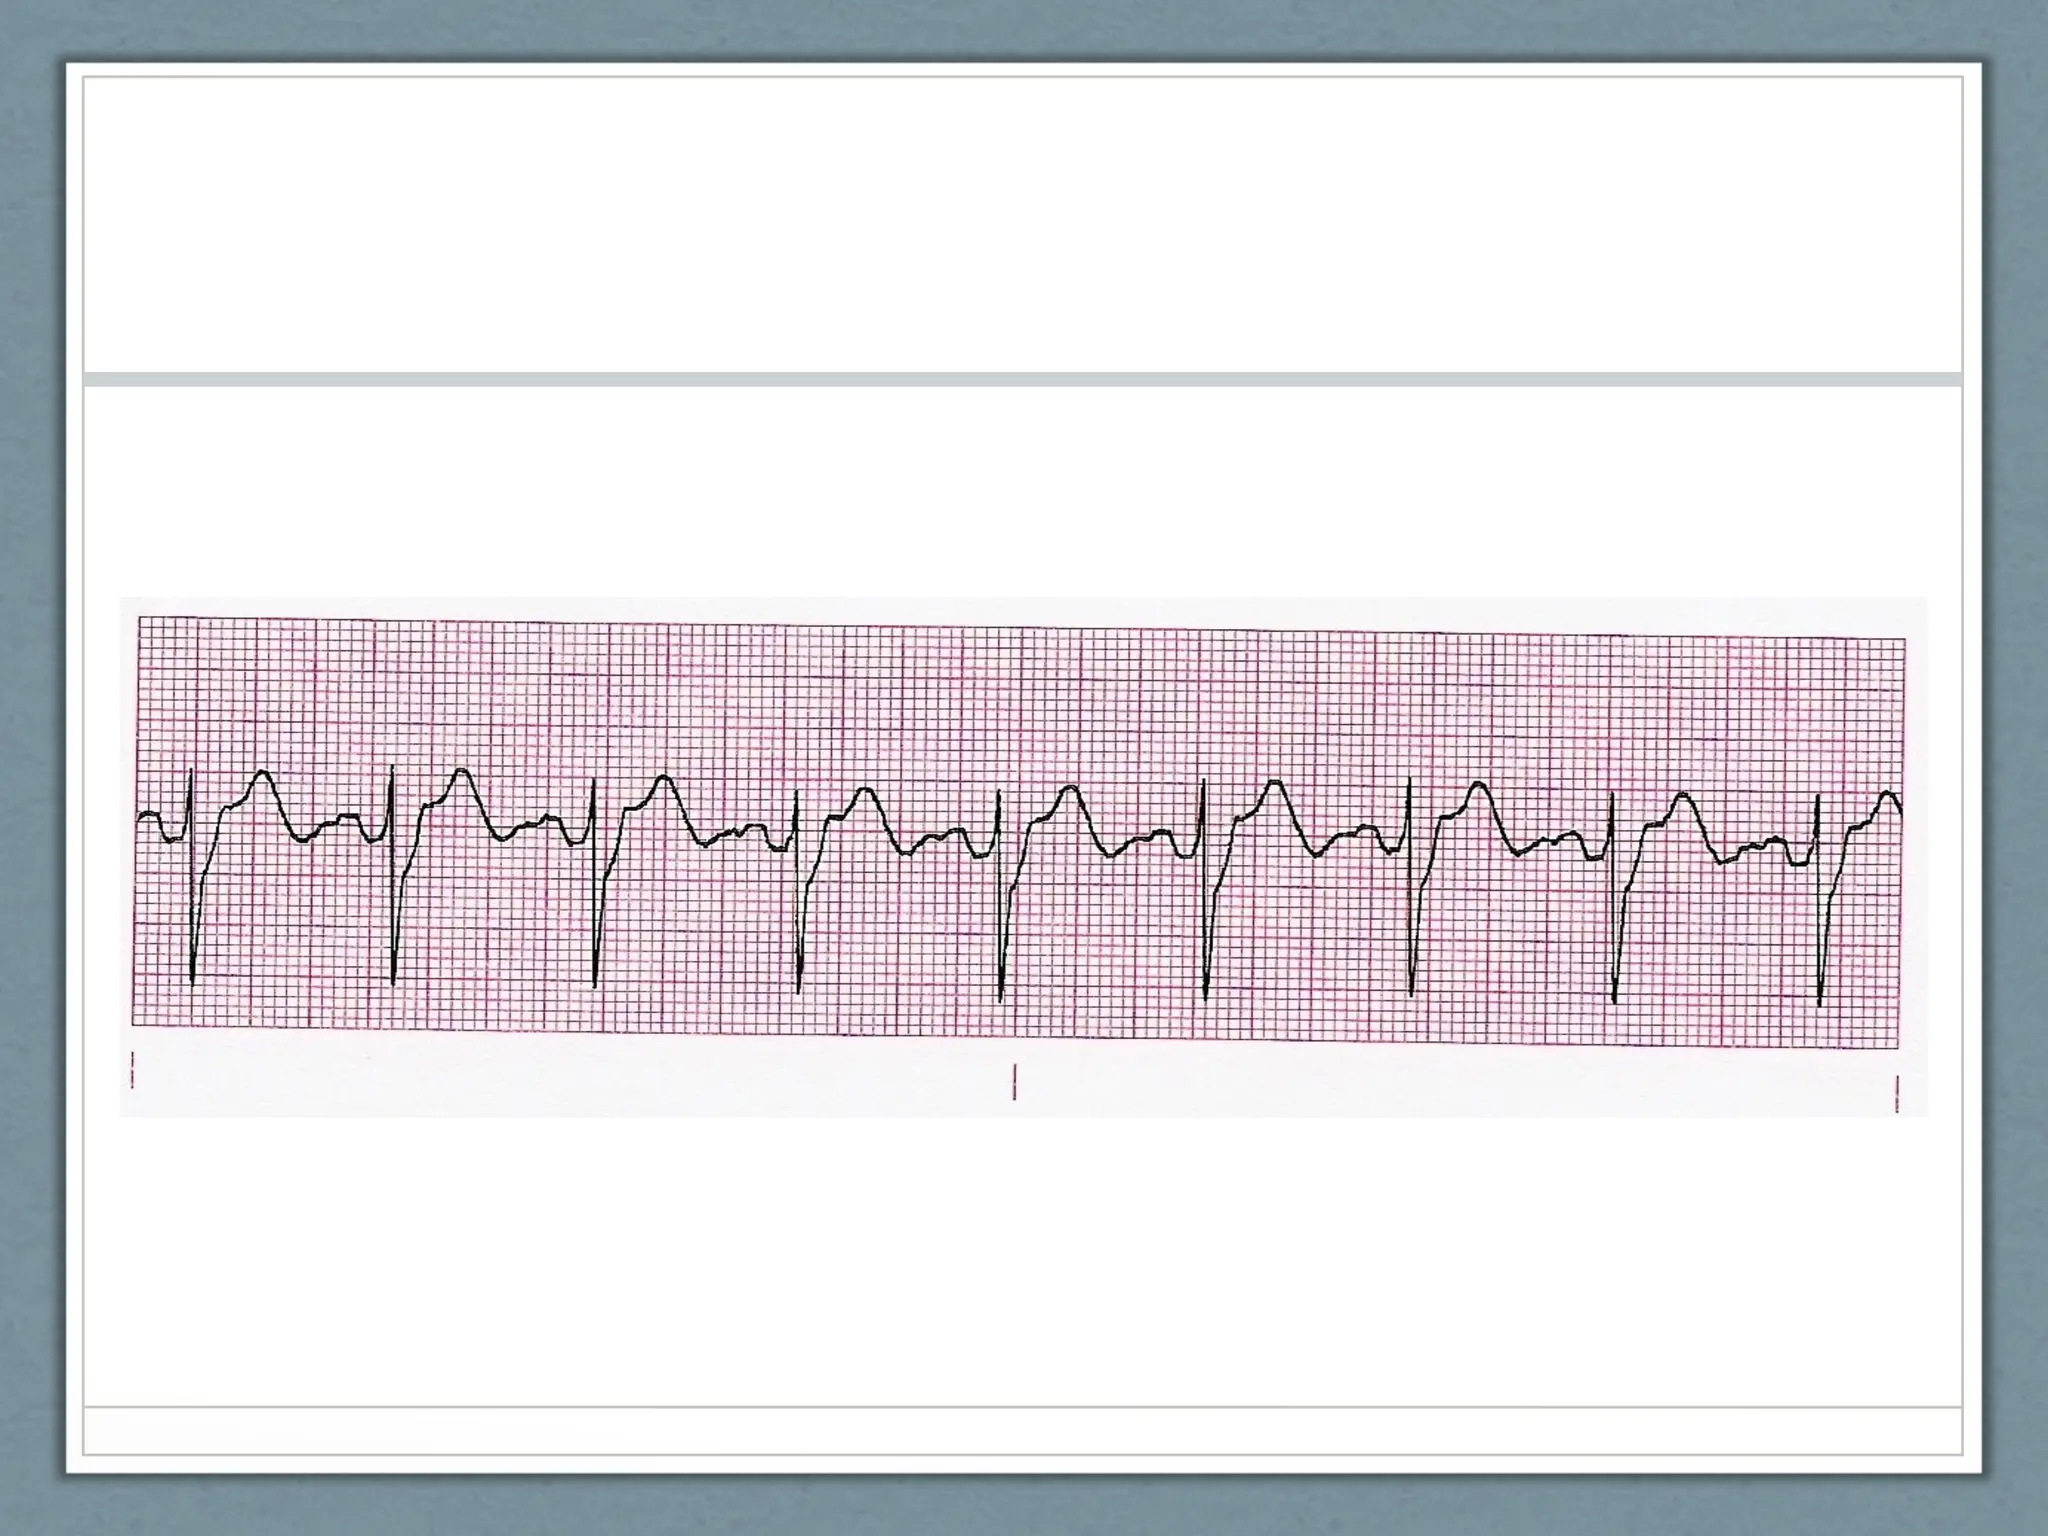
Regular
Rhythm
Greater than 100
Rate
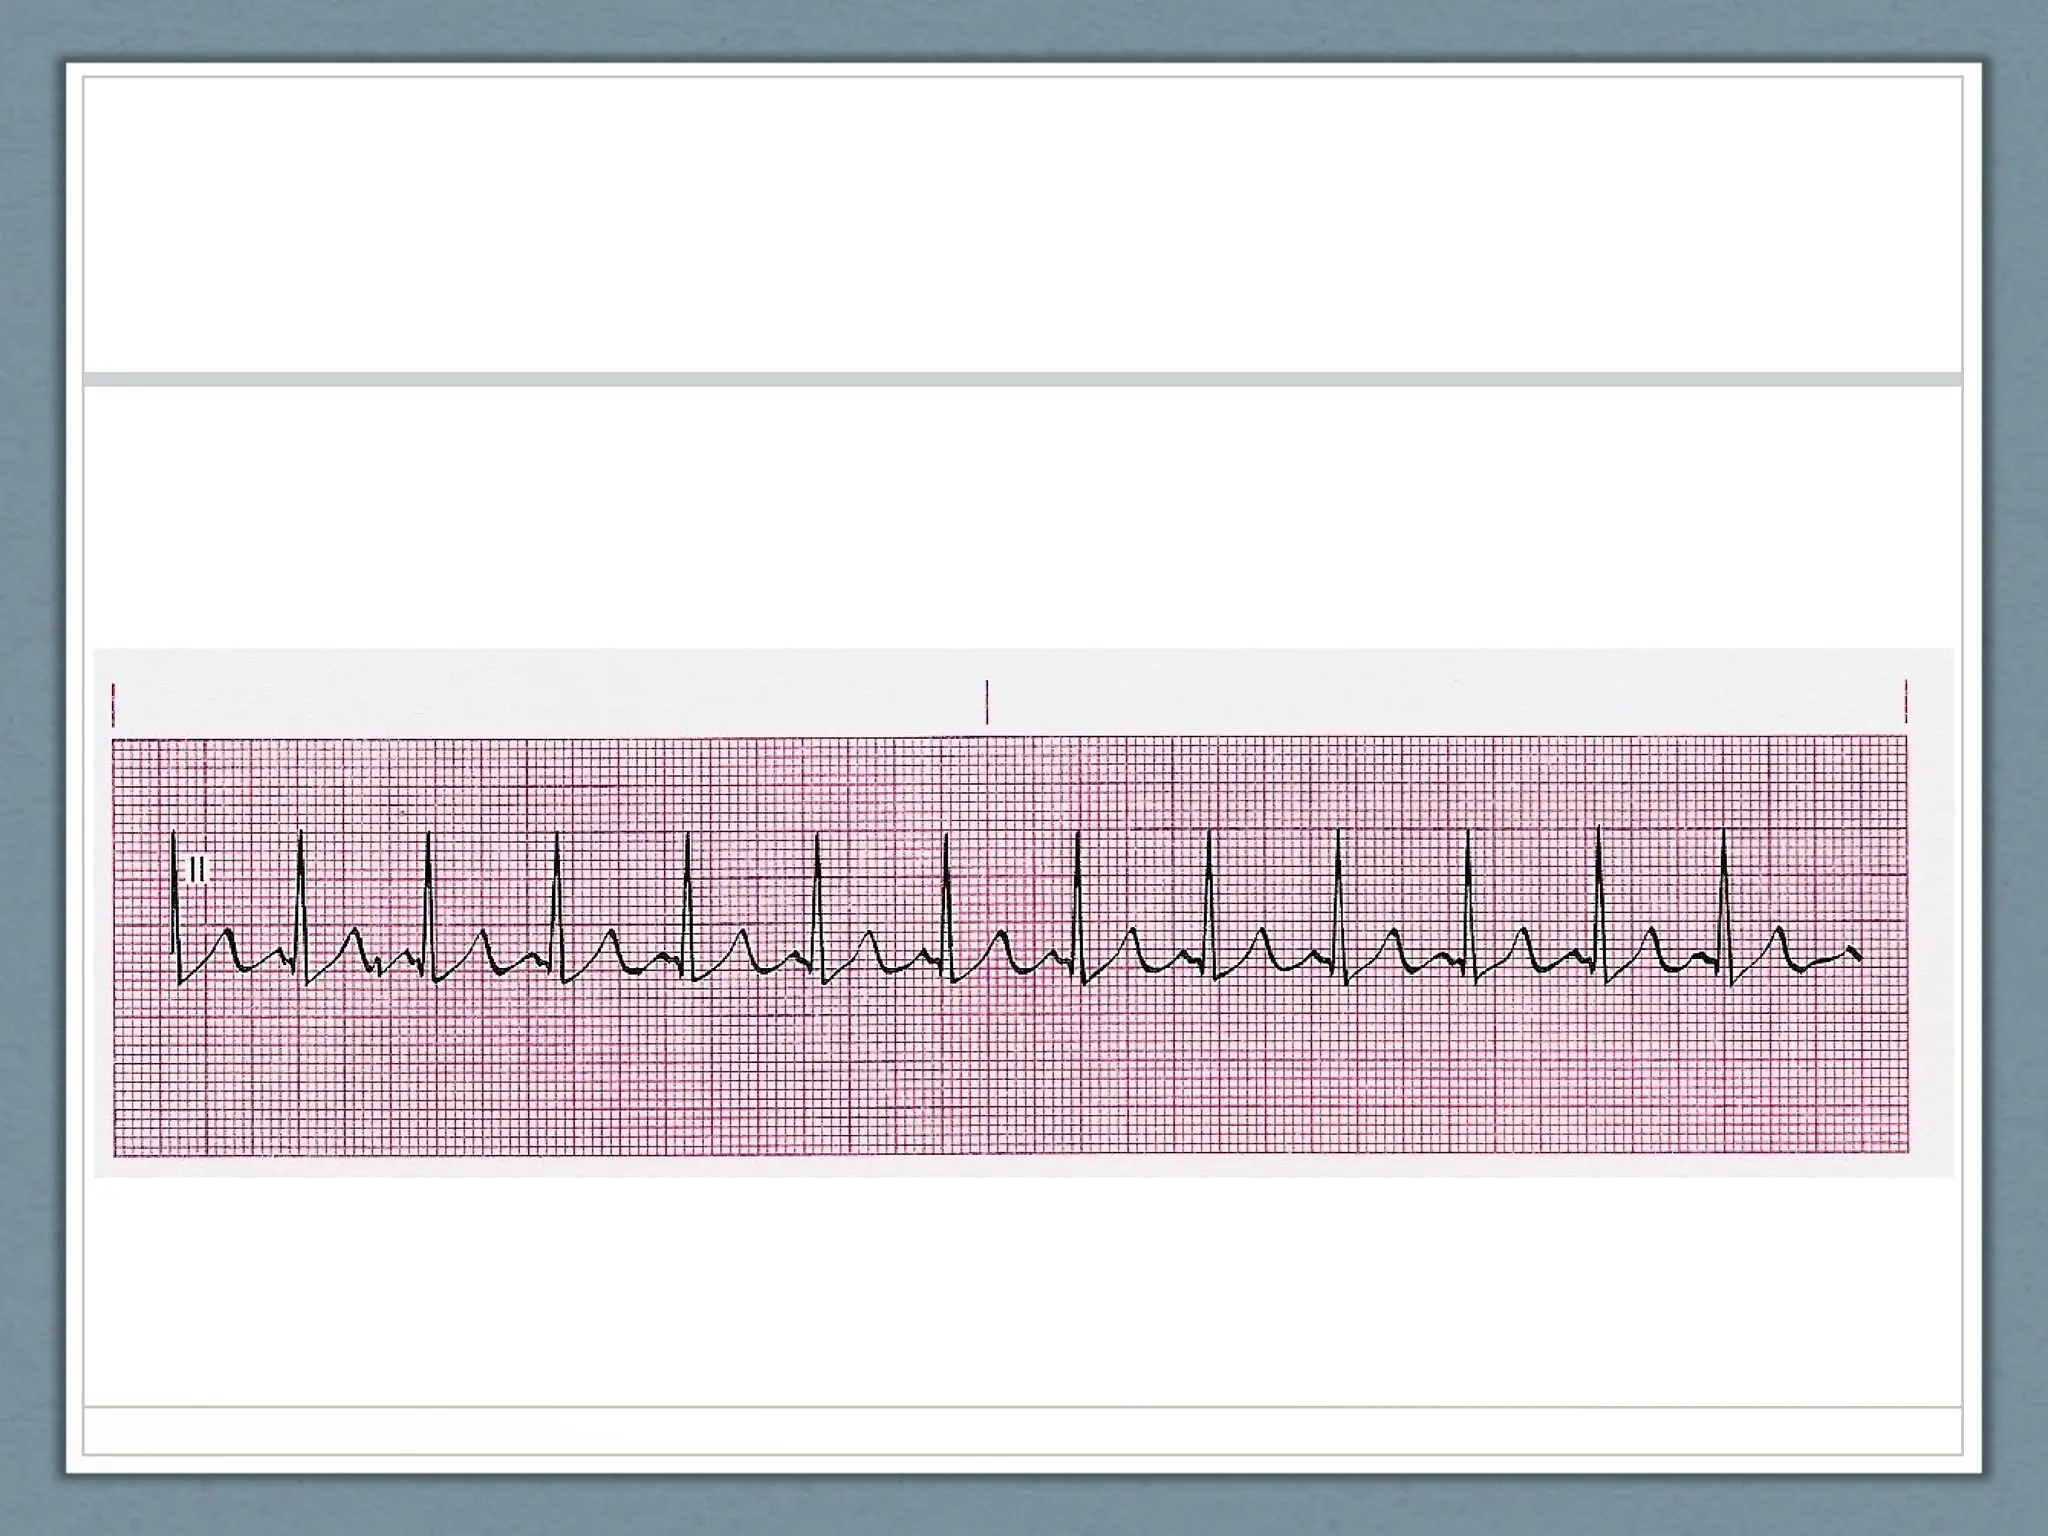
Sinus Tachycardia
Rules of Interpretation
Dysrhythmias Originating
in the SA Node


![ECG & Heart block [doctors online]](https://cdn.slidesharecdn.com/ss_thumbnails/ecgheartblockdoctorsonline-131111054313-phpapp01-thumbnail.jpg?width=640&height=640&fit=bounds)


![Understanding Parkinson’s Disease: Causes, Symptoms, and Treatment [2025]](https://cdn.slidesharecdn.com/ss_thumbnails/understandingparkinson-251208102525-80ba3223-thumbnail.jpg?width=640&height=640&fit=bounds)


