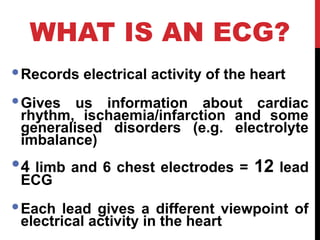
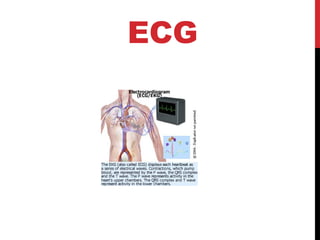
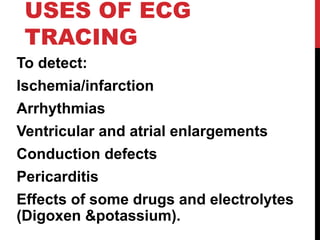
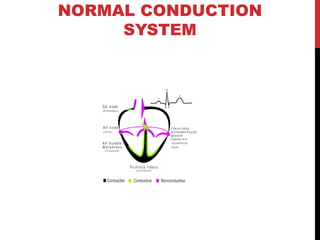
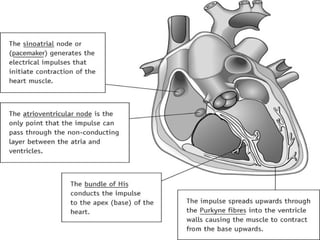
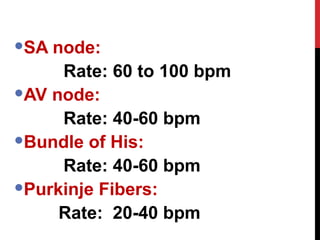
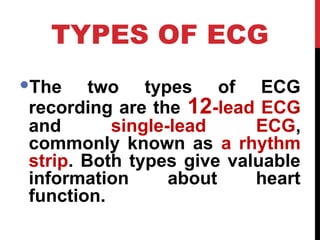
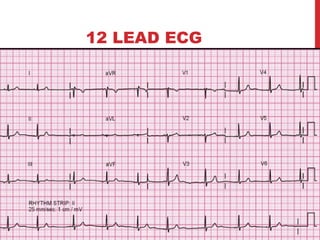
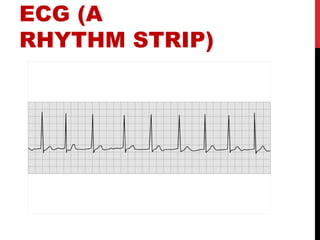
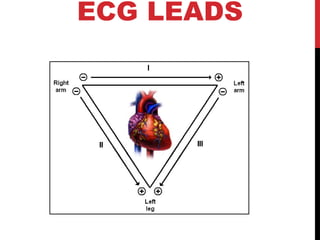
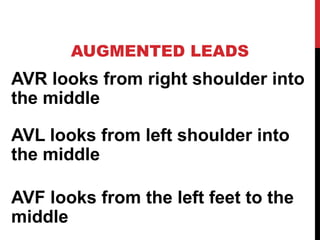
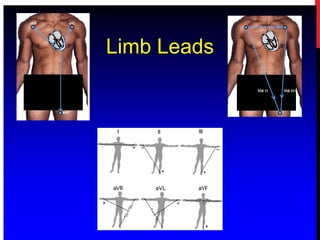
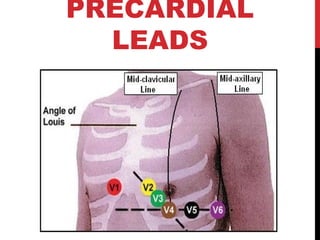
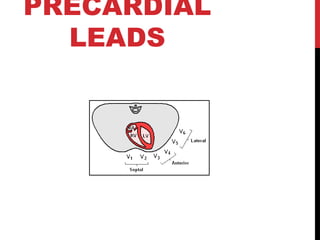
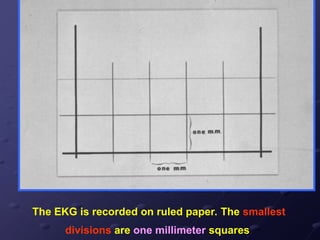
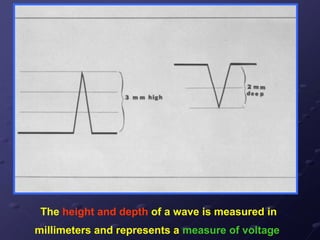
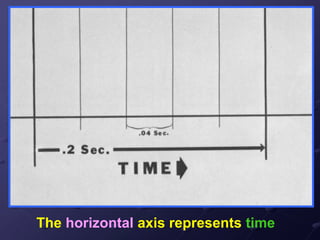
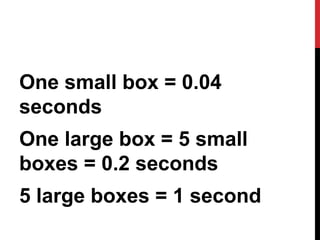
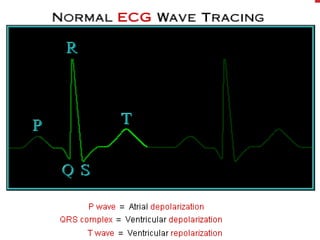
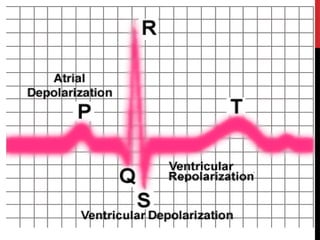
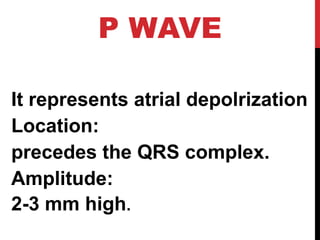
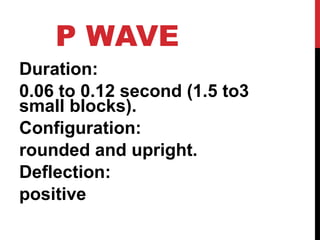
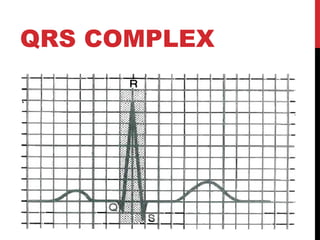
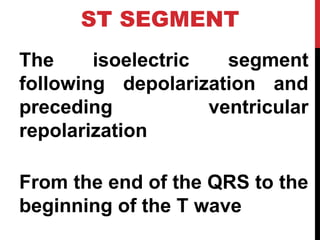
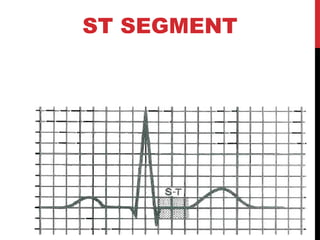
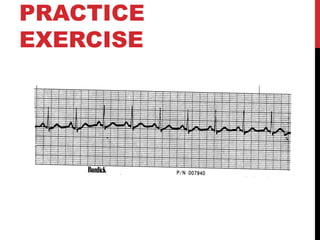
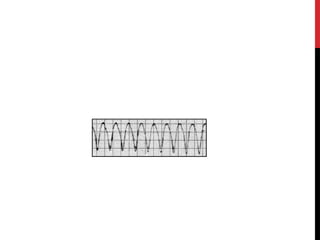
NORMAL
ECG
Prepared by
Mahmoud Taha Abd El-kafy
Under supervision of
Prof.dr/Warda Youssif
Dr/ Youssria Abd Elsalam
OBJECTIVES
Discuss the composition of the
cardiac cycle &cardiac properties
Describe how impulse conduction
works in the heart
Identify how leads and planes
function.
OBJECTIVES (CONT.)
Identify types of ECG
monitoring.
Describe the components of an
electrocardiogram complex
along with their significance.
Identify how to calculate the rate
and rhythm of an ECG recording.
OUTLINES:
Cardiac cycle &cardiac properties.
Intrinsic conduction system.
Types of ECG.
ECG Leads.
ECG paper.
Characteristics of normal ECG tracing.
Heart Rate Calculation.
Normal axis of the heart
CARDIAC CYCLE
The cardiac cycle is composed of both
the electrical activity due to
automaticity and the mechanical
(muscular) response known as
contraction.
Generation and transmission of
electrical impulses depend on
automaticity, excitability, conductivity,
and contractility of cardiac cells.
ELECTROPHYSIOLOGIC
PROPERTIES OF THE
HEART
Automaticity:
can generate an electric
impulse on its own
Excitability:
Non-pacemaker cells can
respond to impulse and
depolarize
ELECTROPHYSIOLOGIC
PROPERTIES OF THE
HEART (CONT.)
Conductivity:
Can transmit impulse from cell
membrane to cell membrane
Contractility:
Cardiac muscle cells can shorten fiber
length in response to electrical
stimulation, creating sufficient pressure
to propel blood forward (Mechanical
activity)
CARDIAC
CYCLE(CONT.)
The electrical activity can be divided
into two phases called depolarization
and repolarization. The mechanical
response is divided into diastole and
systole.
Depolarization is the active phase of
electrical activity. Repolarization is the
resting phase during which electrical
activity is minimal.
•Phase of the cardiac cycle
when the myocardium contracts
is termed systole.
Phase of the cardiac cycle when
myocardium is relaxed is
termed diastole.
WHAT IS AN ECG?
Records electrical activity of the heart
Gives us information about cardiac
rhythm, ischaemia/infarction and some
generalised disorders (e.g. electrolyte
imbalance)
4 limb and 6 chest electrodes = 12 lead
ECG
Each lead gives a different viewpoint of
electrical activity in the heart
ECG
USES OF ECG
TRACING
To detect:
Ischemia/infarction
Arrhythmias
Ventricular and atrial enlargements
Conduction defects
Pericarditis
Effects of some drugs and electrolytes
(Digoxen &potassium).
NORMAL CONDUCTION
SYSTEM
SA node:
Rate: 60 to 100 bpm
AV node:
Rate: 40-60 bpm
Bundle of His:
Rate: 40-60 bpm
Purkinje Fibers:
Rate: 20-40 bpm
TYPES OF ECG
The two types of ECG
recording are the 12-lead ECG
and single-lead ECG,
commonly known as a rhythm
strip. Both types give valuable
information about heart
function.
12 LEAD ECG
ECG (A
RHYTHM STRIP)
ECG LEADS
Standard Limb Leads
AUGMENTED LEADS
AVR looks from right shoulder into
the middle
AVL looks from left shoulder into
the middle
AVF looks from the left feet to the
middle
Red
Yellow
Green
Black
Right Arm
Left Arm
Left Leg
Right Leg
Limb Leads
PRECARDIAL
LEADS
PRECARDIAL
LEADS
View from Chest and Limb
Leads
LEAD PLACEMENTS
V1 - 4th ICS, Right sternal border
V2 - 4th ICS, Left sternal border
V3 - Midway between V2 and V4
V4 - 5th ICS, Mid clavicle
V5 - Anterior aspect of axilla, same line as V4
V6 - Mid axilla, same line a V4
4 limb leads.
ECG PAPER
ECG PAPER
The EKG is recorded on ruled paper. The smallest
divisions are one millimeter squares
The height and depth of a wave is measured in
millimeters and represents a measure of voltage
The horizontal axis represents time
One small box = 0.04
seconds
One large box = 5 small
boxes = 0.2 seconds
5 large boxes = 1 second
P WAVE
It represents atrial depolrization
Location:
precedes the QRS complex.
Amplitude:
2-3 mm high.
P WAVE
Duration:
0.06 to 0.12 second (1.5 to3
small blocks).
Configuration:
rounded and upright.
Deflection:
positive
P WAVE
PR INTERVAL
 Start of P wave to start of QRS
 Normal = 0.12-0.2s (3-5 small squares)
QRS COMPLEX
Represents ventricular
depolarization.
Measured from the beginning of
the Q (or R) wave to the end of the
S wave.
Should be <0.12s duration(less
than 3 small boxes).
QRS COMPLEX
Q wave – first negative
deflection
R wave – first positive
deflection after a P wave
S wave – negative deflection
following an R wave
QRS COMPLEX
ST SEGMENT
The isoelectric segment
following depolarization and
preceding ventricular
repolarization
From the end of the QRS to the
beginning of the T wave
ST SEGMENT
Elevation or depression of the ST
segment by 0.1 mV from the baseline
is abnormal
T WAVE
Represents ventricular recovery or
repolarization
T follows the QRS complex and is
usually the same direction as the
QRS complex. If QRS is
predominantly negative an inverted T
wave is not necessarily abnormal
T WAVE
Location: follows the S wave.
Amplitude: 0.5 mm in leads
I,II,III,& UP to 10 mm in the
pericardial leads.
Configuration: typically round
and smooth.
T WAVE
U wave
Represents late ventricular
repolarization
QT interval
Represents the total time required
for ventricular depolarization and
repolarization.
Measured from the beginning of the
QRS complex to the end of the T
wave
QT INTERVAL
Duration: varies according to
age, gender and heart rate,
usually lasts from 0.36 to
0.44 second (9 to 11 small
boxes.
The faster the heart rate, the
shorter the QT interval.
QT INTERVAL
NORMAL SINUS RHYTHM
Originates in the sinoatrial node
(SA)
Rhythm: atrial/ventricular
regular
Rate: atrial/ventricular rates 60
to 100 bpm
P Waves: present, consistent
configuration
NORMAL SINUS
RHYTHM (CONT.)
One P wave before every QRS
PR interval: 0.12 to 0.20
second and constant
QRS duration: 0.04 to 0.10
second (1 to 3 small blocks)
and constant
NORMAL ECG
The standard EKG is composed of 12
separate leads
If you observe this same object from six different
reference points, you will recognize the car
To obtain the limb leads, electrodes are
placed on the right and left arms and the left
leg forming a triangle (Einthoven’s)
Each side of the triangle formed by the three
electrodes, represents a lead (I, II, III) using
different electrode pairs for each lead
By pushing these three leads to the center of the triangle,
there are three intersecting lines of reference
Another lead is the AVR lead. The AVR lead
uses the right arm as positive and all other limb
electrodes as a (common ) grand (negative).
The remaining two limb leads are AVL and AVF
and are obtained in a similar manner
The AVR, AVL, and AVF leads intersect at different angles
and produce three other intersecting lines of reference
All six leads, I, II, III, AVR, AVL and AVF, meet to form
six neatly inter-secting reference lines which lie in a
flat plane on the patient’s chest.
Each limb lead records from a different angle, thus
each lead (I, II, II, AVR, AVL, and AVF) is a different
view of the same cardiac activity
If you observe this same object from six different
reference points, you will recognize the car
To obtain the six chest leads, positive electrode is placed
at six different positions around the chest
The chest leads are projected through the AV Node towards the
patient’s back which is the negative end of each chest lead
Leads V1 and V2 are placed over the right side of the
heart, while V5 and V6 are over the left side of the heart.
Leads V3 and V4 are located over the
interventricular septum
To demonstrate the direction of electrical
activity, we use a “vector”
We can use small vectors to demonstrate ventricular depolarization
which begins in the endocardium (inner lining) and proceeds
through the ventricular wall
The Mean QRS Vector normal points downward and
to the patient’s left side
With the sphere in mind, consider lead I (left arm with
the positive electrode, right arm with the negative)
If the QRS complex is negative in lead I (Vector toward
the right), this is Right Axis Deviation
In lead AVF if the QRS is mainly positive one the
tracing, then the Mean QRS Vector points downward
In AVF if the QRS is negative, the Vector points
upward into the negative half of the sphere
If the QRS is positive in lead I and also positive in
AVF, the Vector points downward and to the
patient’s left (normal range)
If the QRS is positive in lead I, and negative in AVF,
that places the Vector in the upper left quadrant
Now by looking at the QRS complex in I and AVF you
can locate the Mean QRS Vector
HEART RATE
CALCULATION
Two methods can be used to calculate
the heart rate:
10-times method:
Used especially if the rhythm is
irregular. Count the number of P
waves in a 6-second strip (30 large
blocks) then multiply the number of
P waves by 10 to get the atrial rate.
To calculate ventricular rate count R
wave in a 6-second strip then
multiply this number by 10.
RULE OF 300
This method only works for regular
rhythms.
Take the number of “big boxes”
between neighboring QRS
complexes, and divide this into
300. The result will be
approximately equal to the rate.
COUNT THE
RATE HERE?
QUESTIONS
PRACTICE
EXERCISE
for attention
for attention

normal ECG interpretation presentation.ppt

  • 1.
    NORMAL ECG Prepared by Mahmoud TahaAbd El-kafy Under supervision of Prof.dr/Warda Youssif Dr/ Youssria Abd Elsalam
  • 2.
    OBJECTIVES Discuss the compositionof the cardiac cycle &cardiac properties Describe how impulse conduction works in the heart Identify how leads and planes function.
  • 3.
    OBJECTIVES (CONT.) Identify typesof ECG monitoring. Describe the components of an electrocardiogram complex along with their significance. Identify how to calculate the rate and rhythm of an ECG recording.
  • 4.
    OUTLINES: Cardiac cycle &cardiacproperties. Intrinsic conduction system. Types of ECG. ECG Leads. ECG paper. Characteristics of normal ECG tracing. Heart Rate Calculation. Normal axis of the heart
  • 5.
    CARDIAC CYCLE The cardiaccycle is composed of both the electrical activity due to automaticity and the mechanical (muscular) response known as contraction. Generation and transmission of electrical impulses depend on automaticity, excitability, conductivity, and contractility of cardiac cells.
  • 6.
    ELECTROPHYSIOLOGIC PROPERTIES OF THE HEART Automaticity: cangenerate an electric impulse on its own Excitability: Non-pacemaker cells can respond to impulse and depolarize
  • 7.
    ELECTROPHYSIOLOGIC PROPERTIES OF THE HEART(CONT.) Conductivity: Can transmit impulse from cell membrane to cell membrane Contractility: Cardiac muscle cells can shorten fiber length in response to electrical stimulation, creating sufficient pressure to propel blood forward (Mechanical activity)
  • 8.
    CARDIAC CYCLE(CONT.) The electrical activitycan be divided into two phases called depolarization and repolarization. The mechanical response is divided into diastole and systole. Depolarization is the active phase of electrical activity. Repolarization is the resting phase during which electrical activity is minimal.
  • 9.
    •Phase of thecardiac cycle when the myocardium contracts is termed systole. Phase of the cardiac cycle when myocardium is relaxed is termed diastole.
  • 10.
    WHAT IS ANECG? Records electrical activity of the heart Gives us information about cardiac rhythm, ischaemia/infarction and some generalised disorders (e.g. electrolyte imbalance) 4 limb and 6 chest electrodes = 12 lead ECG Each lead gives a different viewpoint of electrical activity in the heart
  • 11.
  • 12.
    USES OF ECG TRACING Todetect: Ischemia/infarction Arrhythmias Ventricular and atrial enlargements Conduction defects Pericarditis Effects of some drugs and electrolytes (Digoxen &potassium).
  • 13.
  • 16.
    SA node: Rate: 60to 100 bpm AV node: Rate: 40-60 bpm Bundle of His: Rate: 40-60 bpm Purkinje Fibers: Rate: 20-40 bpm
  • 17.
    TYPES OF ECG Thetwo types of ECG recording are the 12-lead ECG and single-lead ECG, commonly known as a rhythm strip. Both types give valuable information about heart function.
  • 18.
  • 19.
  • 20.
  • 21.
    AUGMENTED LEADS AVR looksfrom right shoulder into the middle AVL looks from left shoulder into the middle AVF looks from the left feet to the middle
  • 22.
  • 23.
  • 24.
  • 25.
  • 26.
    View from Chestand Limb Leads
  • 27.
    LEAD PLACEMENTS V1 -4th ICS, Right sternal border V2 - 4th ICS, Left sternal border V3 - Midway between V2 and V4 V4 - 5th ICS, Mid clavicle V5 - Anterior aspect of axilla, same line as V4 V6 - Mid axilla, same line a V4 4 limb leads.
  • 28.
  • 29.
  • 30.
    The EKG isrecorded on ruled paper. The smallest divisions are one millimeter squares
  • 31.
    The height anddepth of a wave is measured in millimeters and represents a measure of voltage
  • 32.
    The horizontal axisrepresents time
  • 33.
    One small box= 0.04 seconds One large box = 5 small boxes = 0.2 seconds 5 large boxes = 1 second
  • 36.
    P WAVE It representsatrial depolrization Location: precedes the QRS complex. Amplitude: 2-3 mm high.
  • 37.
    P WAVE Duration: 0.06 to0.12 second (1.5 to3 small blocks). Configuration: rounded and upright. Deflection: positive
  • 38.
  • 39.
    PR INTERVAL  Startof P wave to start of QRS  Normal = 0.12-0.2s (3-5 small squares)
  • 40.
    QRS COMPLEX Represents ventricular depolarization. Measuredfrom the beginning of the Q (or R) wave to the end of the S wave. Should be <0.12s duration(less than 3 small boxes).
  • 41.
    QRS COMPLEX Q wave– first negative deflection R wave – first positive deflection after a P wave S wave – negative deflection following an R wave
  • 42.
  • 43.
    ST SEGMENT The isoelectricsegment following depolarization and preceding ventricular repolarization From the end of the QRS to the beginning of the T wave
  • 44.
    ST SEGMENT Elevation ordepression of the ST segment by 0.1 mV from the baseline is abnormal
  • 45.
    T WAVE Represents ventricularrecovery or repolarization T follows the QRS complex and is usually the same direction as the QRS complex. If QRS is predominantly negative an inverted T wave is not necessarily abnormal
  • 46.
    T WAVE Location: followsthe S wave. Amplitude: 0.5 mm in leads I,II,III,& UP to 10 mm in the pericardial leads. Configuration: typically round and smooth.
  • 47.
  • 48.
    U wave Represents lateventricular repolarization QT interval Represents the total time required for ventricular depolarization and repolarization. Measured from the beginning of the QRS complex to the end of the T wave
  • 49.
    QT INTERVAL Duration: variesaccording to age, gender and heart rate, usually lasts from 0.36 to 0.44 second (9 to 11 small boxes. The faster the heart rate, the shorter the QT interval.
  • 50.
  • 51.
    NORMAL SINUS RHYTHM Originatesin the sinoatrial node (SA) Rhythm: atrial/ventricular regular Rate: atrial/ventricular rates 60 to 100 bpm P Waves: present, consistent configuration
  • 52.
    NORMAL SINUS RHYTHM (CONT.) OneP wave before every QRS PR interval: 0.12 to 0.20 second and constant QRS duration: 0.04 to 0.10 second (1 to 3 small blocks) and constant
  • 54.
  • 55.
    The standard EKGis composed of 12 separate leads
  • 56.
    If you observethis same object from six different reference points, you will recognize the car
  • 57.
    To obtain thelimb leads, electrodes are placed on the right and left arms and the left leg forming a triangle (Einthoven’s)
  • 58.
    Each side ofthe triangle formed by the three electrodes, represents a lead (I, II, III) using different electrode pairs for each lead
  • 59.
    By pushing thesethree leads to the center of the triangle, there are three intersecting lines of reference
  • 60.
    Another lead isthe AVR lead. The AVR lead uses the right arm as positive and all other limb electrodes as a (common ) grand (negative).
  • 61.
    The remaining twolimb leads are AVL and AVF and are obtained in a similar manner
  • 62.
    The AVR, AVL,and AVF leads intersect at different angles and produce three other intersecting lines of reference
  • 63.
    All six leads,I, II, III, AVR, AVL and AVF, meet to form six neatly inter-secting reference lines which lie in a flat plane on the patient’s chest.
  • 64.
    Each limb leadrecords from a different angle, thus each lead (I, II, II, AVR, AVL, and AVF) is a different view of the same cardiac activity
  • 65.
    If you observethis same object from six different reference points, you will recognize the car
  • 66.
    To obtain thesix chest leads, positive electrode is placed at six different positions around the chest
  • 67.
    The chest leadsare projected through the AV Node towards the patient’s back which is the negative end of each chest lead
  • 68.
    Leads V1 andV2 are placed over the right side of the heart, while V5 and V6 are over the left side of the heart.
  • 69.
    Leads V3 andV4 are located over the interventricular septum
  • 70.
    To demonstrate thedirection of electrical activity, we use a “vector”
  • 71.
    We can usesmall vectors to demonstrate ventricular depolarization which begins in the endocardium (inner lining) and proceeds through the ventricular wall
  • 72.
    The Mean QRSVector normal points downward and to the patient’s left side
  • 73.
    With the spherein mind, consider lead I (left arm with the positive electrode, right arm with the negative)
  • 74.
    If the QRScomplex is negative in lead I (Vector toward the right), this is Right Axis Deviation
  • 75.
    In lead AVFif the QRS is mainly positive one the tracing, then the Mean QRS Vector points downward
  • 76.
    In AVF ifthe QRS is negative, the Vector points upward into the negative half of the sphere
  • 77.
    If the QRSis positive in lead I and also positive in AVF, the Vector points downward and to the patient’s left (normal range)
  • 78.
    If the QRSis positive in lead I, and negative in AVF, that places the Vector in the upper left quadrant
  • 79.
    Now by lookingat the QRS complex in I and AVF you can locate the Mean QRS Vector
  • 80.
    HEART RATE CALCULATION Two methodscan be used to calculate the heart rate: 10-times method: Used especially if the rhythm is irregular. Count the number of P waves in a 6-second strip (30 large blocks) then multiply the number of P waves by 10 to get the atrial rate.
  • 81.
    To calculate ventricularrate count R wave in a 6-second strip then multiply this number by 10.
  • 82.
    RULE OF 300 Thismethod only works for regular rhythms. Take the number of “big boxes” between neighboring QRS complexes, and divide this into 300. The result will be approximately equal to the rate.
  • 83.
  • 84.
  • 85.
  • 87.