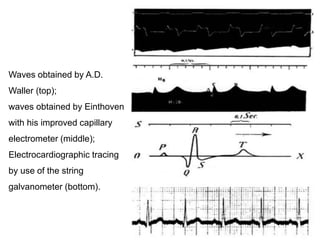
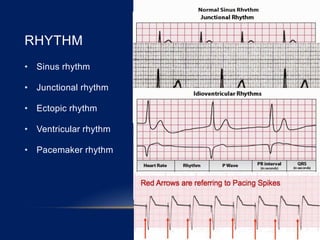
Waves obtained byA.D.
Waller (top);
waves obtained by Einthoven
with his improved capillary
electrometer (middle);
Electrocardiographic tracing
by use of the string
galvanometer (bottom).
6.
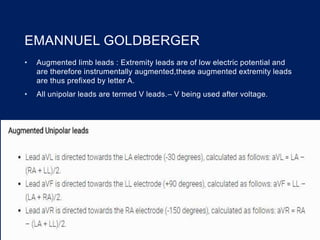
EMANNUEL GOLDBERGER
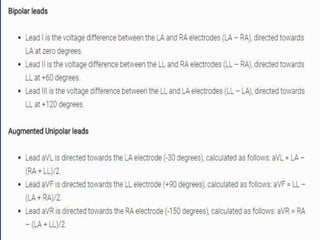
• Augmentedlimb leads : Extremity leads are of low electric potential and
are therefore instrumentally augmented,these augmented extremity leads
are thus prefixed by letter A.
• All unipolar leads are termed V leads.– V being used after voltage.
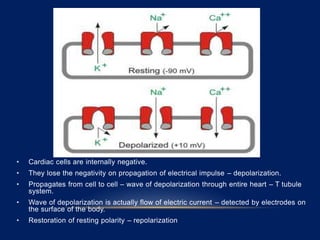
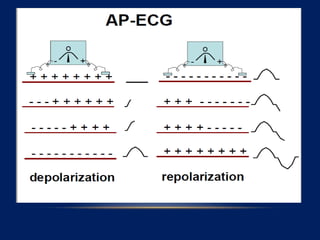
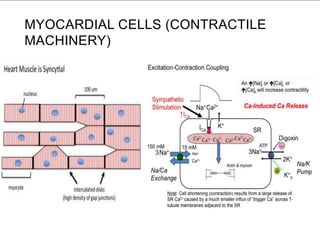
• Cardiac cellsare internally negative.
• They lose the negativity on propagation of electrical impulse – depolarization.
• Propagates from cell to cell – wave of depolarization through entire heart – T tubule
system.
• Wave of depolarization is actually flow of electric current – detected by electrodes on
the surface of the body.
• Restoration of resting polarity – repolarization
13.
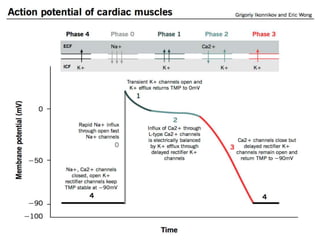
ACTION POTENTIAL –MYOCARDIAL CELL
• Different phases of the action potential relate directly to the waveforms,
intervals and segments that constitute a cardiac cycle on the ECG.
• Each phase is distinguished by an alteration in cell membrane
permeability to sodium, potassium and calcium ions.
• Helpful in learning ECG features associated with conduction
abnormalities, drug toxicities, and electrolyte disturbances.
• Action potential of the myocardial cell is divided into five phases.
• Phases (0-4)
14.
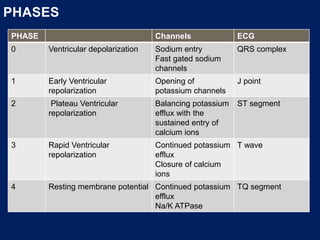
PHASES
PHASE Channels ECG
0Ventricular depolarization Sodium entry
Fast gated sodium
channels
QRS complex
1 Early Ventricular
repolarization
Opening of
potassium channels
J point
2 Plateau Ventricular
repolarization
Balancing potassium
efflux with the
sustained entry of
calcium ions
ST segment
3 Rapid Ventricular
repolarization
Continued potassium
efflux
Closure of calcium
ions
T wave
4 Resting membrane potential Continued potassium
efflux
Na/K ATPase
TQ segment
16.
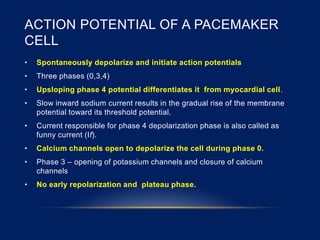
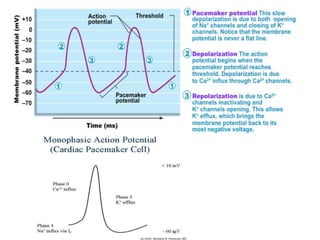
ACTION POTENTIAL OFA PACEMAKER
CELL
• Spontaneously depolarize and initiate action potentials
• Three phases (0,3,4)
• Upsloping phase 4 potential differentiates it from myocardial cell.
• Slow inward sodium current results in the gradual rise of the membrane
potential toward its threshold potential.
• Current responsible for phase 4 depolarization phase is also called as
funny current (If).
• Calcium channels open to depolarize the cell during phase 0.
• Phase 3 – opening of potassium channels and closure of calcium
channels
• No early repolarization and plateau phase.
18.
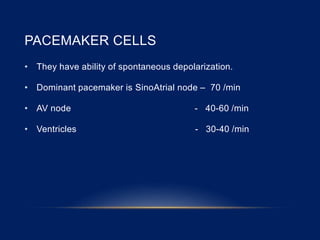
PACEMAKER CELLS
• Theyhave ability of spontaneous depolarization.
• Dominant pacemaker is SinoAtrial node – 70 /min
• AV node - 40-60 /min
• Ventricles - 30-40 /min
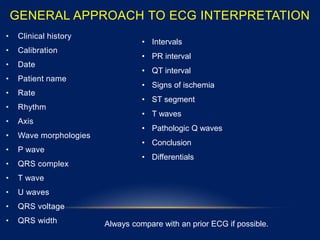
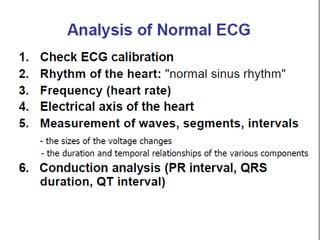
GENERAL APPROACH TOECG INTERPRETATION
• Clinical history
• Calibration
• Date
• Patient name
• Rate
• Rhythm
• Axis
• Wave morphologies
• P wave
• QRS complex
• T wave
• U waves
• QRS voltage
• QRS width
• Intervals
• PR interval
• QT interval
• Signs of ischemia
• ST segment
• T waves
• Pathologic Q waves
• Conclusion
• Differentials
Always compare with an prior ECG if possible.
35.
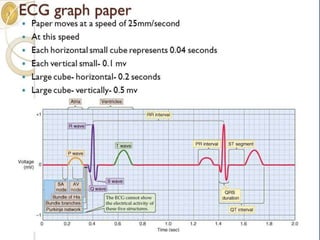
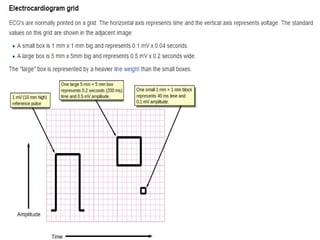
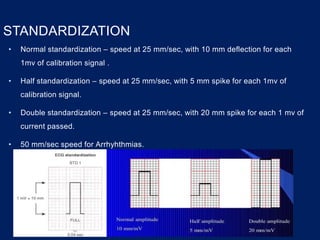
STANDARDIZATION
• Normal standardization– speed at 25 mm/sec, with 10 mm deflection for each
1mv of calibration signal .
• Half standardization – speed at 25 mm/sec, with 5 mm spike for each 1mv of
calibration signal.
• Double standardization – speed at 25 mm/sec, with 20 mm spike for each 1 mv of
current passed.
• 50 mm/sec speed for Arrhyhthmias.
37.
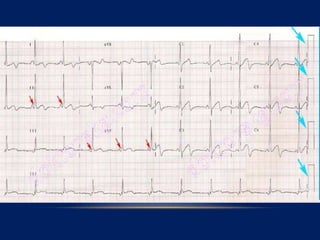
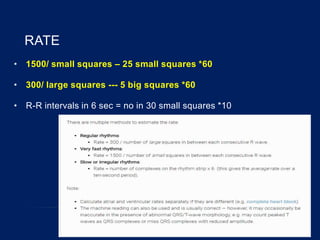
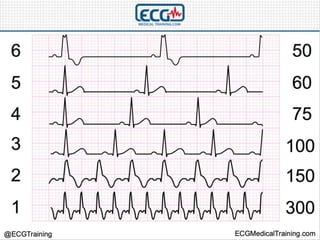
RATE
• 1500/ smallsquares – 25 small squares *60
• 300/ large squares --- 5 big squares *60
• R-R intervals in 6 sec = no in 30 small squares *10
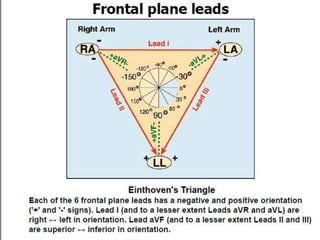
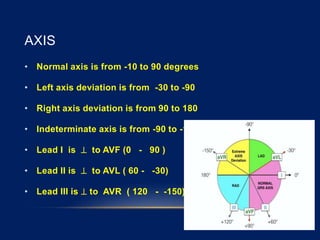
AXIS
• Normal axisis from -10 to 90 degrees
• Left axis deviation is from -30 to -90
• Right axis deviation is from 90 to 180
• Indeterminate axis is from -90 to -180
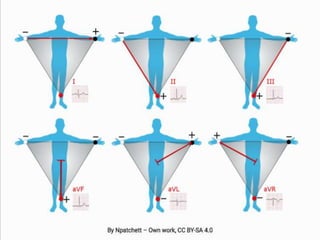
• Lead I is to AVF (0 - 90 )
• Lead II is to AVL ( 60 - -30)
• Lead III is to AVR ( 120 - -150)
42.
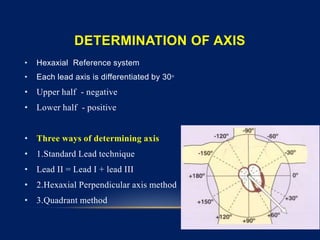
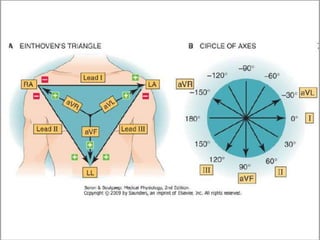
DETERMINATION OF AXIS
•Hexaxial Reference system
• Each lead axis is differentiated by 30ᵒ
• Upper half - negative
• Lower half - positive
• Three ways of determining axis
• 1.Standard Lead technique
• Lead II = Lead I + lead III
• 2.Hexaxial Perpendicular axis method
• 3.Quadrant method
44.
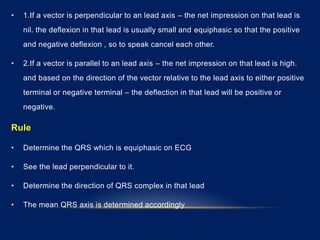
• 1.If avector is perpendicular to an lead axis – the net impression on that lead is
nil. the deflexion in that lead is usually small and equiphasic so that the positive
and negative deflexion , so to speak cancel each other.
• 2.If a vector is parallel to an lead axis – the net impression on that lead is high.
and based on the direction of the vector relative to the lead axis to either positive
terminal or negative terminal – the deflection in that lead will be positive or
negative.
Rule
• Determine the QRS which is equiphasic on ECG
• See the lead perpendicular to it.
• Determine the direction of QRS complex in that lead
• The mean QRS axis is determined accordingly
46.
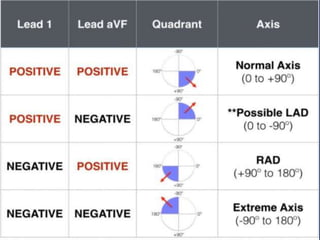
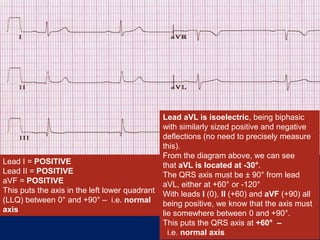
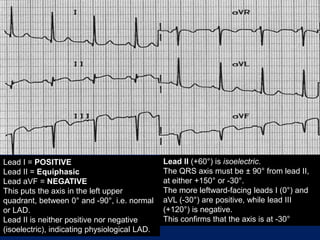
Lead I =POSITIVE
Lead II = POSITIVE
aVF = POSITIVE
This puts the axis in the left lower quadrant
(LLQ) between 0° and +90° – i.e. normal
axis
Lead aVL is isoelectric, being biphasic
with similarly sized positive and negative
deflections (no need to precisely measure
this).
From the diagram above, we can see
that aVL is located at -30°.
The QRS axis must be ± 90° from lead
aVL, either at +60° or -120°
With leads I (0), II (+60) and aVF (+90) all
being positive, we know that the axis must
lie somewhere between 0 and +90°.
This puts the QRS axis at +60° –
i.e. normal axis
47.
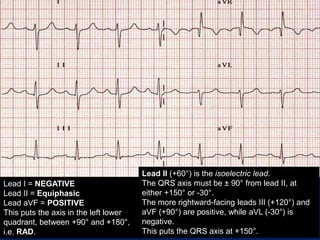
Lead I =NEGATIVE
Lead II = Equiphasic
Lead aVF = POSITIVE
This puts the axis in the left lower
quadrant, between +90° and +180°,
i.e. RAD.
Lead II (+60°) is the isoelectric lead.
The QRS axis must be ± 90° from lead II, at
either +150° or -30°.
The more rightward-facing leads III (+120°) and
aVF (+90°) are positive, while aVL (-30°) is
negative.
This puts the QRS axis at +150°.
48.
Lead I =POSITIVE
Lead II = Equiphasic
Lead aVF = NEGATIVE
This puts the axis in the left upper
quadrant, between 0° and -90°, i.e. normal
or LAD.
Lead II is neither positive nor negative
(isoelectric), indicating physiological LAD.
Lead II (+60°) is isoelectric.
The QRS axis must be ± 90° from lead II,
at either +150° or -30°.
The more leftward-facing leads I (0°) and
aVL (-30°) are positive, while lead III
(+120°) is negative.
This confirms that the axis is at -30°
49.
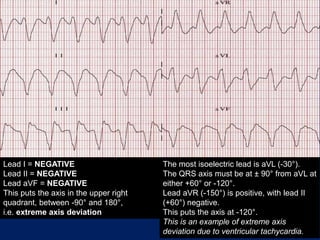
Lead I =NEGATIVE
Lead II = NEGATIVE
Lead aVF = NEGATIVE
This puts the axis in the upper right
quadrant, between -90° and 180°,
i.e. extreme axis deviation
The most isoelectric lead is aVL (-30°).
The QRS axis must be at ± 90° from aVL at
either +60° or -120°.
Lead aVR (-150°) is positive, with lead II
(+60°) negative.
This puts the axis at -120°.
This is an example of extreme axis
deviation due to ventricular tachycardia.
50.
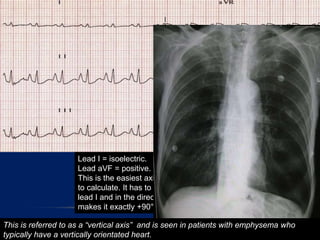
Lead I =isoelectric.
Lead aVF = positive.
This is the easiest axis you will ever have
to calculate. It has to be at right angles to
lead I and in the direction of aVF, which
makes it exactly +90°!
This is referred to as a “vertical axis” and is seen in patients with emphysema who
typically have a vertically orientated heart.
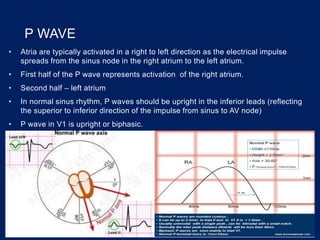
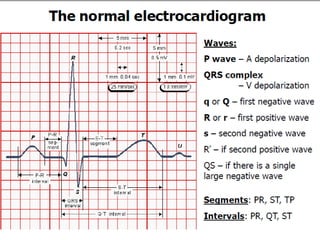
P WAVE
• Atriaare typically activated in a right to left direction as the electrical impulse
spreads from the sinus node in the right atrium to the left atrium.
• First half of the P wave represents activation of the right atrium.
• Second half – left atrium
• In normal sinus rhythm, P waves should be upright in the inferior leads (reflecting
the superior to inferior direction of the impulse from sinus to AV node)
• P wave in V1 is upright or biphasic.
54.
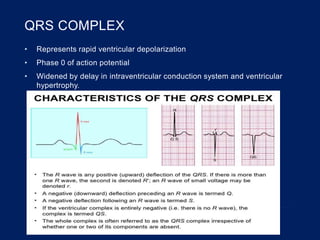
QRS COMPLEX
• Representsrapid ventricular depolarization
• Phase 0 of action potential
• Widened by delay in intraventricular conduction system and ventricular
hypertrophy.
55.
• Zone oftransition is at V3 or V4
• If at V2 or V1 – counter clockwise rotation, q waves in lead II,III,aVF
• If at V5 or V6 - clockwise rotation , q waves in Lead I,aVL
• Normal QRS complex duration is 0.08sec to 0.10 sec (2 small boxes to 2
½ small boxes)
56.
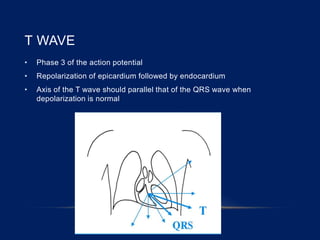
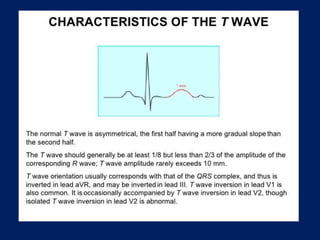
T WAVE
• Phase3 of the action potential
• Repolarization of epicardium followed by endocardium
• Axis of the T wave should parallel that of the QRS wave when
depolarization is normal
59.
U WAVE
• Maybe absent in the normal electrocardiogram
• The U wave is a small (0.5 mm) deflection immediately following the T
wave
• U wave is usually in the same direction as the T wave.
• U wave is best seen in leads V2 and V3
• The source of the U wave is unknown.
• Three common theories regarding its origin are:
1. Delayed repolarisation of Purkinje fibres
2. Prolonged repolarisation of mid-myocardial “M-cells”
3. After-potentials resulting from mechanical forces in the ventricular wall
60.
NORMAL U WAVE
•The U wave normally goes in the same direction as the T wave
• U -wave size is inversely proportional to heart rate: the U wave grows
bigger as the heart rate slows down
• U waves generally become visible when the heart rate falls below 65 bpm
• The voltage of the U wave is normally < 25% of the T-wave voltage:
disproportionally large U waves are abnormal
• Maximum normal amplitude of the U wave is 1-2 mm
61.
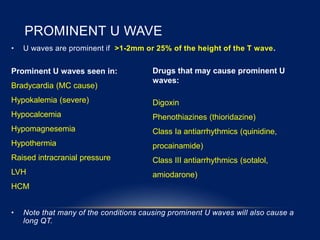
PROMINENT U WAVE
•U waves are prominent if >1-2mm or 25% of the height of the T wave.
• Note that many of the conditions causing prominent U waves will also cause a
long QT.
Drugs that may cause prominent U
waves:
Digoxin
Phenothiazines (thioridazine)
Class Ia antiarrhythmics (quinidine,
procainamide)
Class III antiarrhythmics (sotalol,
amiodarone)
Prominent U waves seen in:
Bradycardia (MC cause)
Hypokalemia (severe)
Hypocalcemia
Hypomagnesemia
Hypothermia
Raised intracranial pressure
LVH
HCM
62.
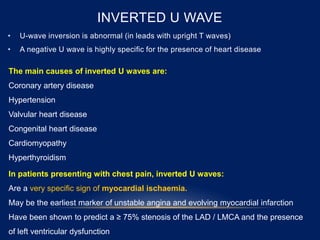
INVERTED U WAVE
•U-wave inversion is abnormal (in leads with upright T waves)
• A negative U wave is highly specific for the presence of heart disease
The main causes of inverted U waves are:
Coronary artery disease
Hypertension
Valvular heart disease
Congenital heart disease
Cardiomyopathy
Hyperthyroidism
In patients presenting with chest pain, inverted U waves:
Are a very specific sign of myocardial ischaemia.
May be the earliest marker of unstable angina and evolving myocardial infarction
Have been shown to predict a ≥ 75% stenosis of the LAD / LMCA and the presence
of left ventricular dysfunction
64.
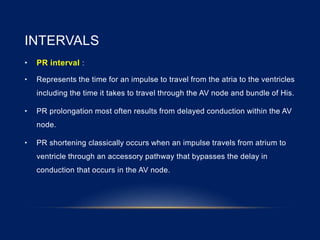
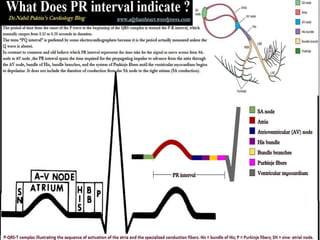
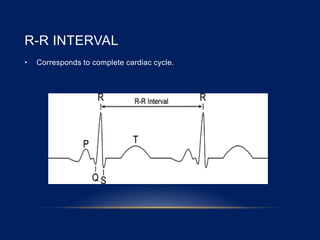
INTERVALS
• PR interval:
• Represents the time for an impulse to travel from the atria to the ventricles
including the time it takes to travel through the AV node and bundle of His.
• PR prolongation most often results from delayed conduction within the AV
node.
• PR shortening classically occurs when an impulse travels from atrium to
ventricle through an accessory pathway that bypasses the delay in
conduction that occurs in the AV node.
66.
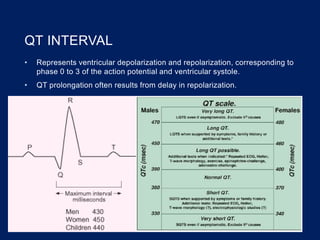
QT INTERVAL
• Representsventricular depolarization and repolarization, corresponding to
phase 0 to 3 of the action potential and ventricular systole.
• QT prolongation often results from delay in repolarization.
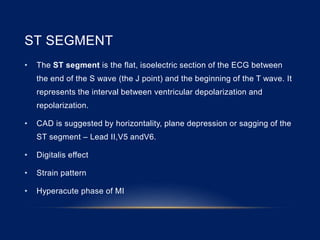
ST SEGMENT
• TheST segment is the flat, isoelectric section of the ECG between
the end of the S wave (the J point) and the beginning of the T wave. It
represents the interval between ventricular depolarization and
repolarization.
• CAD is suggested by horizontality, plane depression or sagging of the
ST segment – Lead II,V5 andV6.
• Digitalis effect
• Strain pattern
• Hyperacute phase of MI
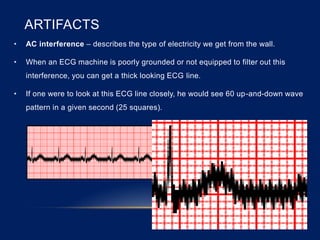
ARTIFACTS
• AC interference– describes the type of electricity we get from the wall.
• When an ECG machine is poorly grounded or not equipped to filter out this
interference, you can get a thick looking ECG line.
• If one were to look at this ECG line closely, he would see 60 up-and-down wave
pattern in a given second (25 squares).
74.
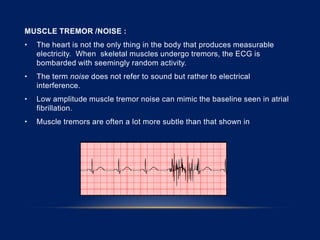
MUSCLE TREMOR /NOISE:
• The heart is not the only thing in the body that produces measurable
electricity. When skeletal muscles undergo tremors, the ECG is
bombarded with seemingly random activity.
• The term noise does not refer to sound but rather to electrical
interference.
• Low amplitude muscle tremor noise can mimic the baseline seen in atrial
fibrillation.
• Muscle tremors are often a lot more subtle than that shown in
75.
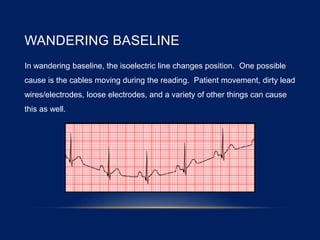
WANDERING BASELINE
In wanderingbaseline, the isoelectric line changes position. One possible
cause is the cables moving during the reading. Patient movement, dirty lead
wires/electrodes, loose electrodes, and a variety of other things can cause
this as well.
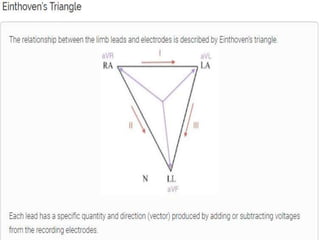
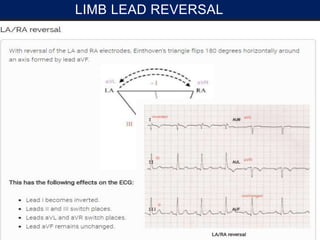
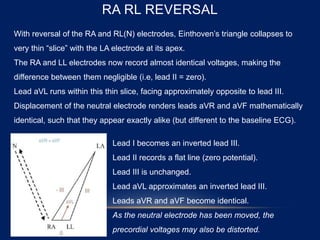
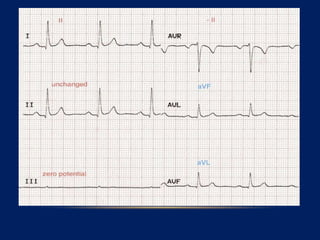
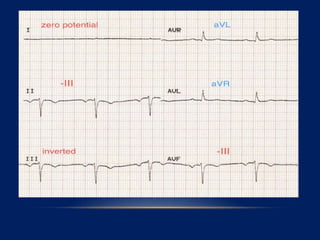
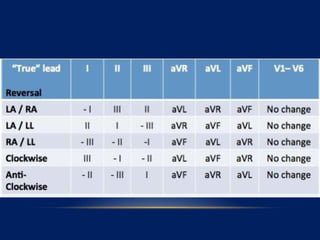
RA RL REVERSAL
Withreversal of the RA and RL(N) electrodes, Einthoven’s triangle collapses to
very thin “slice” with the LA electrode at its apex.
The RA and LL electrodes now record almost identical voltages, making the
difference between them negligible (i.e, lead II = zero).
Lead aVL runs within this thin slice, facing approximately opposite to lead III.
Displacement of the neutral electrode renders leads aVR and aVF mathematically
identical, such that they appear exactly alike (but different to the baseline ECG).
Lead I becomes an inverted lead III.
Lead II records a flat line (zero potential).
Lead III is unchanged.
Lead aVL approximates an inverted lead III.
Leads aVR and aVF become identical.
As the neutral electrode has been moved, the
precordial voltages may also be distorted.
82.
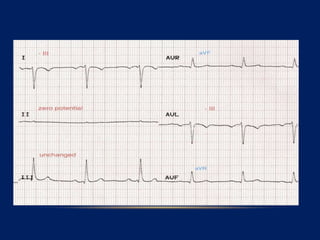
LA/RL(N) reversal
• Withreversal of the LA and RL(N) electrodes, Einthoven’s triangle collapses to very
thin “slice” with the RA electrode at its apex.
• The LA and LL electrodes now record almost identical voltages, making the difference
between them negligible (i.e. lead III = zero).
• Lead aVR runs within this thin slice, facing approximately opposite to lead II.
• The displacement of the neutral electrode renders leads aVL and aVF mathematically
identical, such that they appear exactly alike (but different to the baseline ECG).
Lead I becomes identical to lead II.
Lead II is unchanged.
Lead III records a flat line (zero potential).
Lead aVR approximates to an inverted lead II.
Leads aVL and aVF become identical.
As the neutral electrode has been moved, the
precordial voltages may also be distorted.
84.
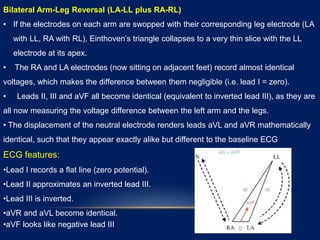
Bilateral Arm-Leg Reversal(LA-LL plus RA-RL)
• If the electrodes on each arm are swopped with their corresponding leg electrode (LA
with LL, RA with RL), Einthoven’s triangle collapses to a very thin slice with the LL
electrode at its apex.
• The RA and LA electrodes (now sitting on adjacent feet) record almost identical
voltages, which makes the difference between them negligible (i.e. lead I = zero).
• Leads II, III and aVF all become identical (equivalent to inverted lead III), as they are
all now measuring the voltage difference between the left arm and the legs.
• The displacement of the neutral electrode renders leads aVL and aVR mathematically
identical, such that they appear exactly alike but different to the baseline ECG
ECG features:
•Lead I records a flat line (zero potential).
•Lead II approximates an inverted lead III.
•Lead III is inverted.
•aVR and aVL become identical.
•aVF looks like negative lead III
86.
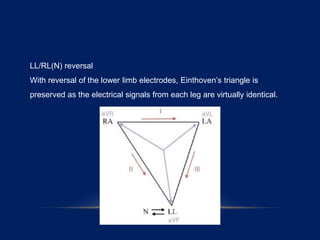
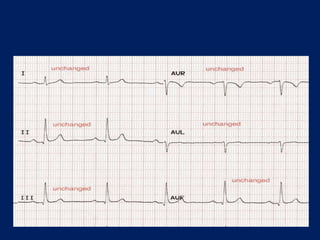
LL/RL(N) reversal
With reversalof the lower limb electrodes, Einthoven’s triangle is
preserved as the electrical signals from each leg are virtually identical.
REFERENCES
1. Leo SchamrothAn Introduction to Electrocardiography
2. Rapide Interpretation of ECGs in Emergency Medicine A visual Guide –
Jennifer L.Mandale
3. Dr.Smith ECG BLOG
4. Lifeinthefastlane


![CASE_PRESENTATION_ON_subdural_hematoma(SDH)[1 FINAL PPT]-1.pptx](https://cdn.slidesharecdn.com/ss_thumbnails/casepresentationonsubduralhematomasdh1finalppt-1-260129172522-d405d375-thumbnail.jpg?width=640&height=640&fit=bounds)


