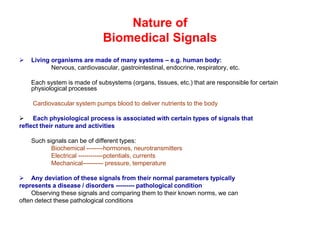
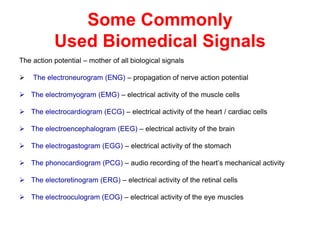
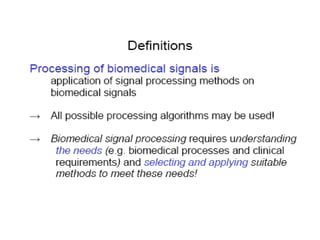
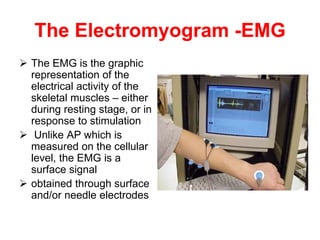
Introduction:
Characterization of
Biomedical
Signals
Biomedical Signal Processing
Chemical
Level
Organizational
Level
Tissue
Level
Organ
Level
Cellular
Level
System
Level
Nature of
Biomedical Signals
 Living organisms are made of many systems – e.g. human body:
Nervous, cardiovascular, gastrointestinal, endocrine, respiratory, etc.
Each system is made of subsystems (organs, tissues, etc.) that are responsible for certain
physiological processes
Cardiovascular system pumps blood to deliver nutrients to the body
 Each physiological process is associated with certain types of signals that
reflect their nature and activities
Such signals can be of different types:
Biochemical --------hormones, neurotransmitters
Electrical ------------potentials, currents
Mechanical---------- pressure, temperature
 Any deviation of these signals from their normal parameters typically
represents a disease / disorders --------- pathological condition
Observing these signals and comparing them to their known norms, we can
often detect these pathological conditions
Some Commonly
Used Biomedical Signals
The action potential – mother of all biological signals
 The electroneurogram (ENG) – propagation of nerve action potential
 The electromyogram (EMG) – electrical activity of the muscle cells
 The electrocardiogram (ECG) – electrical activity of the heart / cardiac cells
 The electroencephalogram (EEG) – electrical activity of the brain
 The electrogastogram (EGG) – electrical activity of the stomach
 The phonocardiogram (PCG) – audio recording of the heart’s mechanical activity
 The electoretinogram (ERG) – electrical activity of the retinal cells
 The electrooculogram (EOG) – electrical activity of the eye muscles
The Action Potential
The action potential is the origin of all biopotentials
 All biological signals of electrical origin are made up from integration of many
action potentials
The AP is the electrical signal that is generated by a single cell when it is
mechanically, electrically or chemically stimulated
 It is the primary mechanism through which electrical signals propagate between
cells, tissues and organs.
 It is due in part, to an electrochemical imbalance across the cell membrane, and in
part, due to selective permeability of the membrane to certain ions
• At resting state, the cell membrane is permeable to K+ and Cl-, but not to Na+
• Lots of Na+ trapped outside make the intracellular region electrically more negative,
with a resting membrane potential of -60 ~-80 mV
• When the cell is disturbed, ion channels across the membrane open up and allow an
influx of Na+ : depolarization  inside of the cell becomes more positive: +20mV
• However, the channels close soon after, forcing the membrane potential back to its
resting stage: repolarization
• The change in membrane potential is the AP, which itself then stimulates the
neighboring cell, and starts the transmission of the APs
Computer aided diagnosis
Objective of biomedical signal
analysis
• Information gathering - measurement of phenomena to interpret a system.
• Diagnosis - detection of malfunction, pathology, or abnormality.
• Monitoring - obtaining continuous or periodic information about a system.
• Therapy and control - modification of the behavior of a system based upon
• the outcome of the activities listed above to ensure a specific result.
• Evaluation - objective analysis to determine the ability to meet functional
requirements, obtain proof of performance, perform quality control, or quantify
the effect of treatment.
Thank you
The Electromyogram -EMG
 The EMG is the graphic
representation of the
electrical activity of the
skeletal muscles – either
during resting stage, or in
response to stimulation
 Unlike AP which is
measured on the cellular
level, the EMG is a
surface signal
 obtained through surface
and/or needle electrodes
• Measures the electric activity of active muscle fibers
• Electrodes are always connected very close to the muscle
group being measured
• Rectified and integrated EMG signal gives rough indication
of the muscle activity
• Needle electrodes can be used to measure individual muscle fibers
• Amplitude: 1-10 mV
• Bandwidth: 20-3000 Hz
• Main sources of errors are 50/60 Hz and RF interference
• Applications: muscle function, neuromuscular disease, prosthesis
EMG SIGNAL
The Electrocardiogram - ECG
 ECG is the graphical recording of the
electrical activity of the heart
ECG can be obtained easily using
surface electrodes.
 As with other electrical signals of
biological origin, it is the combination
of many
 APs from different regions of the
heart that makes up the ECG
 Its characteristic shape is widely
recognized.
 Any abnormality in the cardiovascular
dynamics manifests itself as an
arrhythmia in the ECG
1. Atrial
depolarization
2. Ventricular
depolarization
3. Ventricular repolarization
Electrocardiogram - ECG
ECG
• Amplitude: 1-5 mV
• Bandwidth: 0.05-100 Hz
• Largest measurement error sources:
– Motion artifacts
– 50/60 Hz powerline interference
• Typical applications:
– Diagnosis of ischemia
– Arrhythmia
– Conduction defects
The Electroencephalogram
EEG
• Measures the brain’s electric activity from the scalp
• Measured signal results from the activity of billions of neurons
• Amplitude:0.001-0.01 Mv
• Bandwidth:0.5-40 Hz
• Errors:
– Thermal RF noise
– 50/60 Hz power lines
– Blink artifacts and similar
• Typical applications:
– Sleep studies
– Seizure detection
– Cortical mapping
EEG: Electrode Recording
System
• EEG recording is
done using a
standard lead
system called 10-
20 system
10-20 International
Electrode Placement
The Electrooculogram
EOG
 The EOG measures
the resting potential of
the retina. Unlike
ERG it is not recorded
in response to a
stimulus.
The EOG is often
used in recording the
eye-movements
Electrooculography (EOG)
• Electric potentials are created as a result
of the movement of the eyeballs
• Potential varies in proportion to the
amplitude of the movement
• In many ways a challenging measurement
with some clinical value
• Amplitude: 0.01-0.1 mV
• Bandwidth: DC-10 Hz
• Primary sources of error include skin
potential and motion
• Applications: eye position, sleep state,
vestibulo-ocular reflex
EOG RECORDING
Vertical recording
Horizontal recording
The Event Related
Potentials - ERPs
 ERPs are really EEGs obtained under a specific
protocol that requires the patient to response to
certain stimuli – hence event related potentials.
 Also called evoked potentials these signals can
be used to diagnose certain neurological
disorders.
 they can also be used as a lie detector
Electroretinogram
ERG
 The ERG is the record of the
retinal action currents
produced by the retina in
response to a light stimulus.
It measures the electrical
responses of the light-sensitive
cells (such as rods and cones).
 The stimuli are often a series
of light flashes or rotating
patterns
The ERG is recorded using
contact lens electrode that the
subject wears while watching
the stimuli.
Baseline drift due to the
changes in junction
potential or motion artifacts
Choice of electrodes
Electromagnetic
interference
 Shielding
ARTIFACT (Interference)
Muscle signal
interference
 Placement
PHYSIOLOGICAL INTERFERENCE
ECG with EMG interference
Biomedical Signals

Biomedical Signals

  • 1.
  • 2.
  • 3.
    Nature of Biomedical Signals Living organisms are made of many systems – e.g. human body: Nervous, cardiovascular, gastrointestinal, endocrine, respiratory, etc. Each system is made of subsystems (organs, tissues, etc.) that are responsible for certain physiological processes Cardiovascular system pumps blood to deliver nutrients to the body  Each physiological process is associated with certain types of signals that reflect their nature and activities Such signals can be of different types: Biochemical --------hormones, neurotransmitters Electrical ------------potentials, currents Mechanical---------- pressure, temperature  Any deviation of these signals from their normal parameters typically represents a disease / disorders --------- pathological condition Observing these signals and comparing them to their known norms, we can often detect these pathological conditions
  • 4.
    Some Commonly Used BiomedicalSignals The action potential – mother of all biological signals  The electroneurogram (ENG) – propagation of nerve action potential  The electromyogram (EMG) – electrical activity of the muscle cells  The electrocardiogram (ECG) – electrical activity of the heart / cardiac cells  The electroencephalogram (EEG) – electrical activity of the brain  The electrogastogram (EGG) – electrical activity of the stomach  The phonocardiogram (PCG) – audio recording of the heart’s mechanical activity  The electoretinogram (ERG) – electrical activity of the retinal cells  The electrooculogram (EOG) – electrical activity of the eye muscles
  • 5.
    The Action Potential Theaction potential is the origin of all biopotentials  All biological signals of electrical origin are made up from integration of many action potentials The AP is the electrical signal that is generated by a single cell when it is mechanically, electrically or chemically stimulated  It is the primary mechanism through which electrical signals propagate between cells, tissues and organs.  It is due in part, to an electrochemical imbalance across the cell membrane, and in part, due to selective permeability of the membrane to certain ions • At resting state, the cell membrane is permeable to K+ and Cl-, but not to Na+ • Lots of Na+ trapped outside make the intracellular region electrically more negative, with a resting membrane potential of -60 ~-80 mV • When the cell is disturbed, ion channels across the membrane open up and allow an influx of Na+ : depolarization  inside of the cell becomes more positive: +20mV • However, the channels close soon after, forcing the membrane potential back to its resting stage: repolarization • The change in membrane potential is the AP, which itself then stimulates the neighboring cell, and starts the transmission of the APs
  • 10.
  • 11.
    Objective of biomedicalsignal analysis • Information gathering - measurement of phenomena to interpret a system. • Diagnosis - detection of malfunction, pathology, or abnormality. • Monitoring - obtaining continuous or periodic information about a system. • Therapy and control - modification of the behavior of a system based upon • the outcome of the activities listed above to ensure a specific result. • Evaluation - objective analysis to determine the ability to meet functional requirements, obtain proof of performance, perform quality control, or quantify the effect of treatment.
  • 16.
  • 17.
    The Electromyogram -EMG The EMG is the graphic representation of the electrical activity of the skeletal muscles – either during resting stage, or in response to stimulation  Unlike AP which is measured on the cellular level, the EMG is a surface signal  obtained through surface and/or needle electrodes
  • 18.
    • Measures theelectric activity of active muscle fibers • Electrodes are always connected very close to the muscle group being measured • Rectified and integrated EMG signal gives rough indication of the muscle activity • Needle electrodes can be used to measure individual muscle fibers • Amplitude: 1-10 mV • Bandwidth: 20-3000 Hz • Main sources of errors are 50/60 Hz and RF interference • Applications: muscle function, neuromuscular disease, prosthesis
  • 19.
  • 20.
    The Electrocardiogram -ECG  ECG is the graphical recording of the electrical activity of the heart ECG can be obtained easily using surface electrodes.  As with other electrical signals of biological origin, it is the combination of many  APs from different regions of the heart that makes up the ECG  Its characteristic shape is widely recognized.  Any abnormality in the cardiovascular dynamics manifests itself as an arrhythmia in the ECG
  • 21.
  • 22.
  • 23.
    ECG • Amplitude: 1-5mV • Bandwidth: 0.05-100 Hz • Largest measurement error sources: – Motion artifacts – 50/60 Hz powerline interference • Typical applications: – Diagnosis of ischemia – Arrhythmia – Conduction defects
  • 25.
    The Electroencephalogram EEG • Measuresthe brain’s electric activity from the scalp • Measured signal results from the activity of billions of neurons • Amplitude:0.001-0.01 Mv • Bandwidth:0.5-40 Hz • Errors: – Thermal RF noise – 50/60 Hz power lines – Blink artifacts and similar • Typical applications: – Sleep studies – Seizure detection – Cortical mapping
  • 26.
    EEG: Electrode Recording System •EEG recording is done using a standard lead system called 10- 20 system
  • 28.
  • 29.
    The Electrooculogram EOG  TheEOG measures the resting potential of the retina. Unlike ERG it is not recorded in response to a stimulus. The EOG is often used in recording the eye-movements
  • 30.
    Electrooculography (EOG) • Electricpotentials are created as a result of the movement of the eyeballs • Potential varies in proportion to the amplitude of the movement • In many ways a challenging measurement with some clinical value • Amplitude: 0.01-0.1 mV • Bandwidth: DC-10 Hz
  • 31.
    • Primary sourcesof error include skin potential and motion • Applications: eye position, sleep state, vestibulo-ocular reflex
  • 32.
  • 33.
    The Event Related Potentials- ERPs  ERPs are really EEGs obtained under a specific protocol that requires the patient to response to certain stimuli – hence event related potentials.  Also called evoked potentials these signals can be used to diagnose certain neurological disorders.  they can also be used as a lie detector
  • 34.
    Electroretinogram ERG  The ERGis the record of the retinal action currents produced by the retina in response to a light stimulus. It measures the electrical responses of the light-sensitive cells (such as rods and cones).  The stimuli are often a series of light flashes or rotating patterns The ERG is recorded using contact lens electrode that the subject wears while watching the stimuli.
  • 35.
    Baseline drift dueto the changes in junction potential or motion artifacts Choice of electrodes Electromagnetic interference  Shielding ARTIFACT (Interference) Muscle signal interference  Placement
  • 36.