Download to read offline


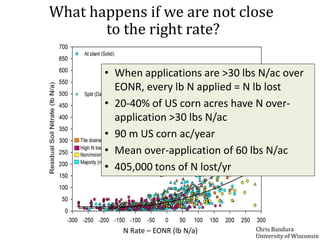
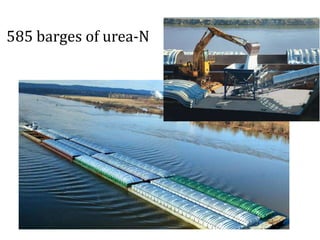
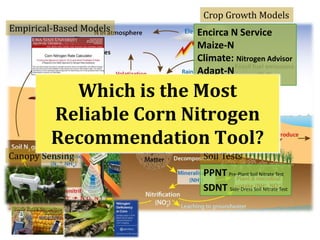
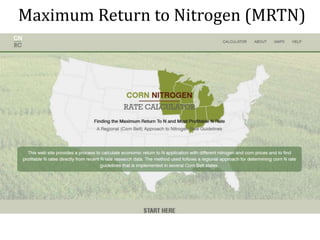
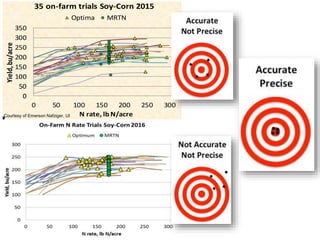
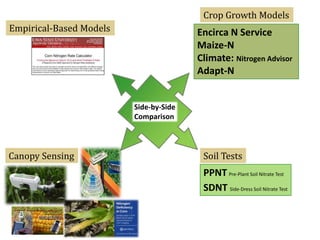

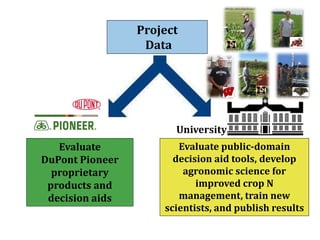
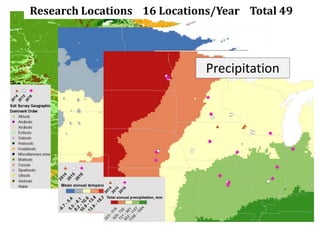
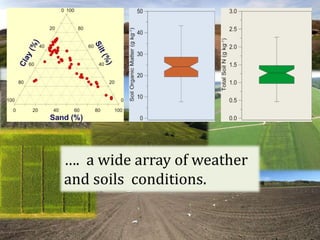
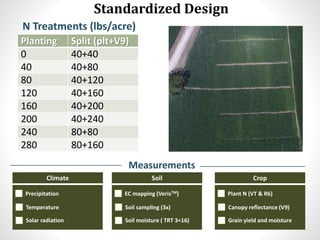
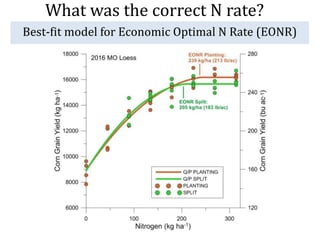
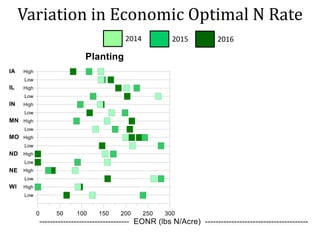
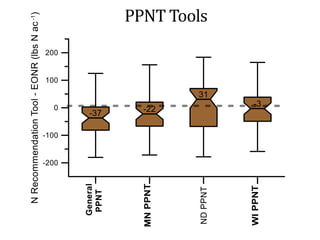
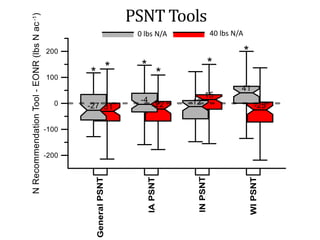
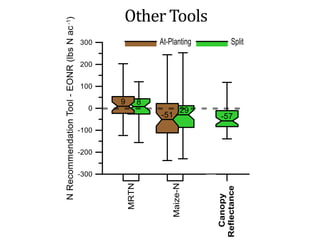
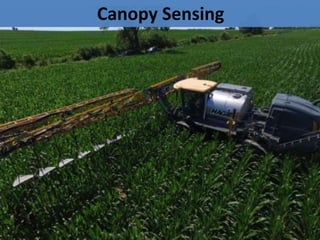
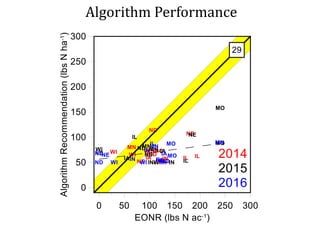
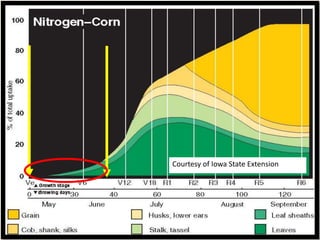
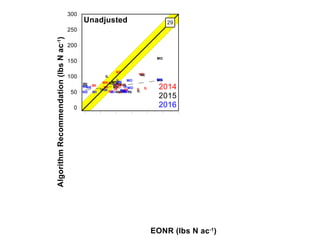
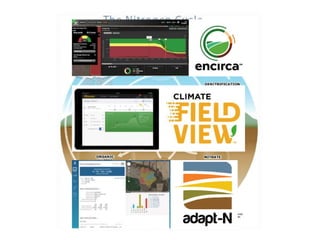
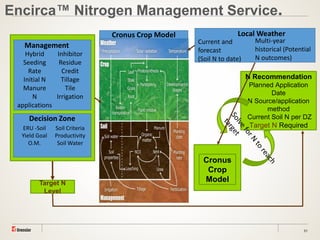
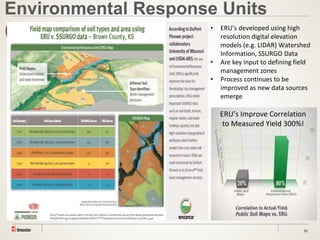


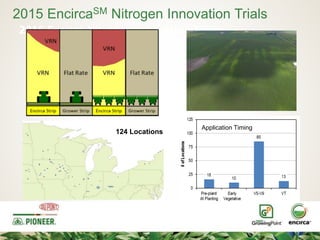
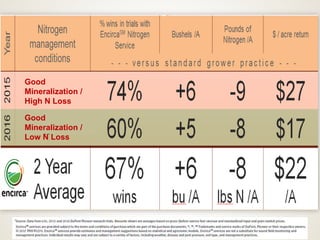
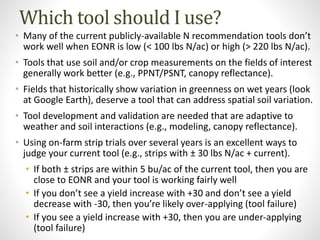
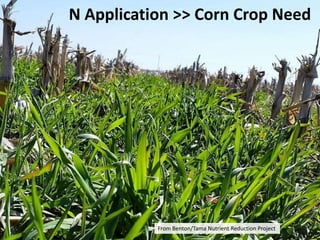

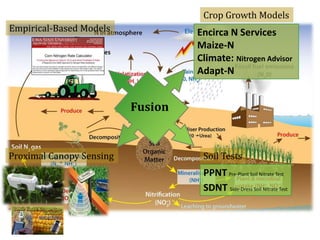


The document discusses the challenges of nitrogen management in corn production, highlighting the over-application of nitrogen fertilizers and the resulting losses. It evaluates various nitrogen recommendation tools, emphasizing the benefits of using soil and crop measurements for improved accuracy. Additionally, it underscores the importance of adaptive tool development that can address variability in weather and soil conditions for better decision-making in nitrogen applications.