Download to read offline

![The Electromagnetic Spectrum
MIR – 2500-25000 nm
*
𝜹 −
𝜹 +
𝜹 +
**
MIR radiation is
partially absorbed
by soil constituents
* By Lookang. Many thanks to Fu-Kwun Hwang and author of Easy Java Simulation = Francisco Esquembre (Own work)
[CC BY-SA 3.0 (https://creativecommons.org/licenses/by-sa/3.0)], via Wikimedia Commons
** Courtesy of gfycat.com
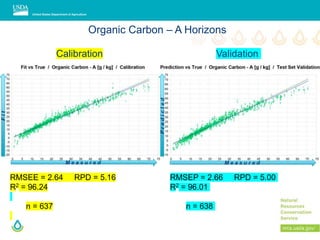
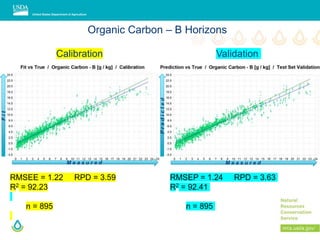
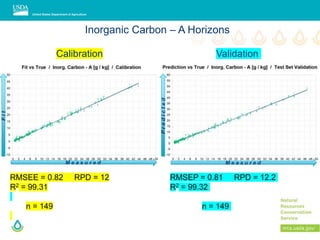
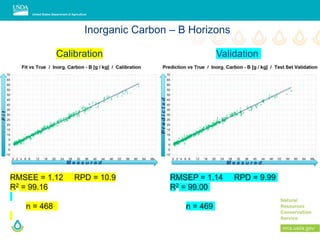
Calibration models are being developed to
predict soil organic carbon from MIR spectra](https://image.slidesharecdn.com/fergusonglosolansssaspectrometry-191123094202/85/Ferguson-glosolan-spectrometry-4-320.jpg)
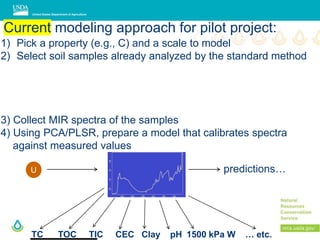
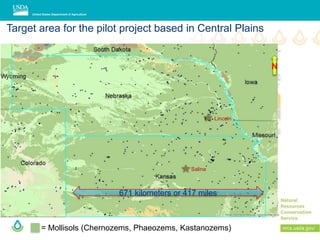
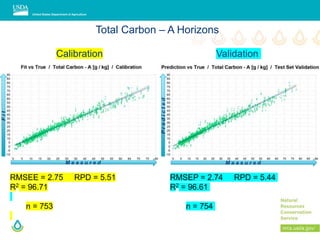
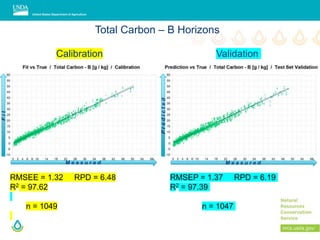
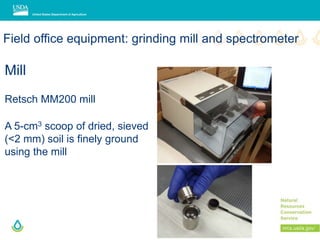
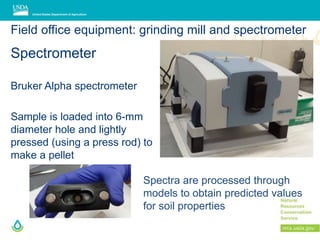
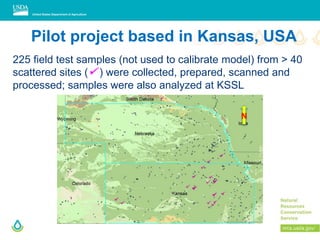
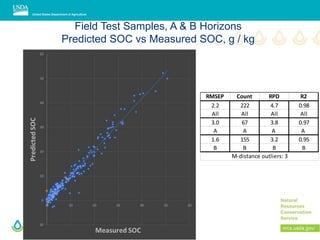
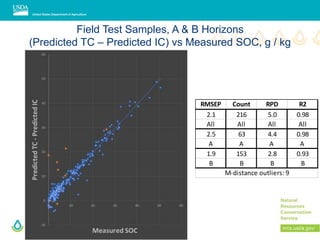
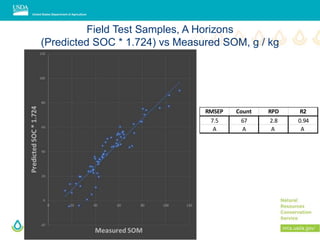

This document outlines a preliminary research presentation on using mid-infrared (MIR) spectrometry to predict soil organic carbon and soil organic matter for the USDA soil survey program. It details the methodology, calibration models, and pilot project based in Kansas involving over 225 field test samples. The findings indicate high predictive accuracy for soil properties, with ongoing research and data available upon request.


