Download to read offline


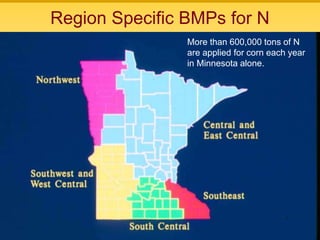


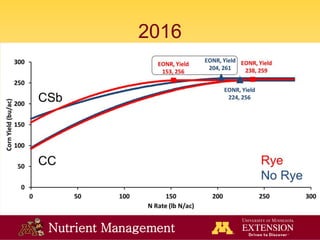
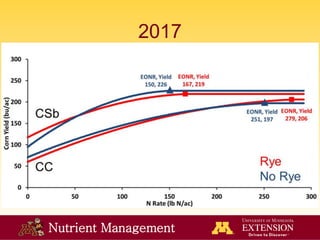
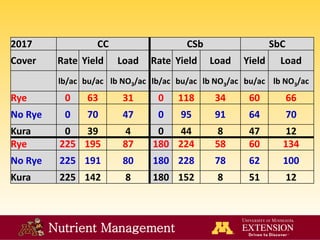
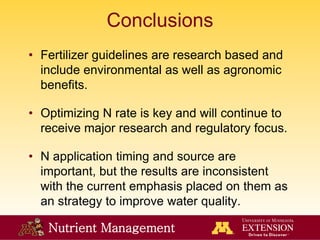


This document summarizes a presentation on land-grant university nutrient management guidelines and whether crop production and environmental quality goals can be met. The presentation discusses the need for nutrient guidelines to be science-based, transparent, local, and updated over time. It provides examples of nutrient rate, source, and application timing research for corn production in Minnesota. While 4R nutrient stewardship practices are moving in the right direction, the presenter argues they are not sufficient on their own to fully meet nitrogen loss reduction goals and that engineering solutions and shifting away from annual cropping systems may also be needed.


