Download as PDF, PPTX


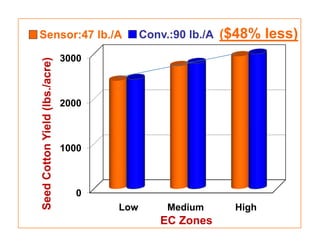

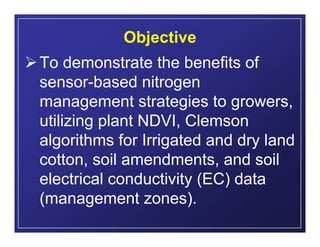


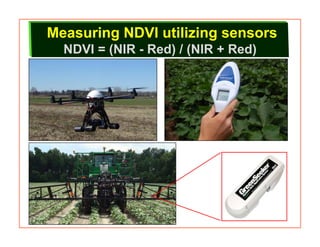

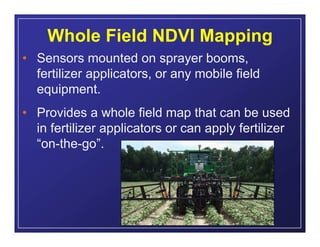

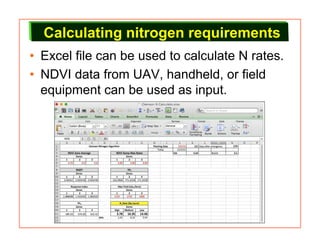


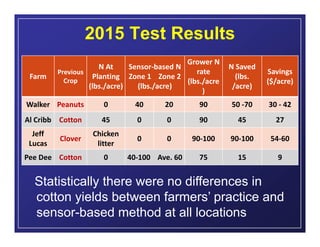


Sensor-based nitrogen management techniques can help reduce nitrogen usage and costs for cotton farmers. The document outlines a study in Coastal Plain soils that found sensor-based methods reduced nitrogen application by 15-100 lbs/acre for cotton compared to farmer practices, saving $9-60/acre. Soil electrical conductivity mapping and plant nitrogen rich strips were used to identify management zones. Mid-season plant NDVI readings from sensors were calculated in an algorithm to determine variable-rate nitrogen applications, accounting for soil amendments and previous crops. Results showed no yield differences between farmer practices and sensor methods, indicating potential for sensor technology to cut nitrogen costs for cotton growers.


