Download to read offline
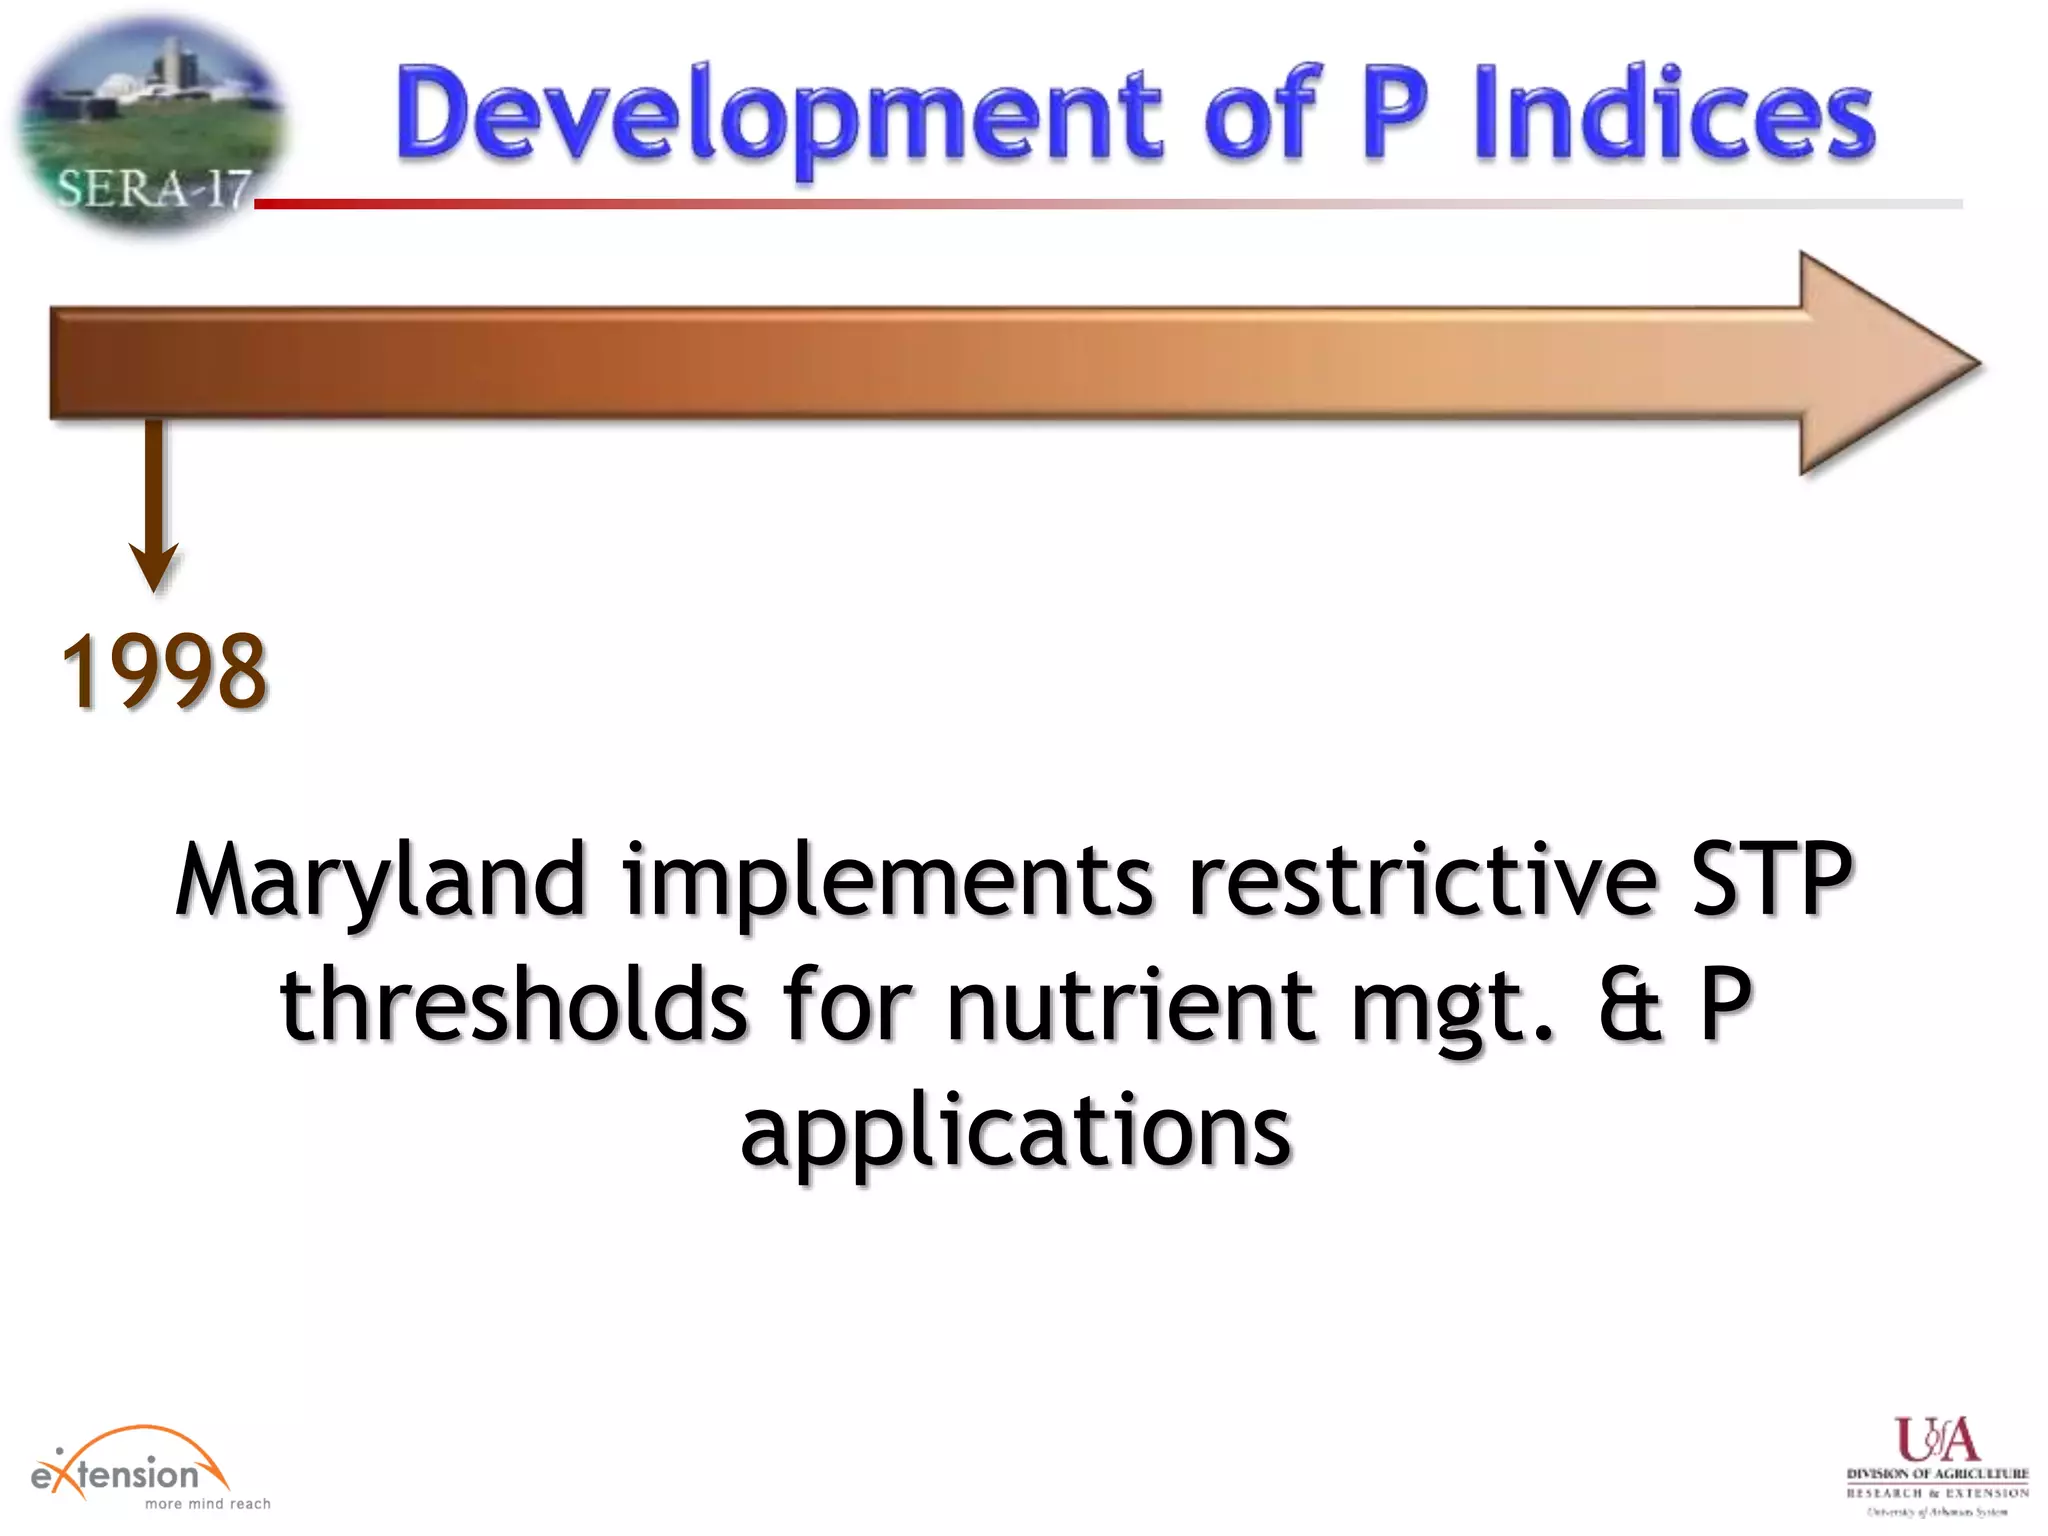
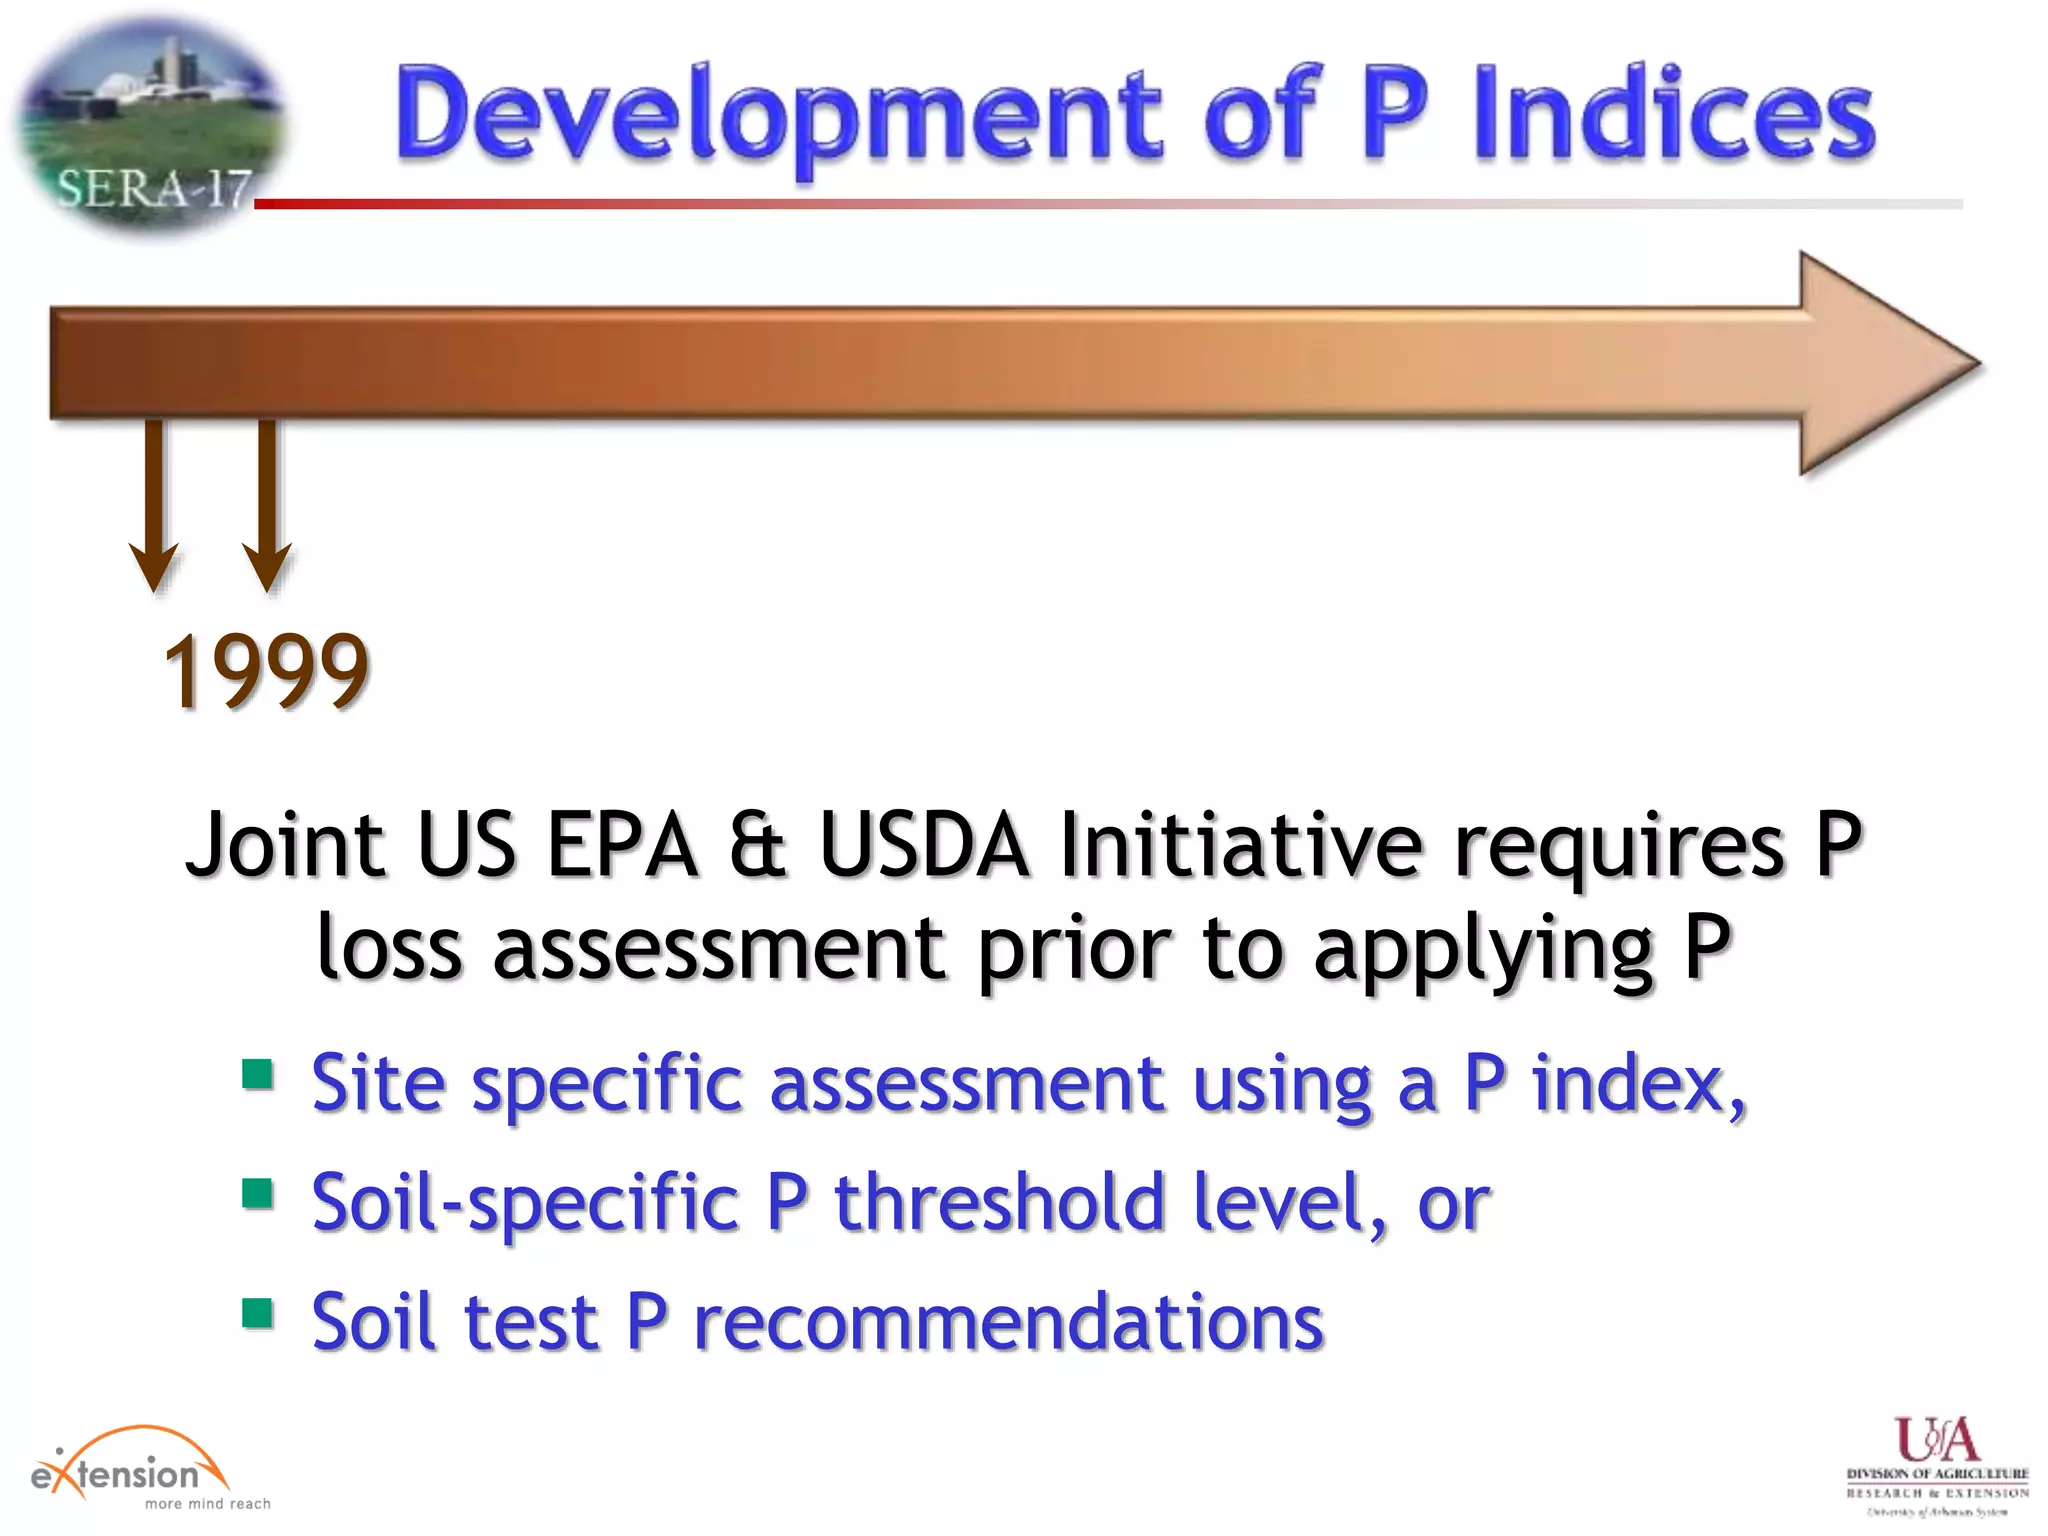
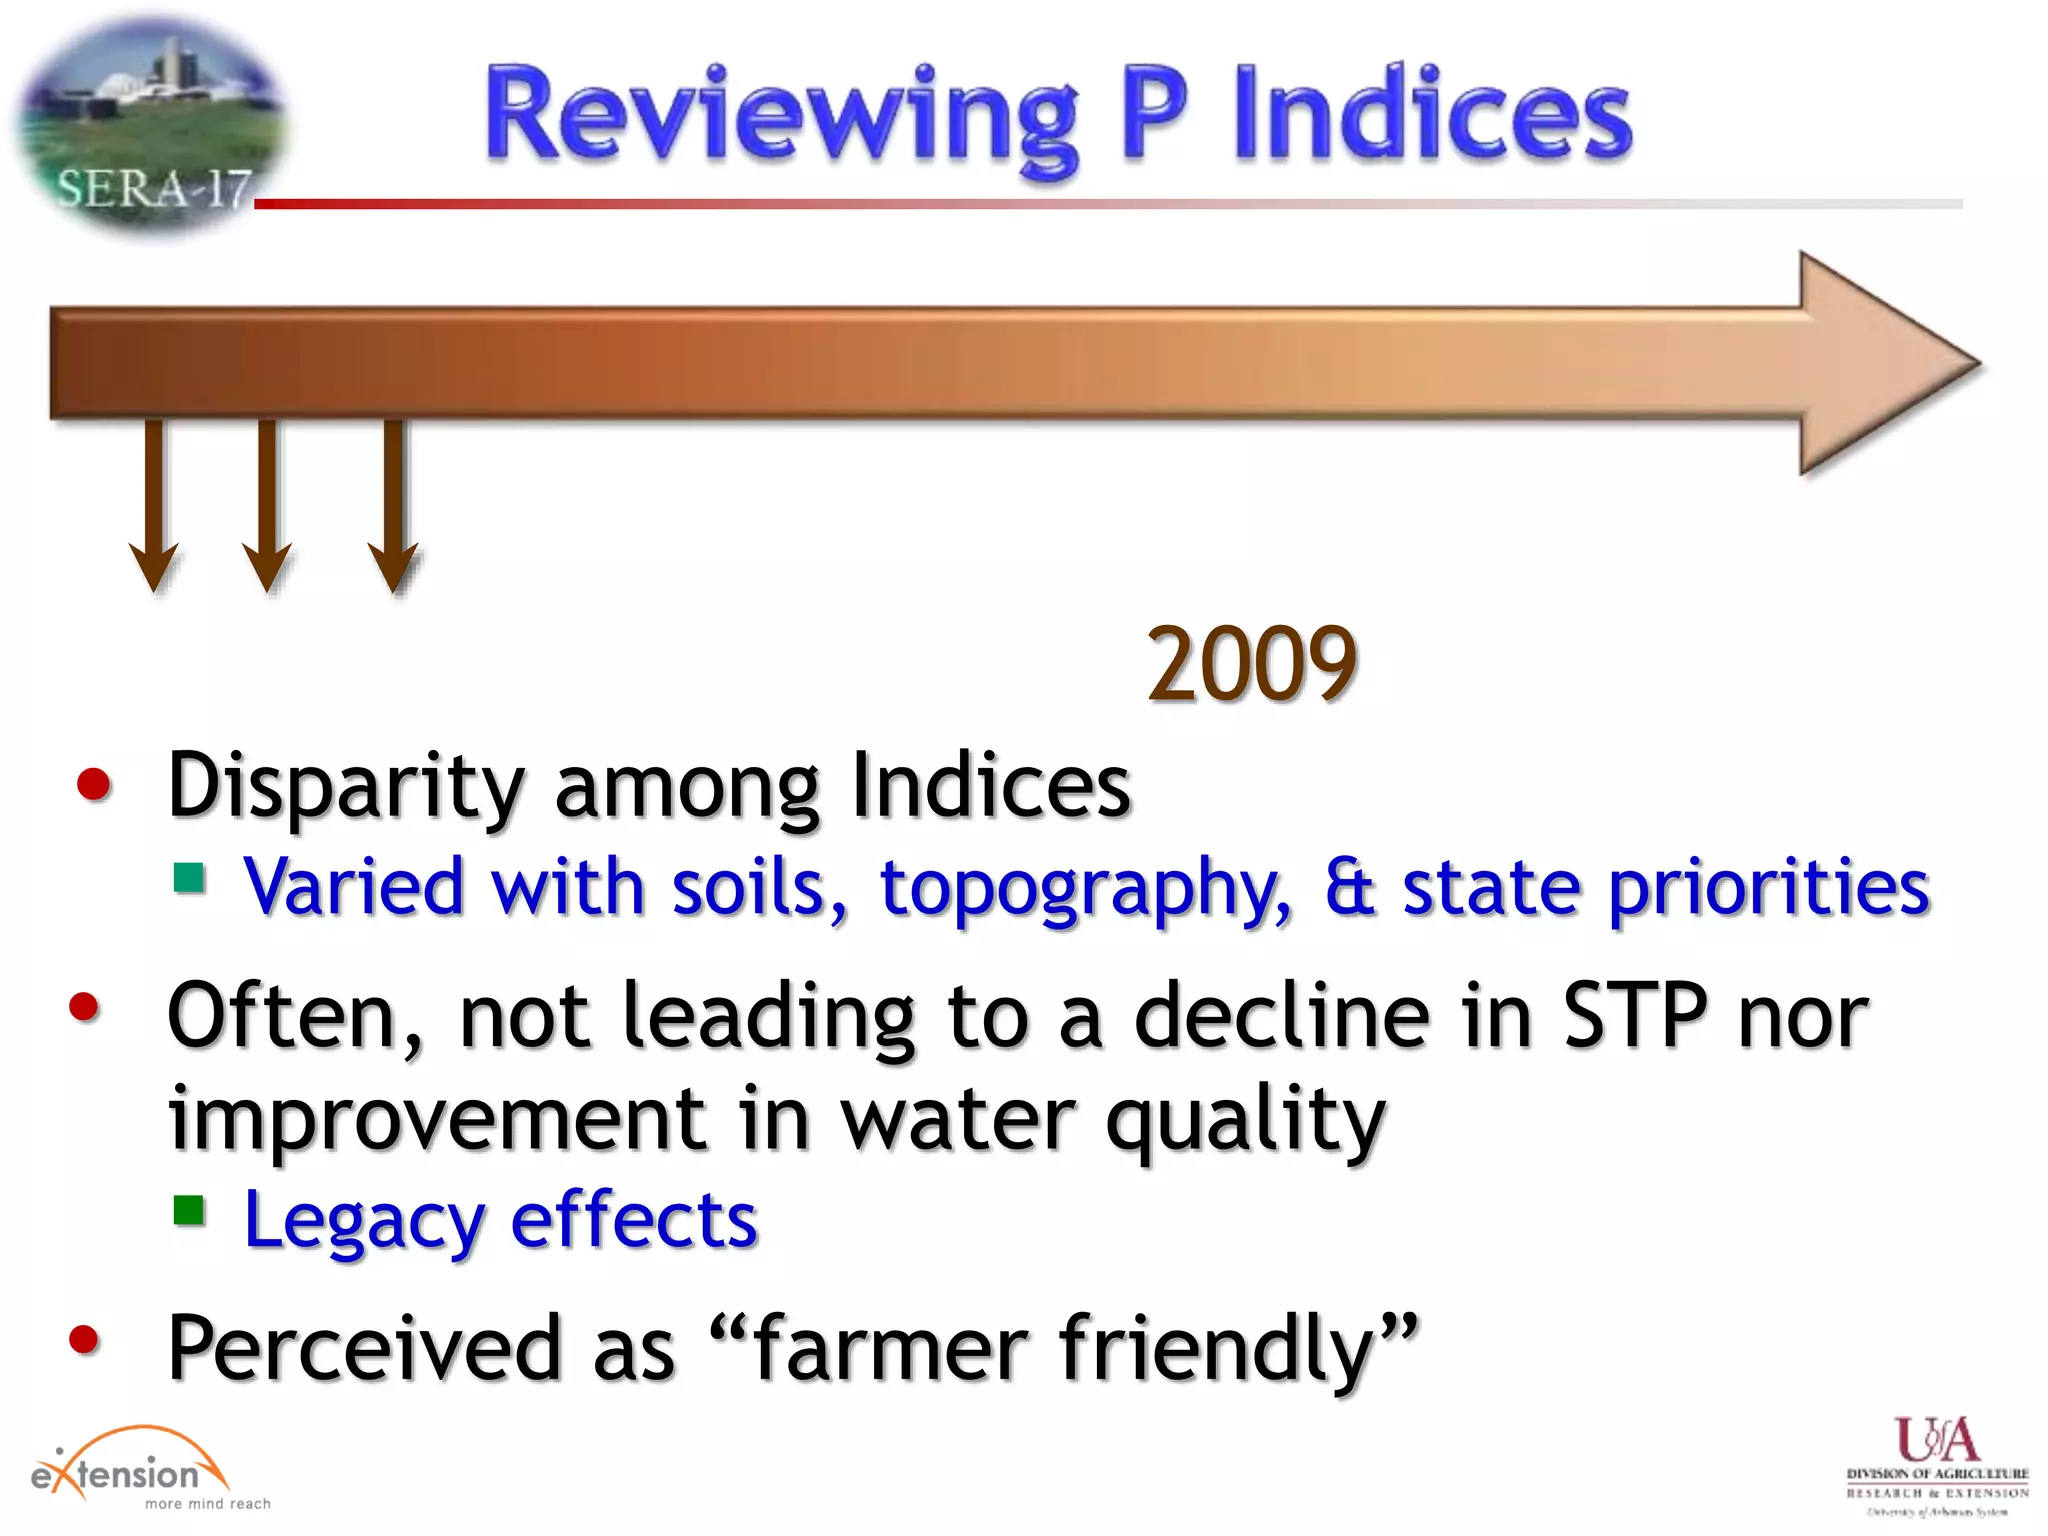
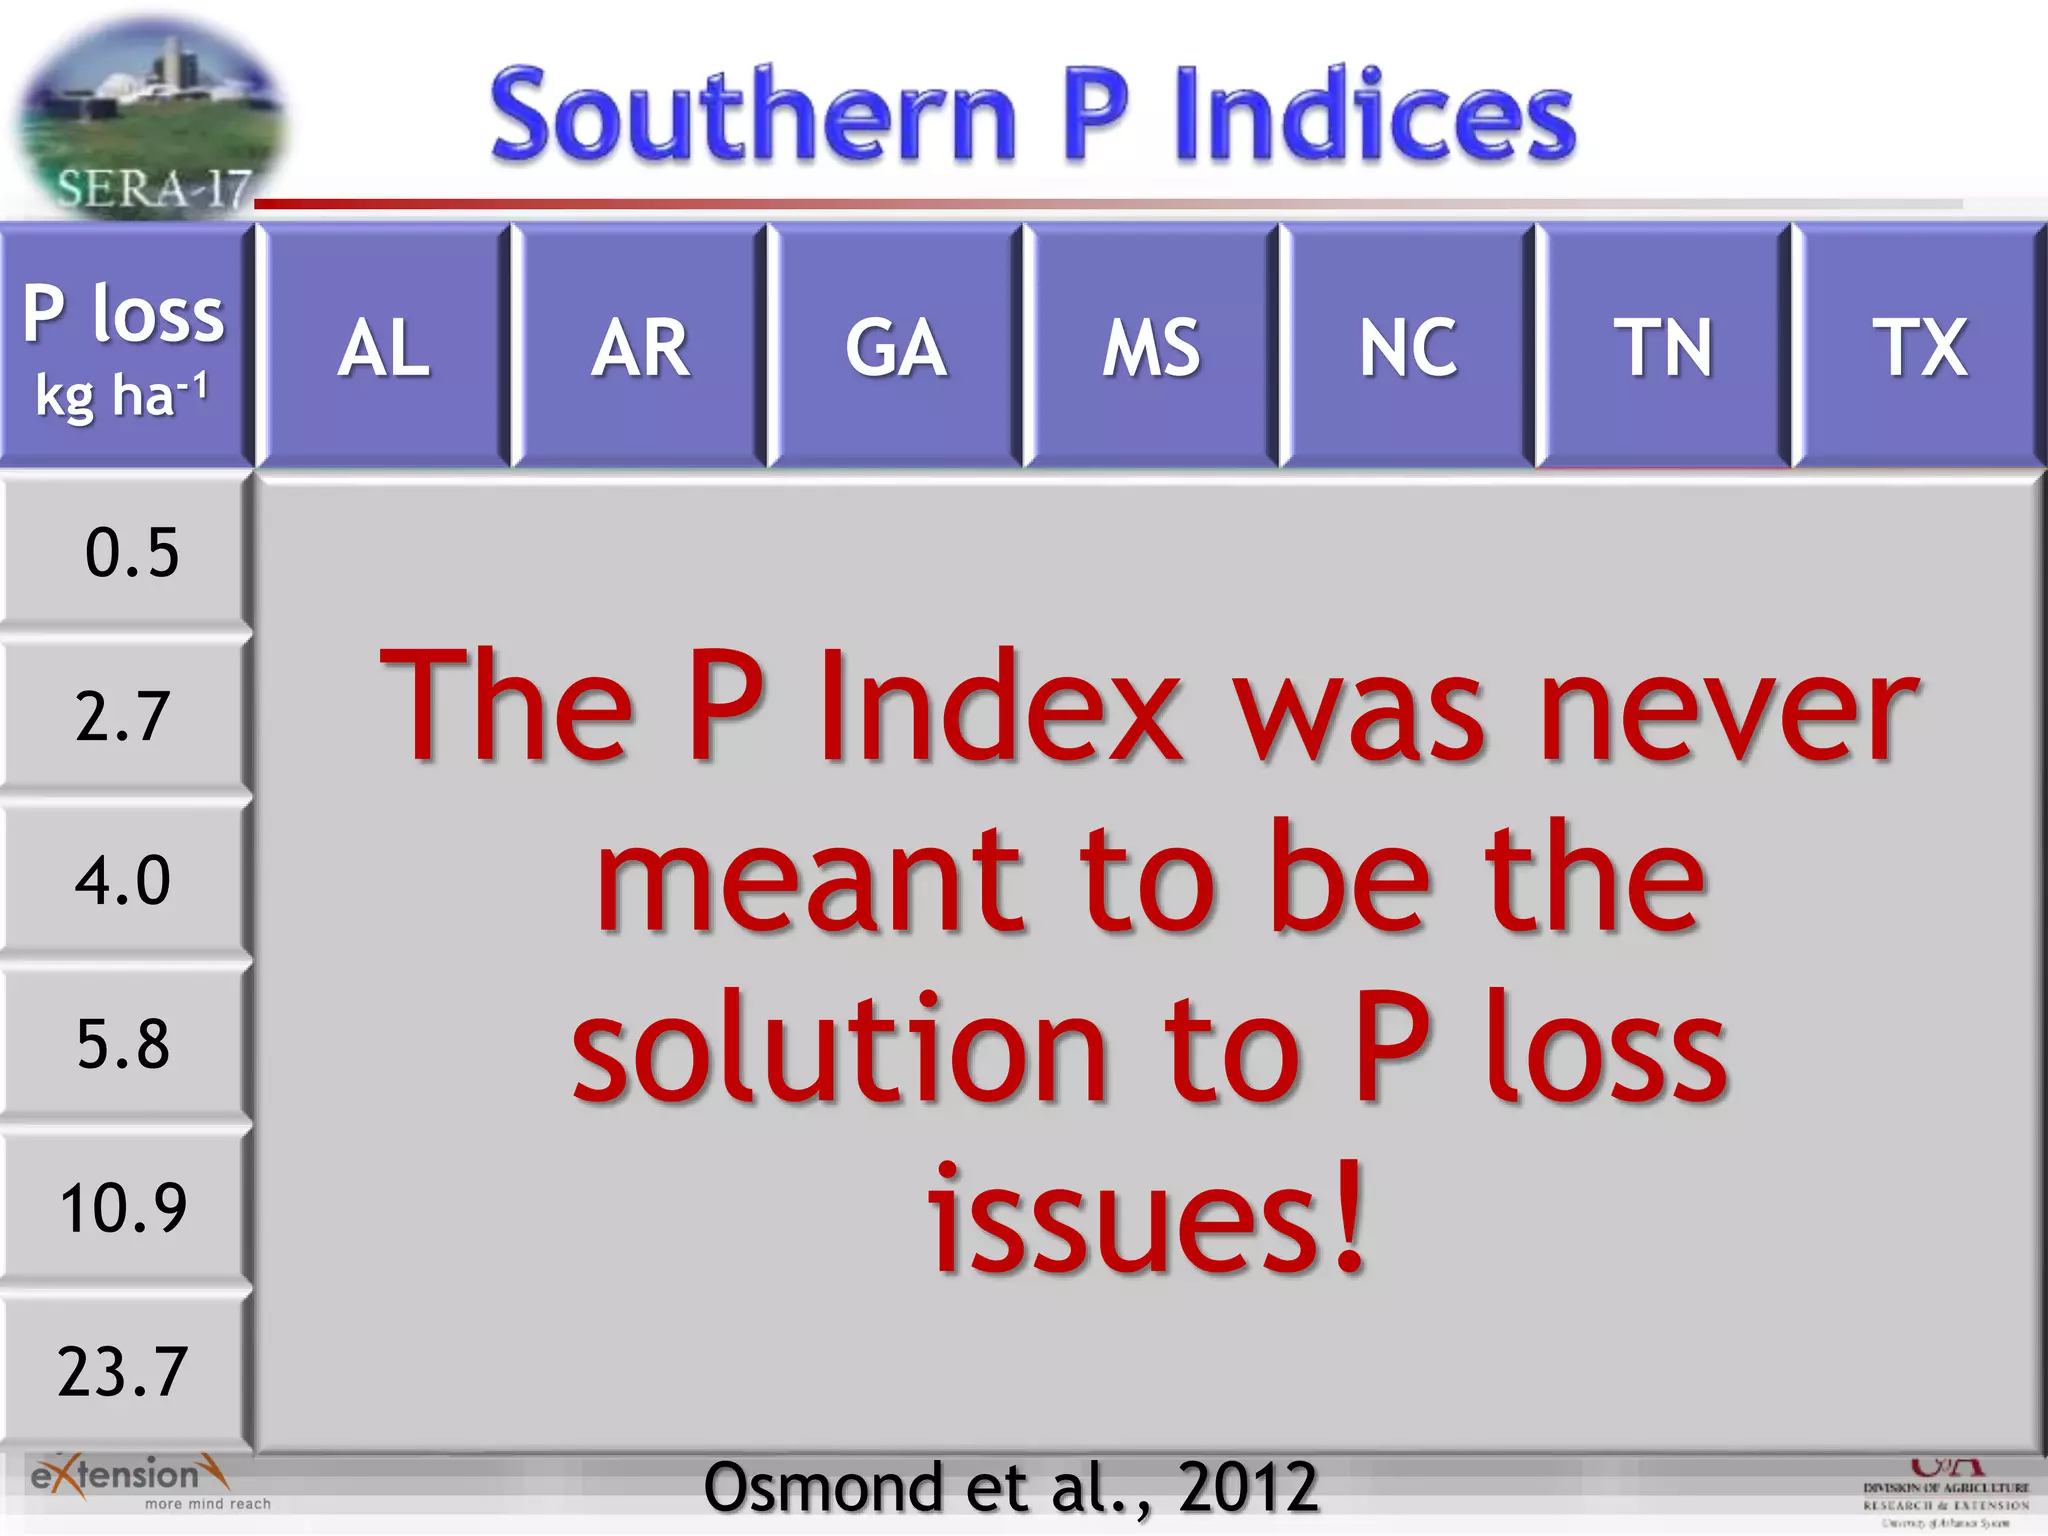
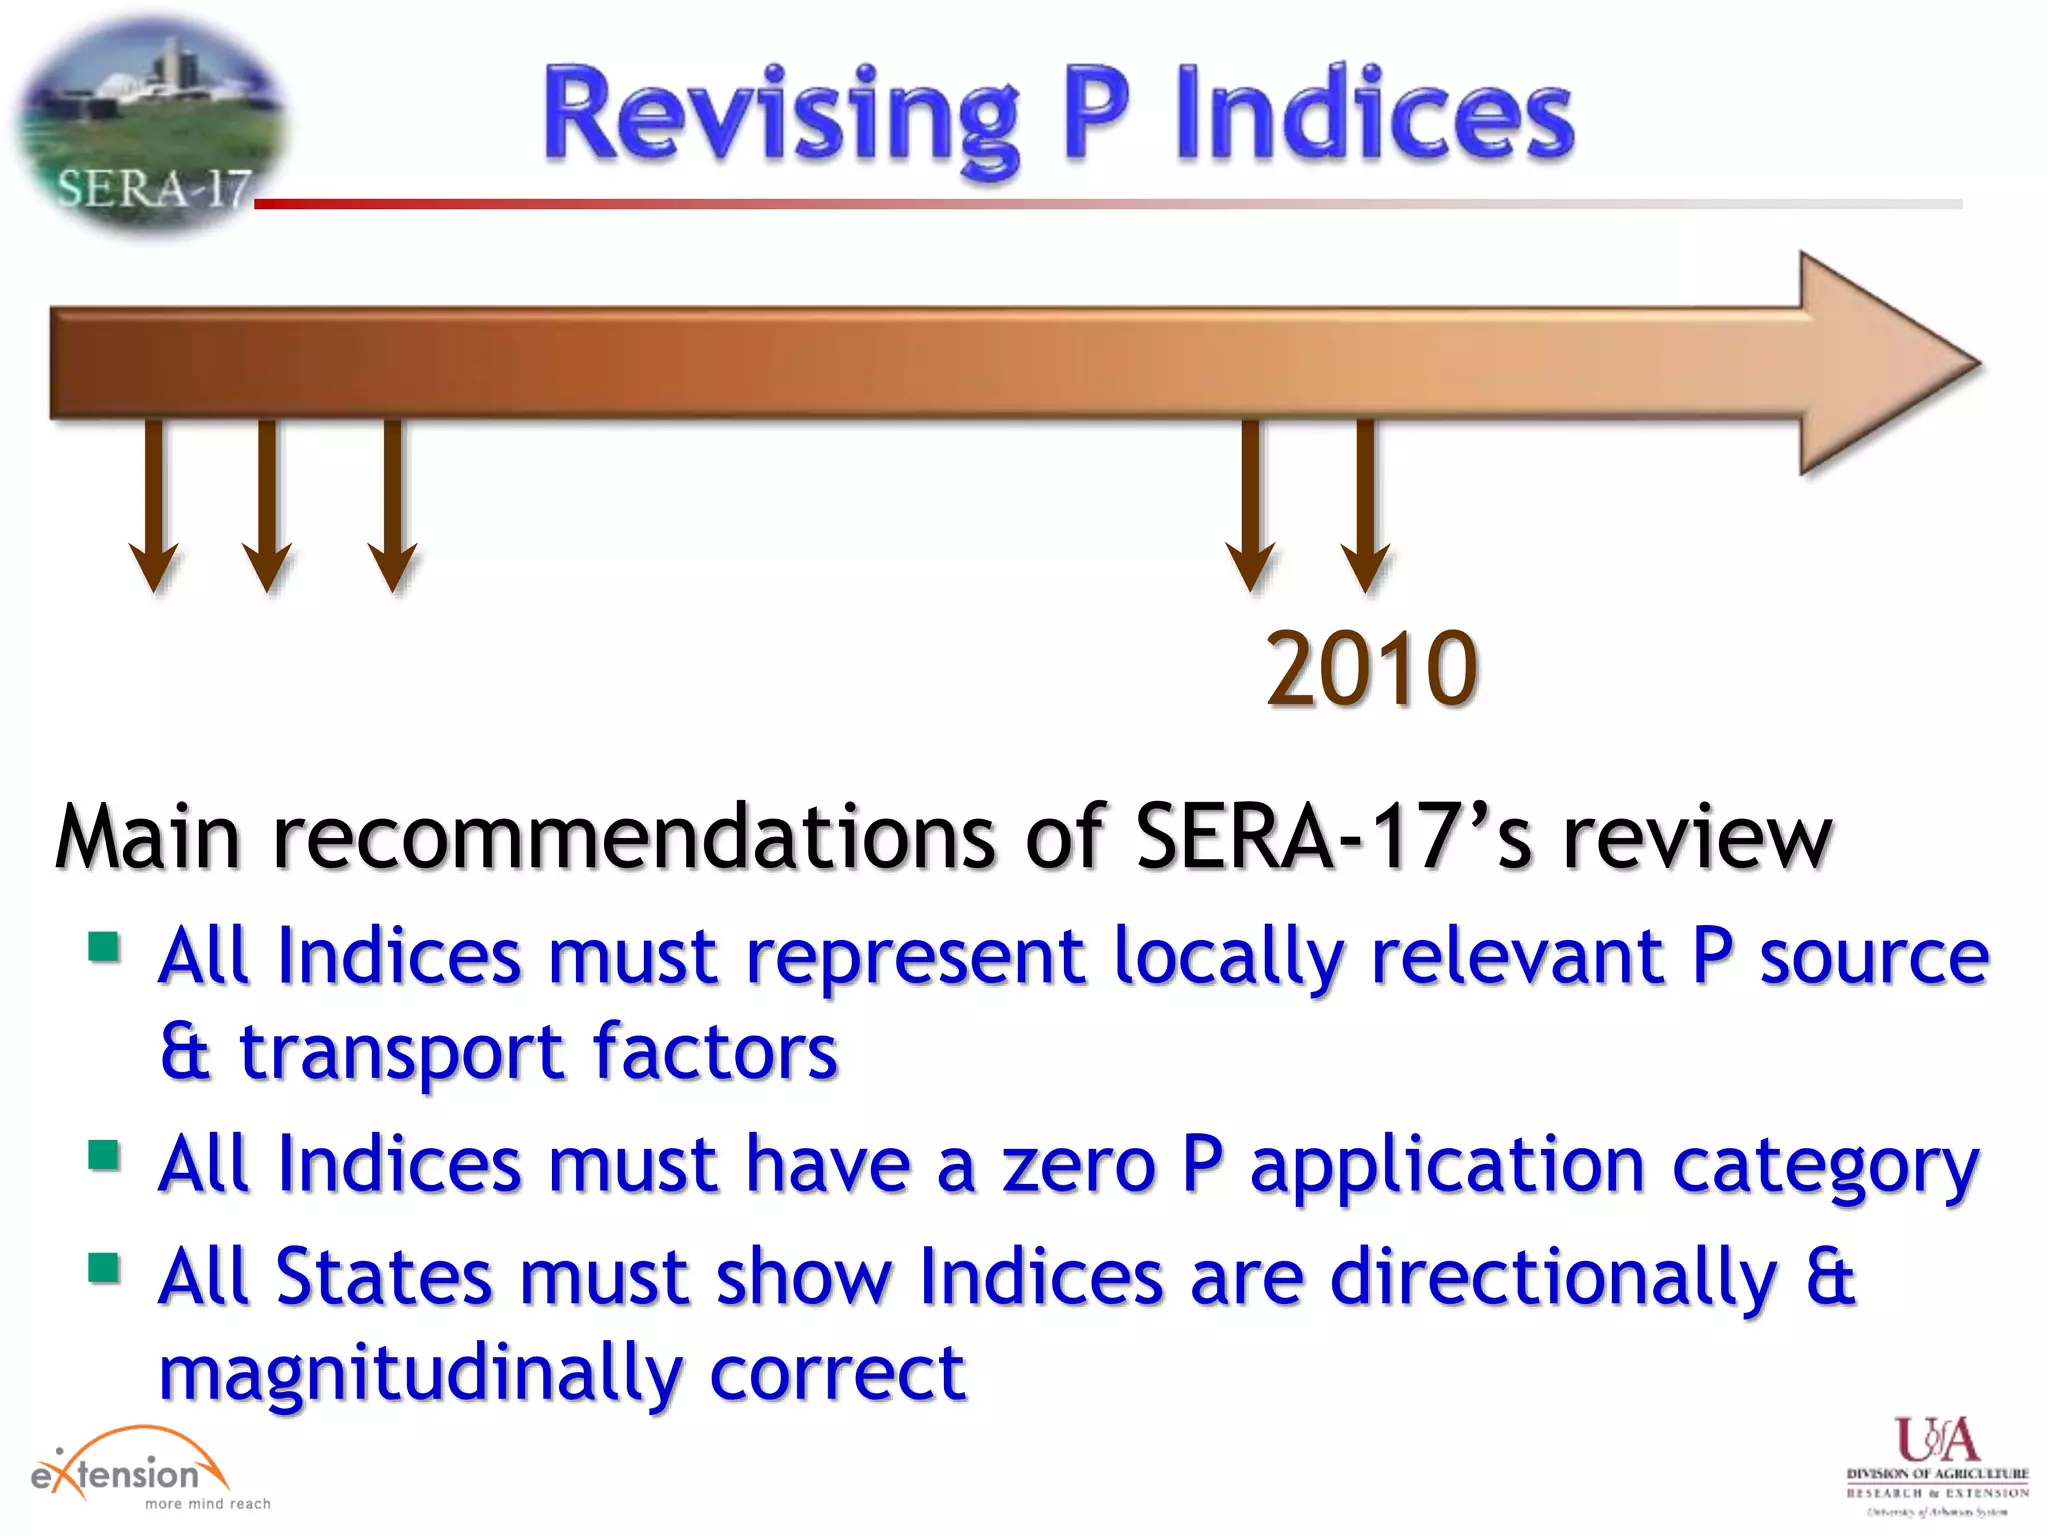
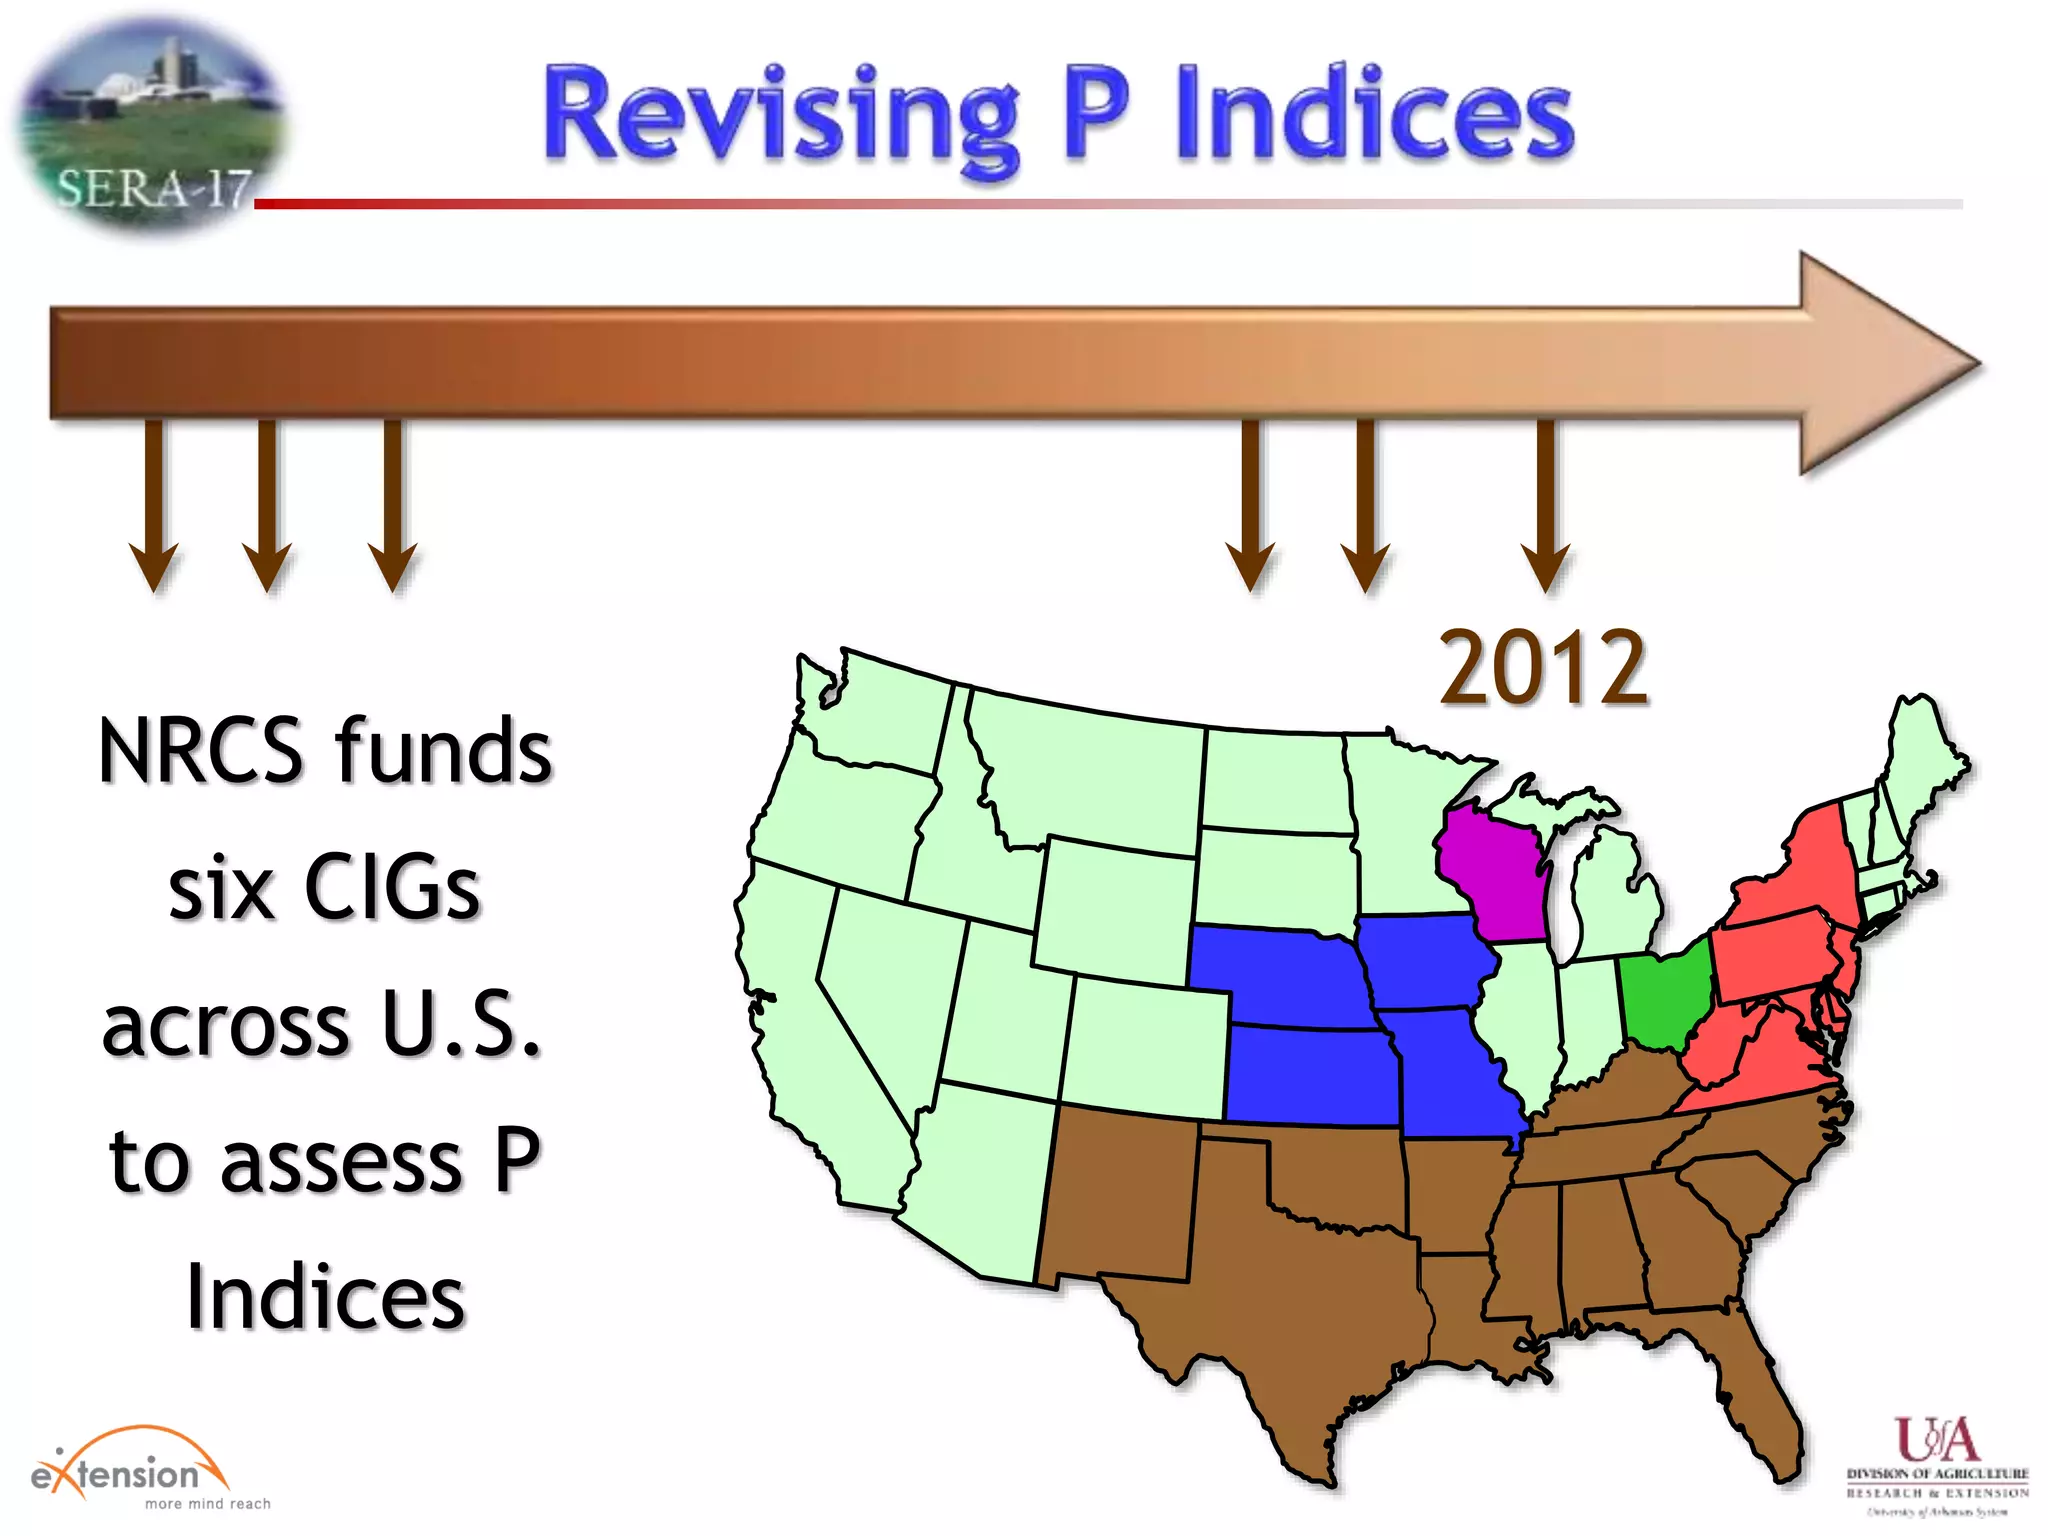
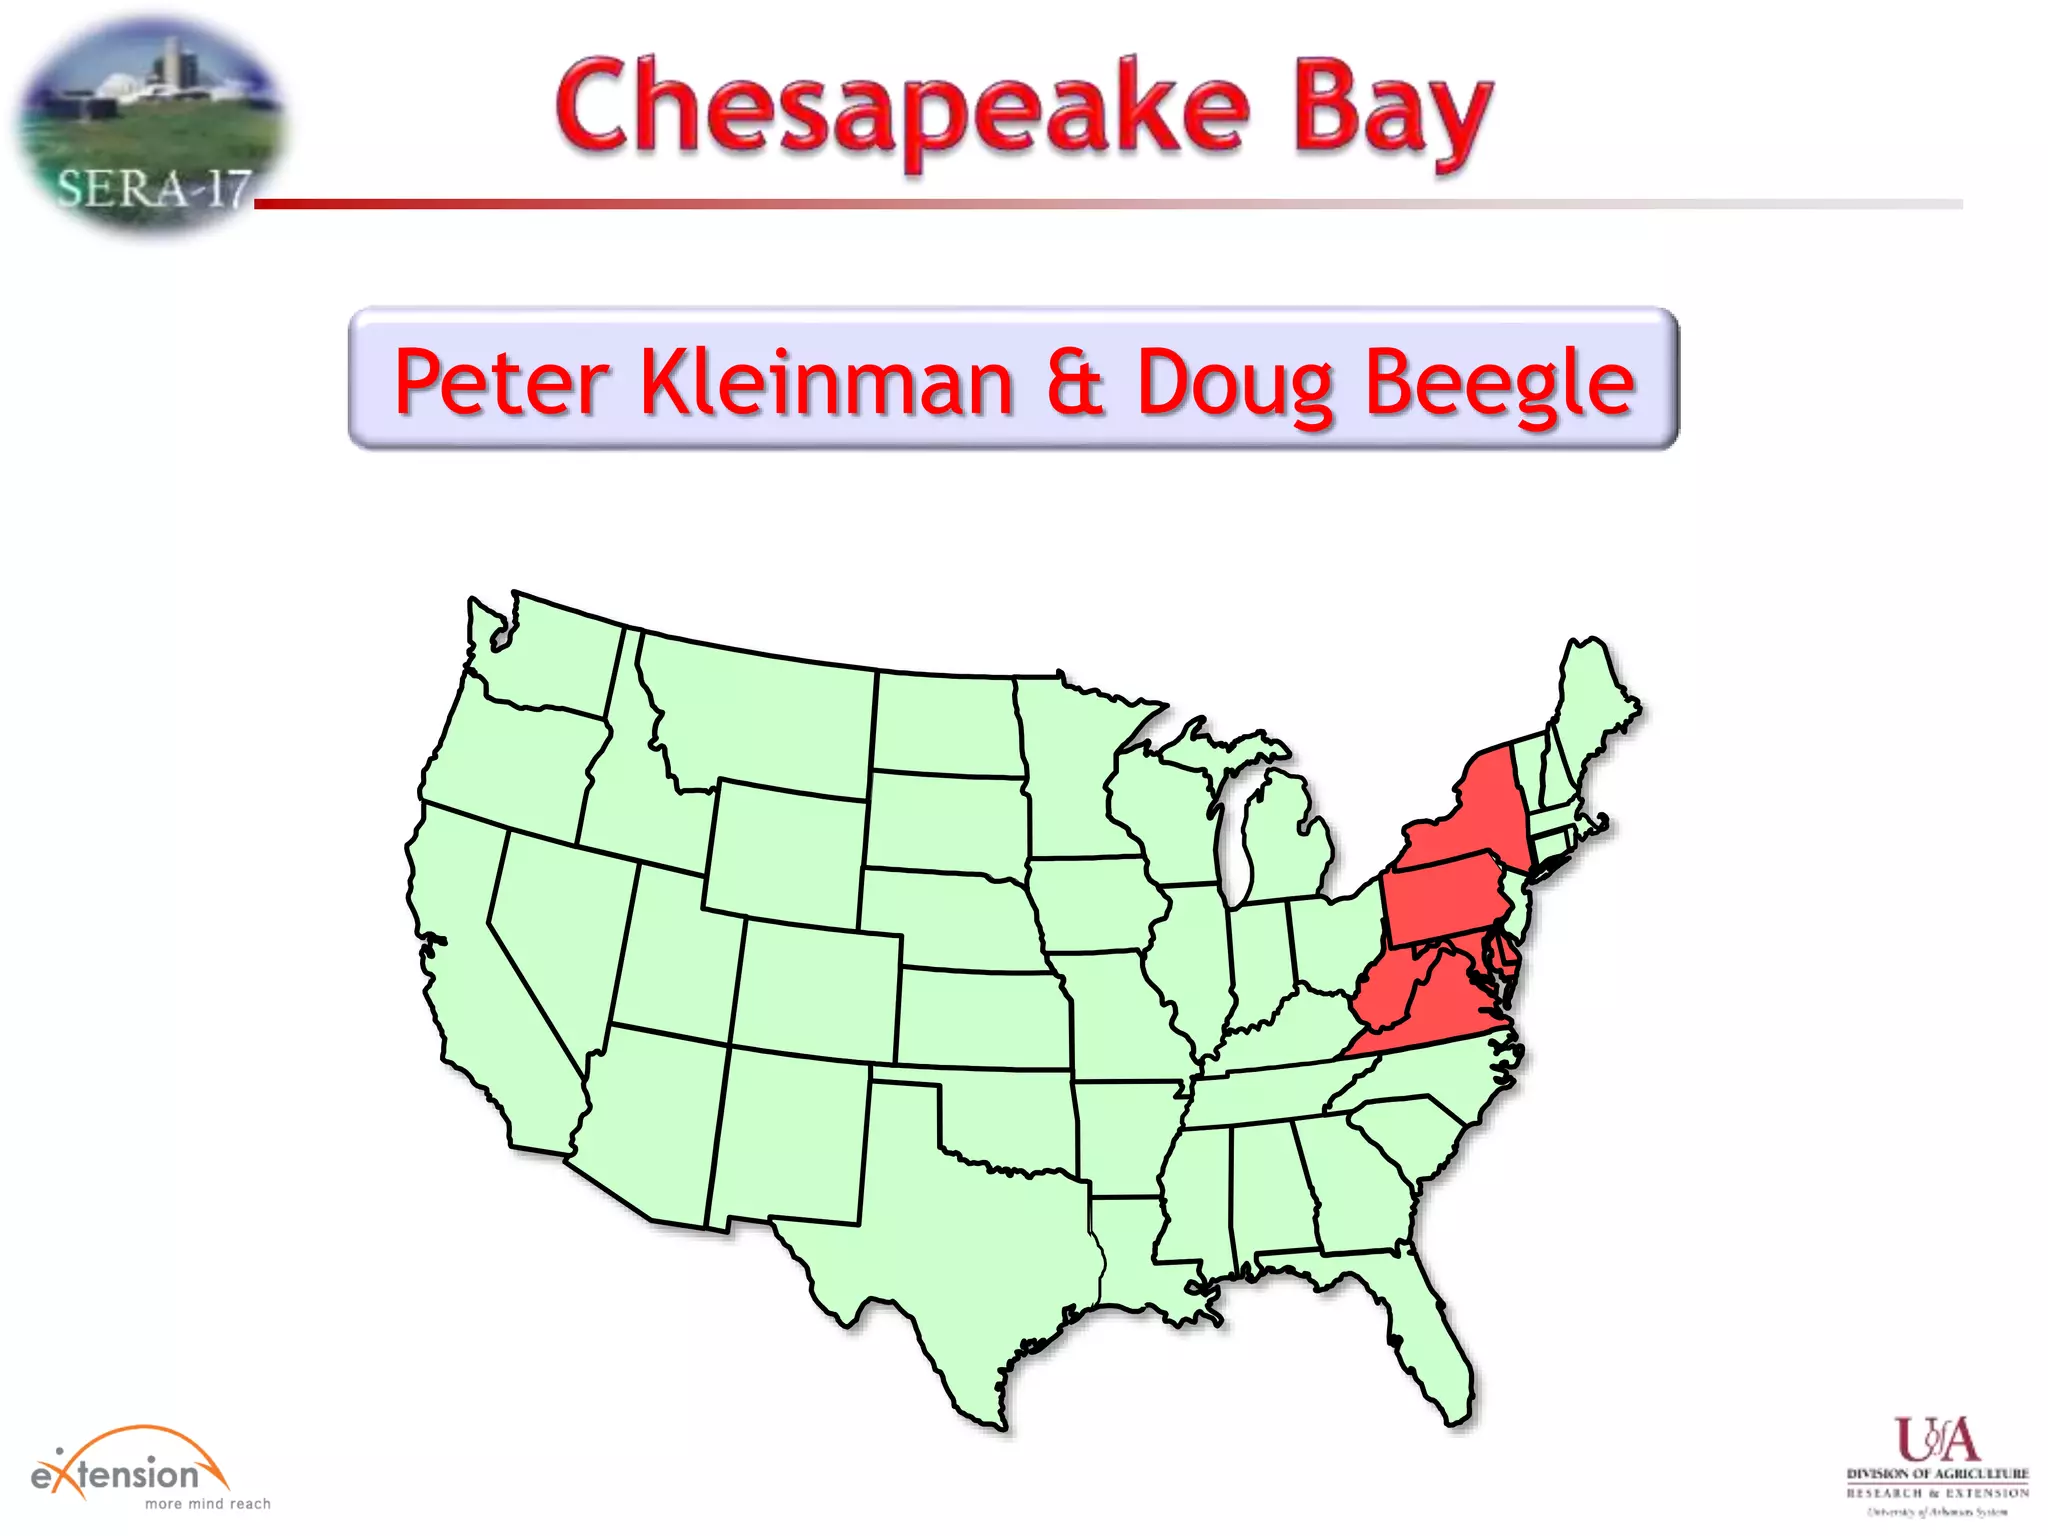
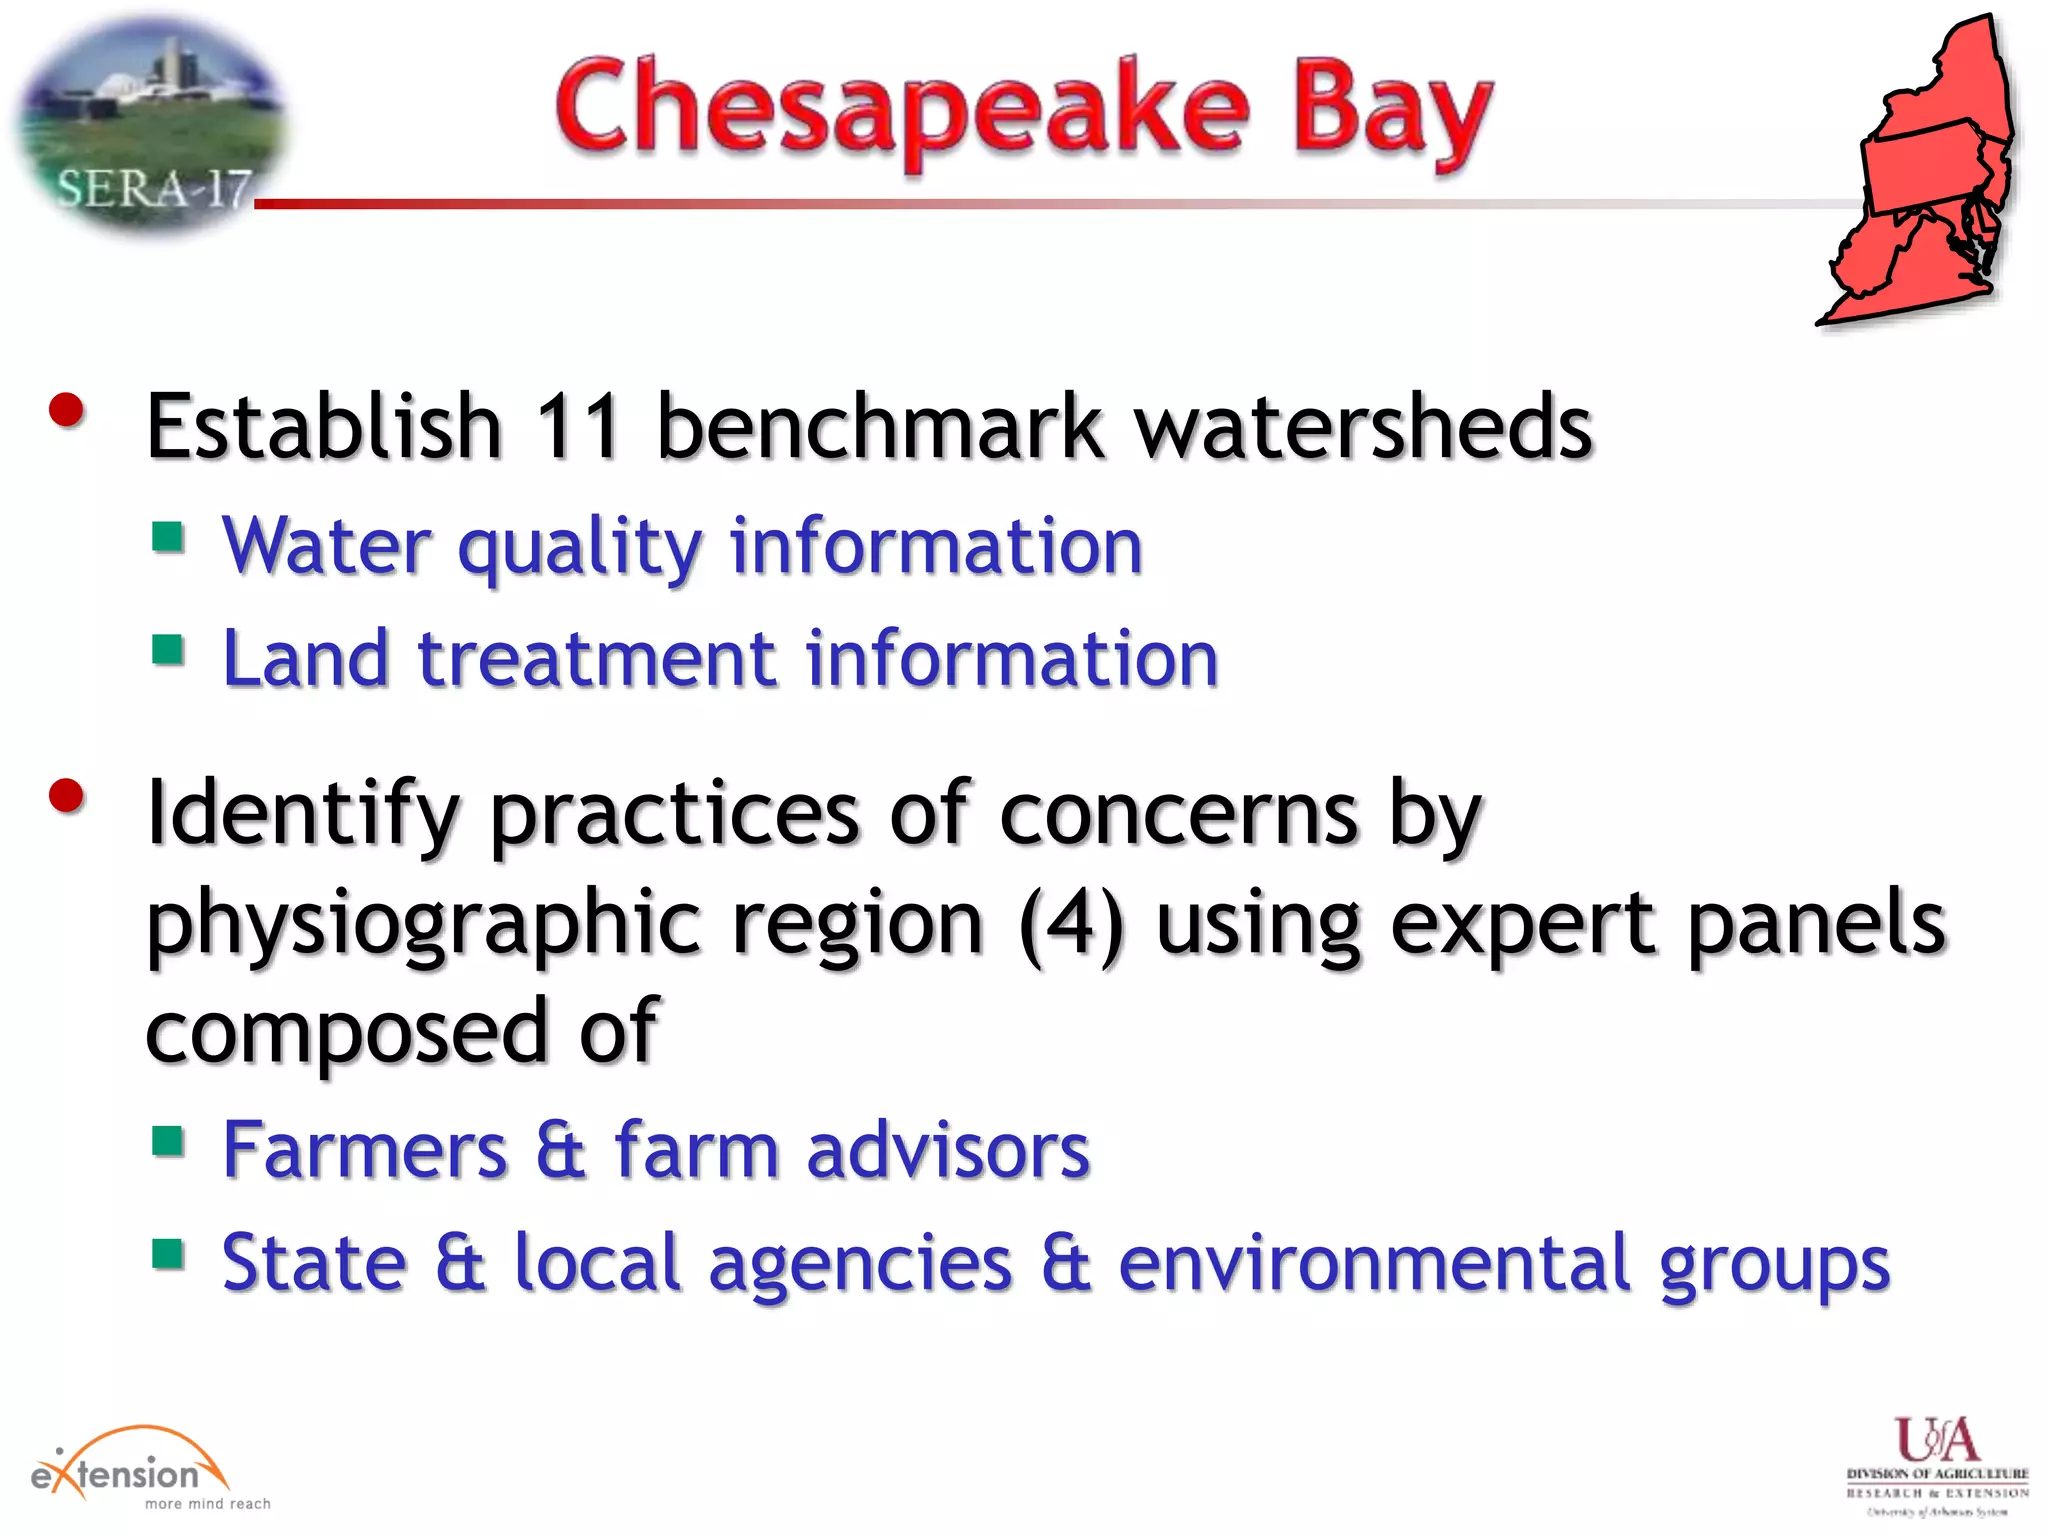
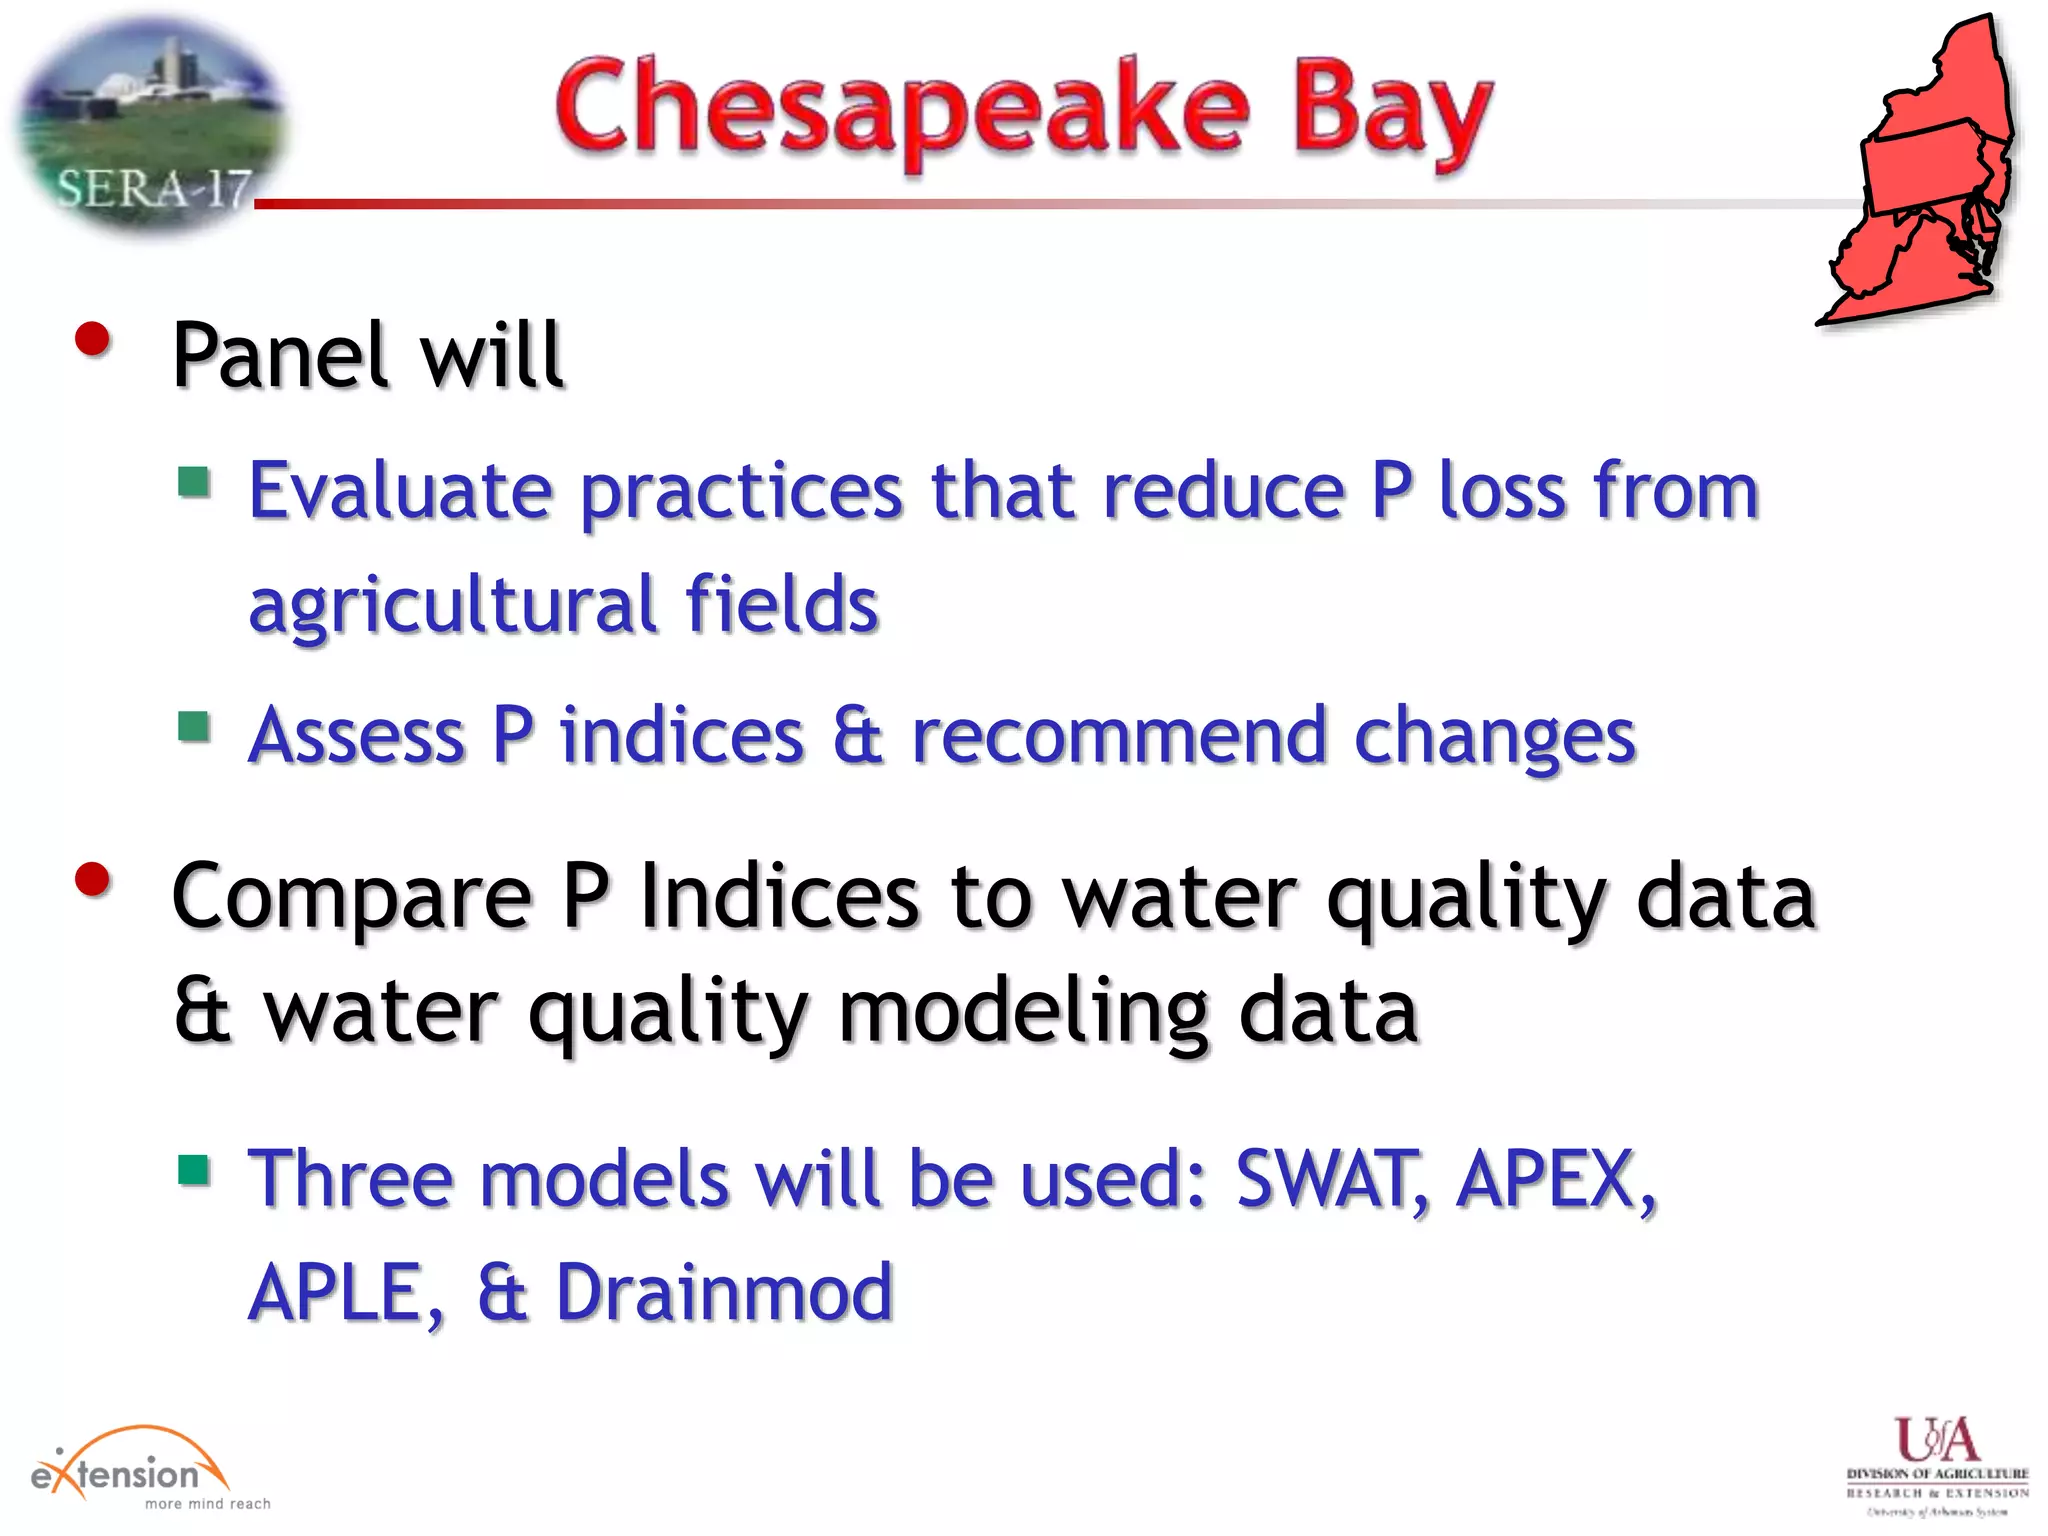
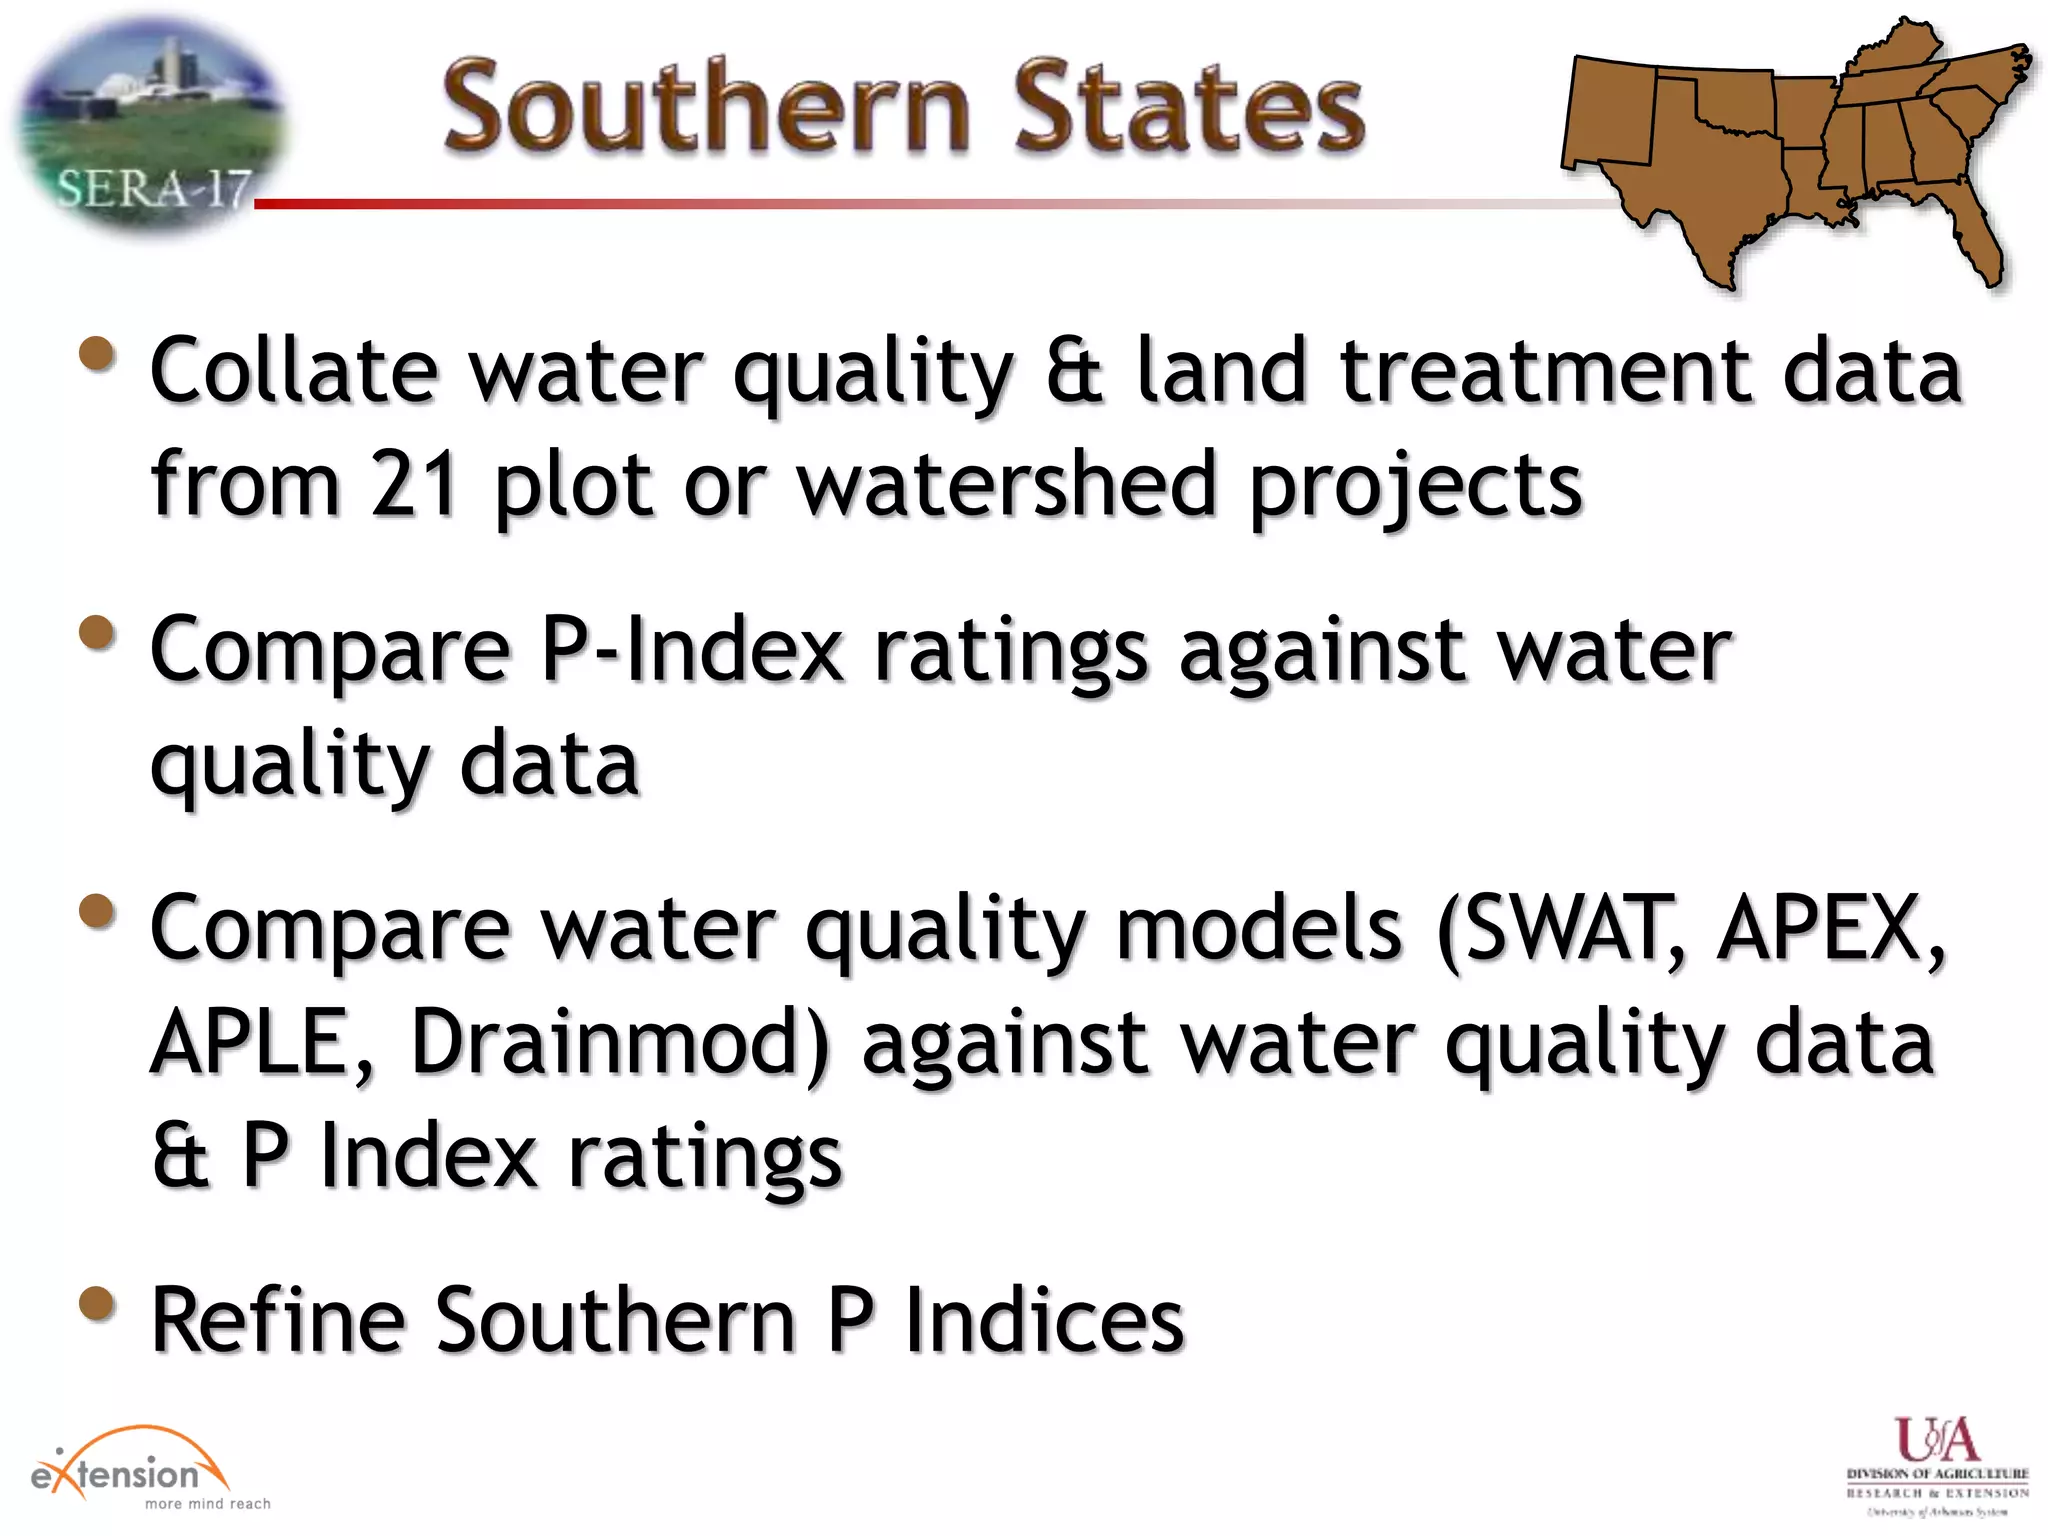

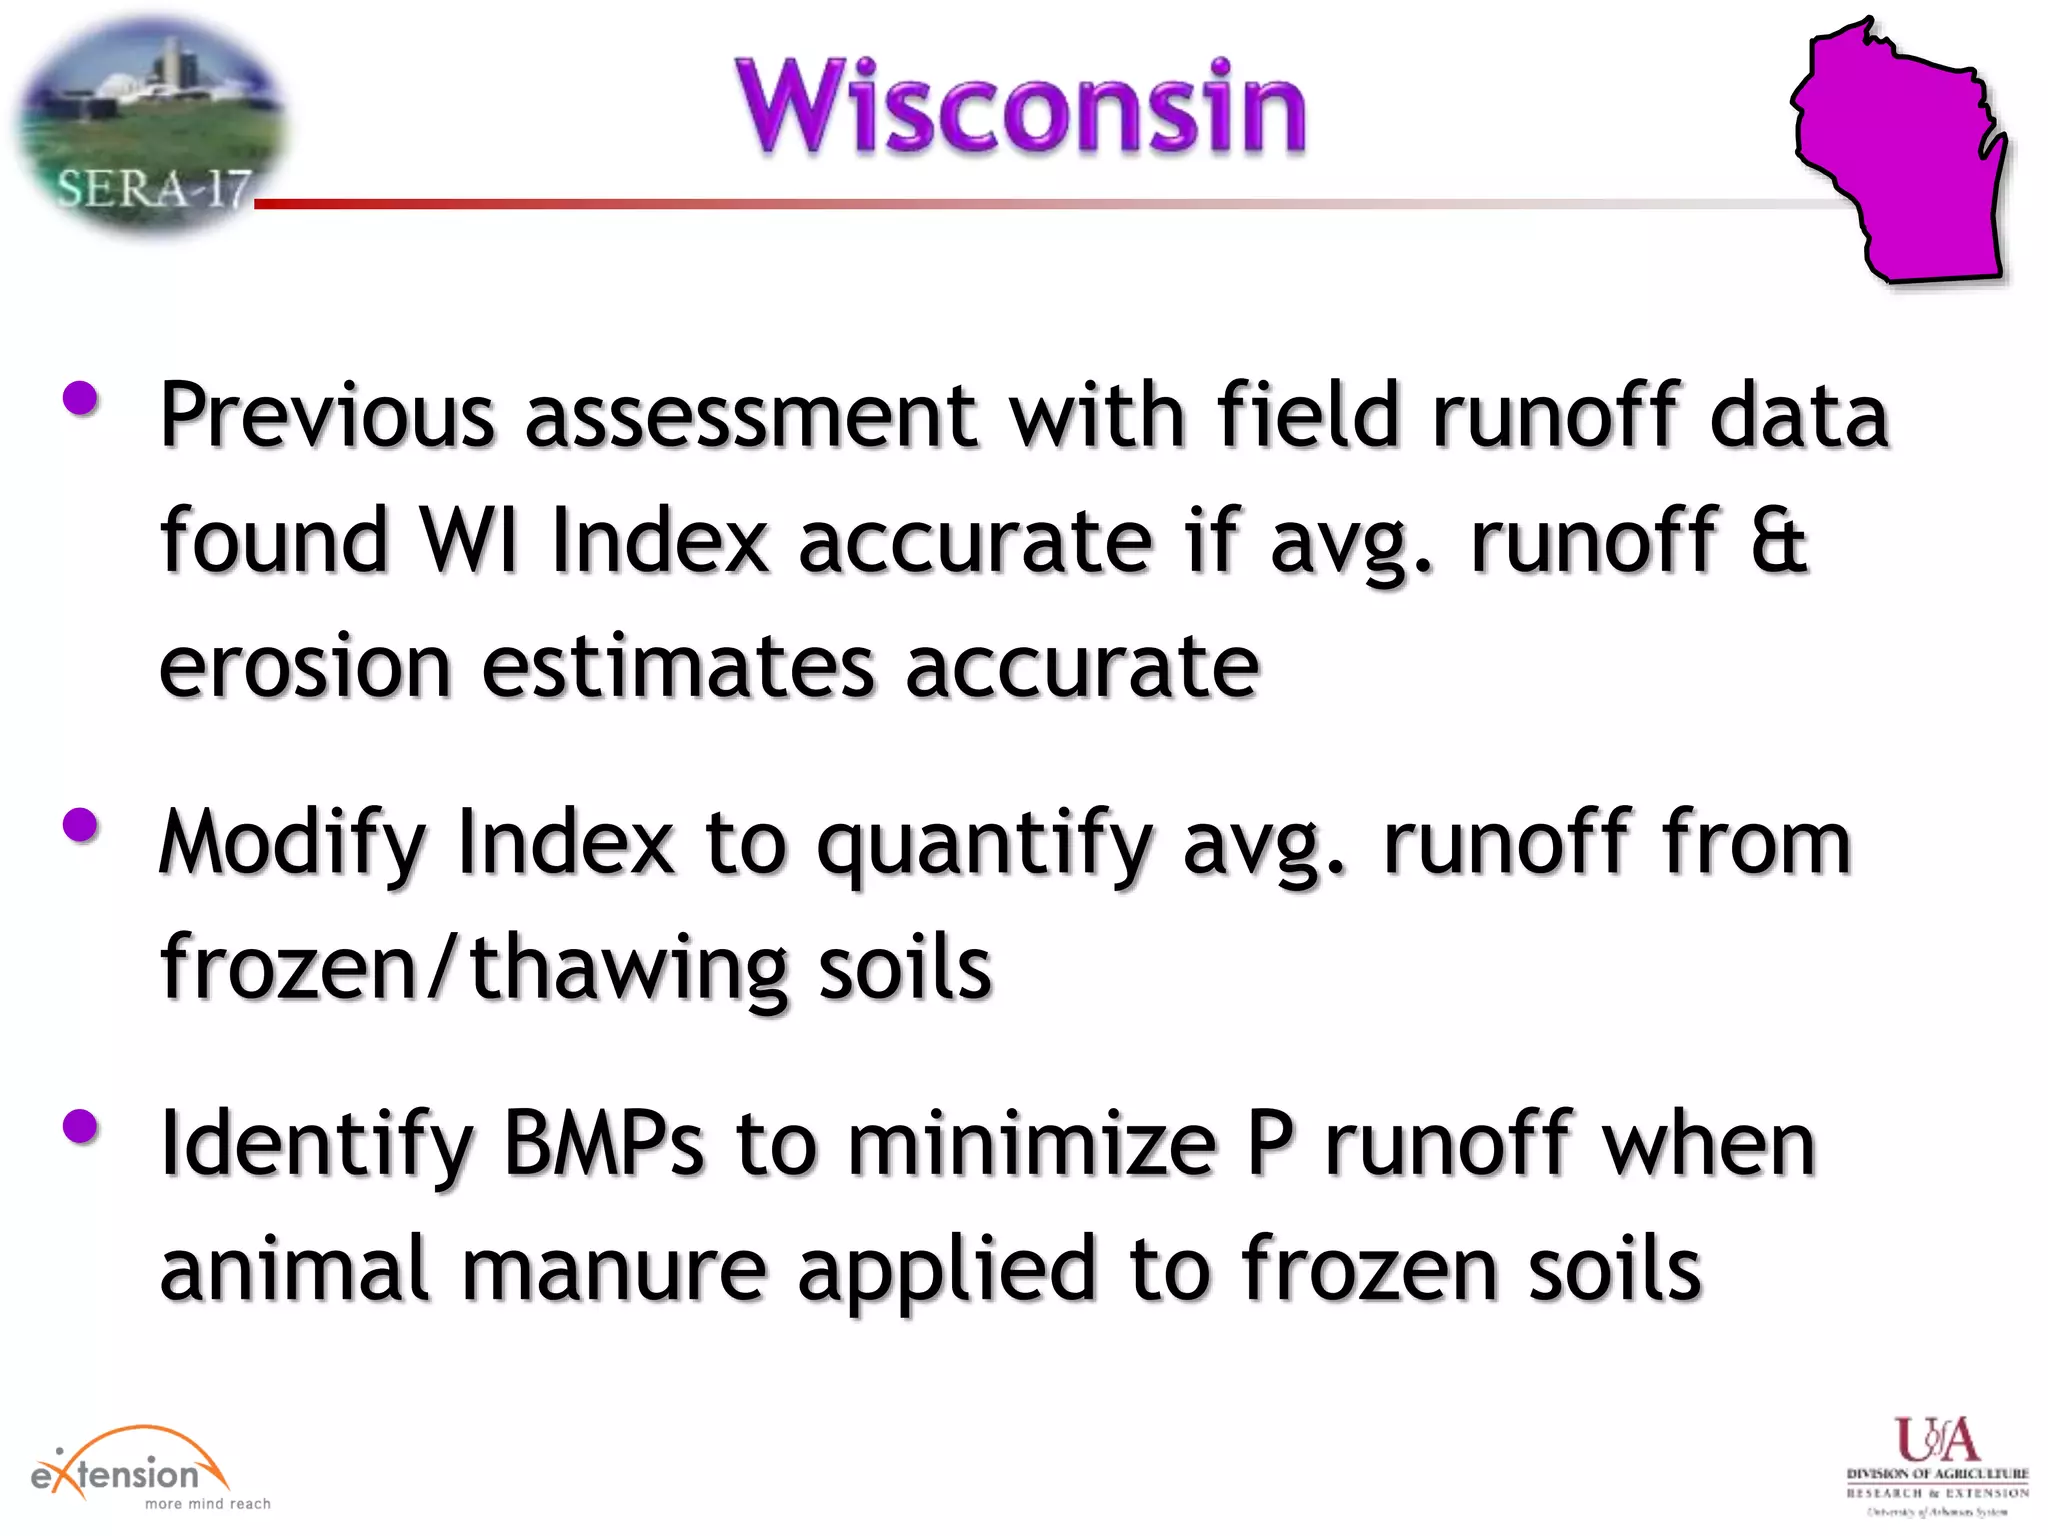
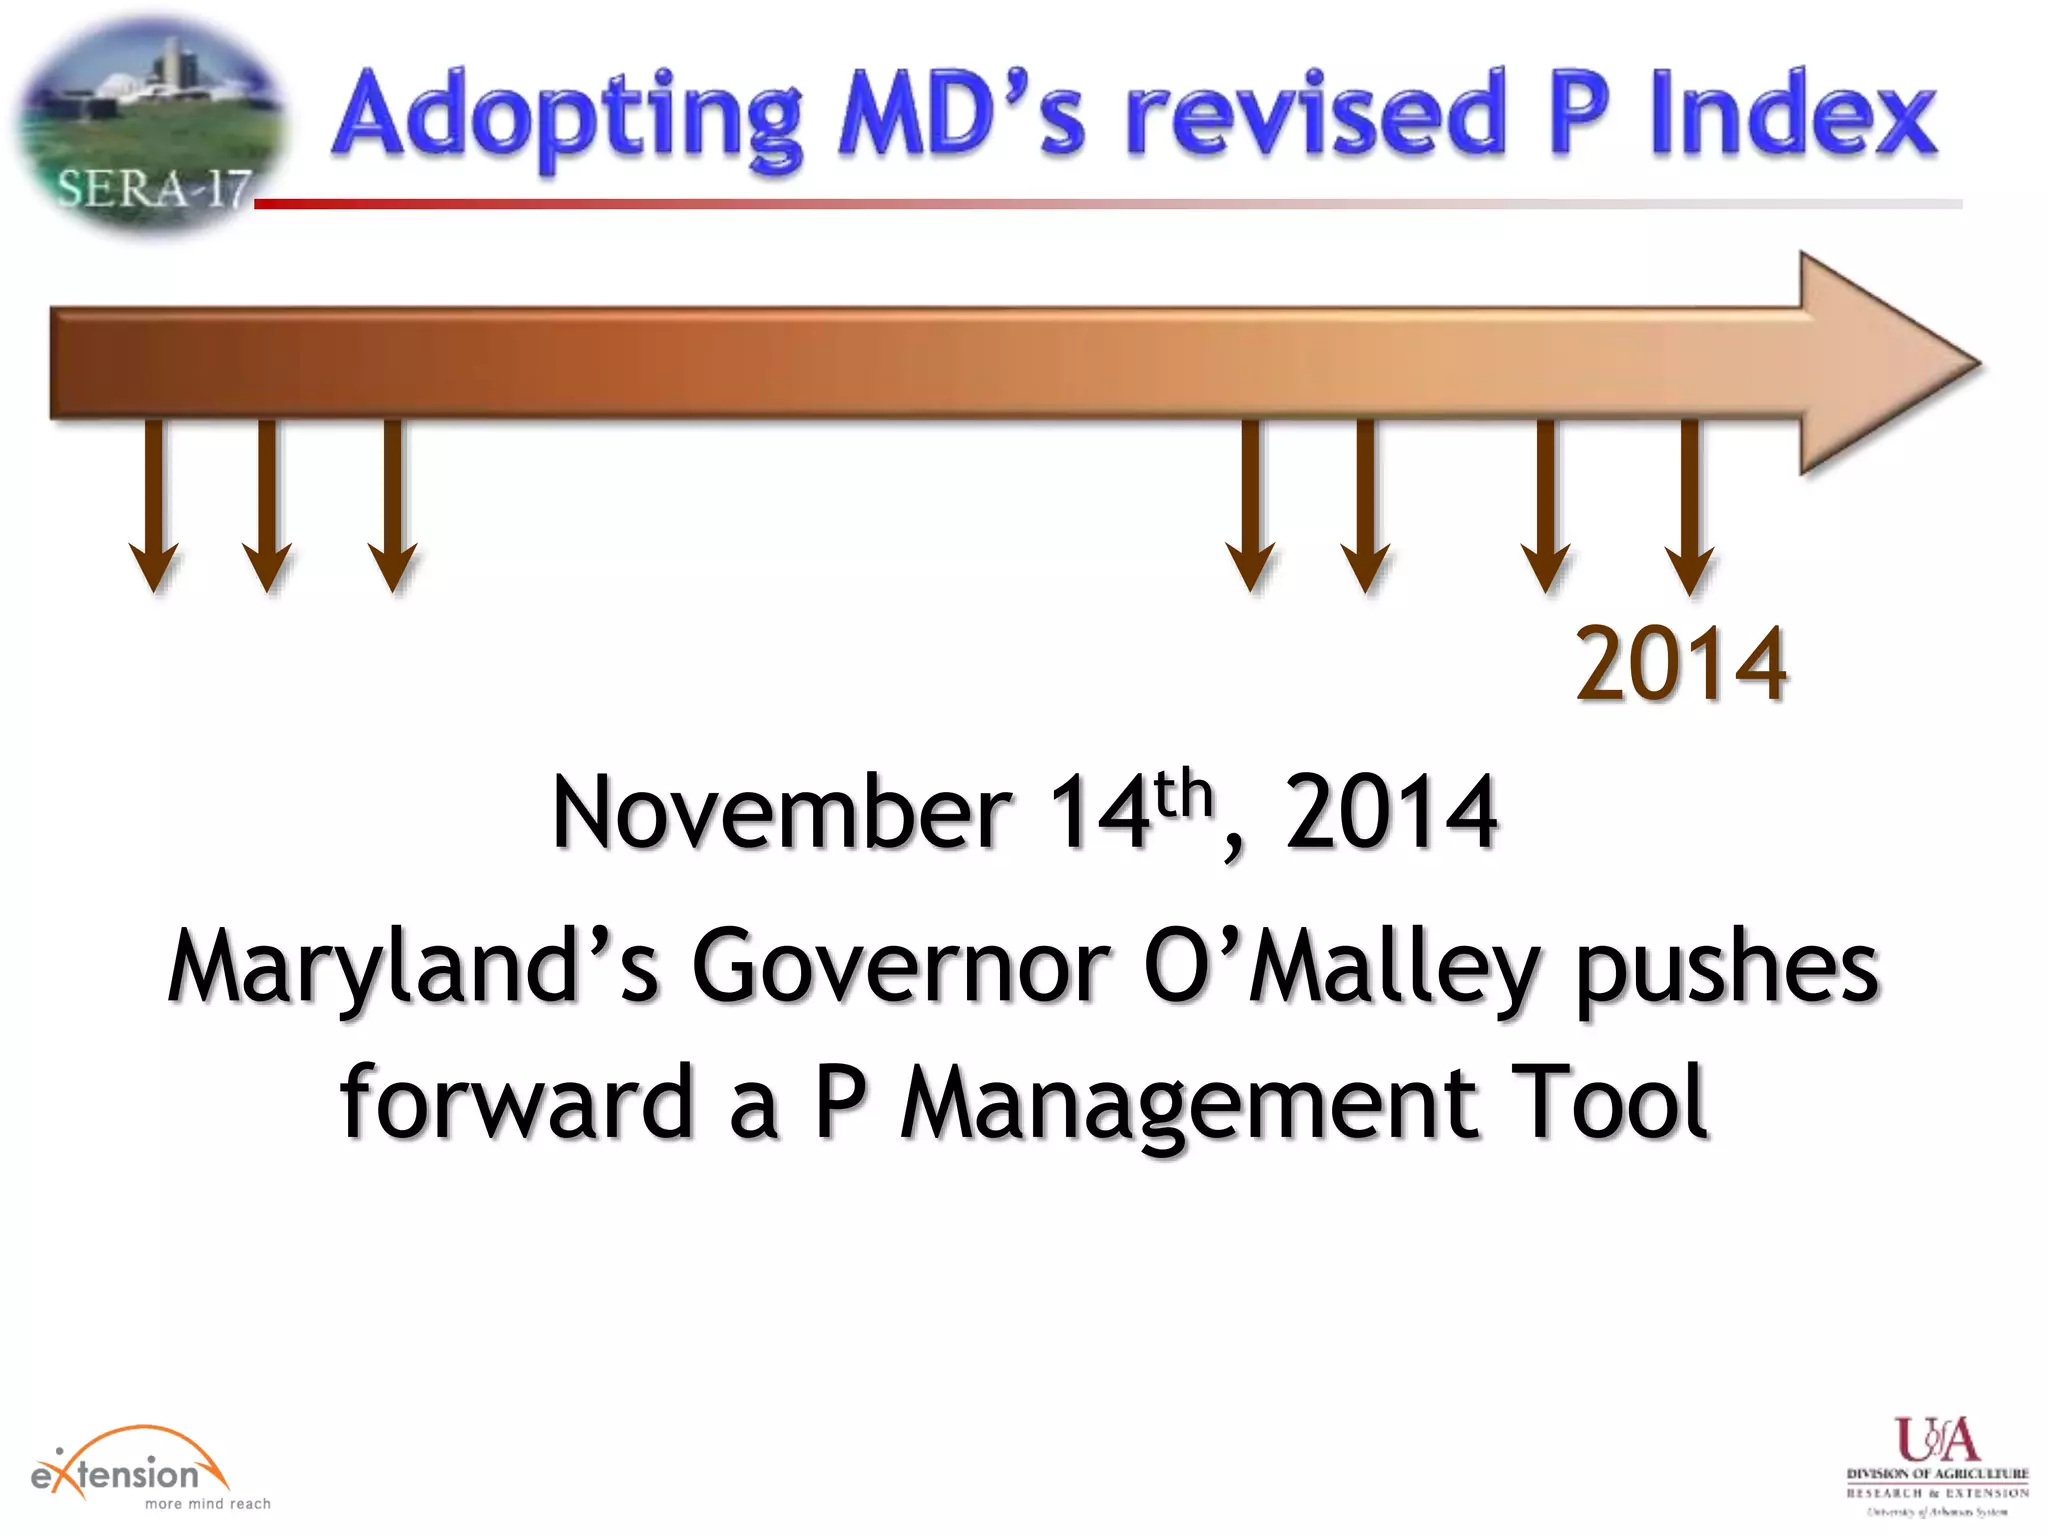
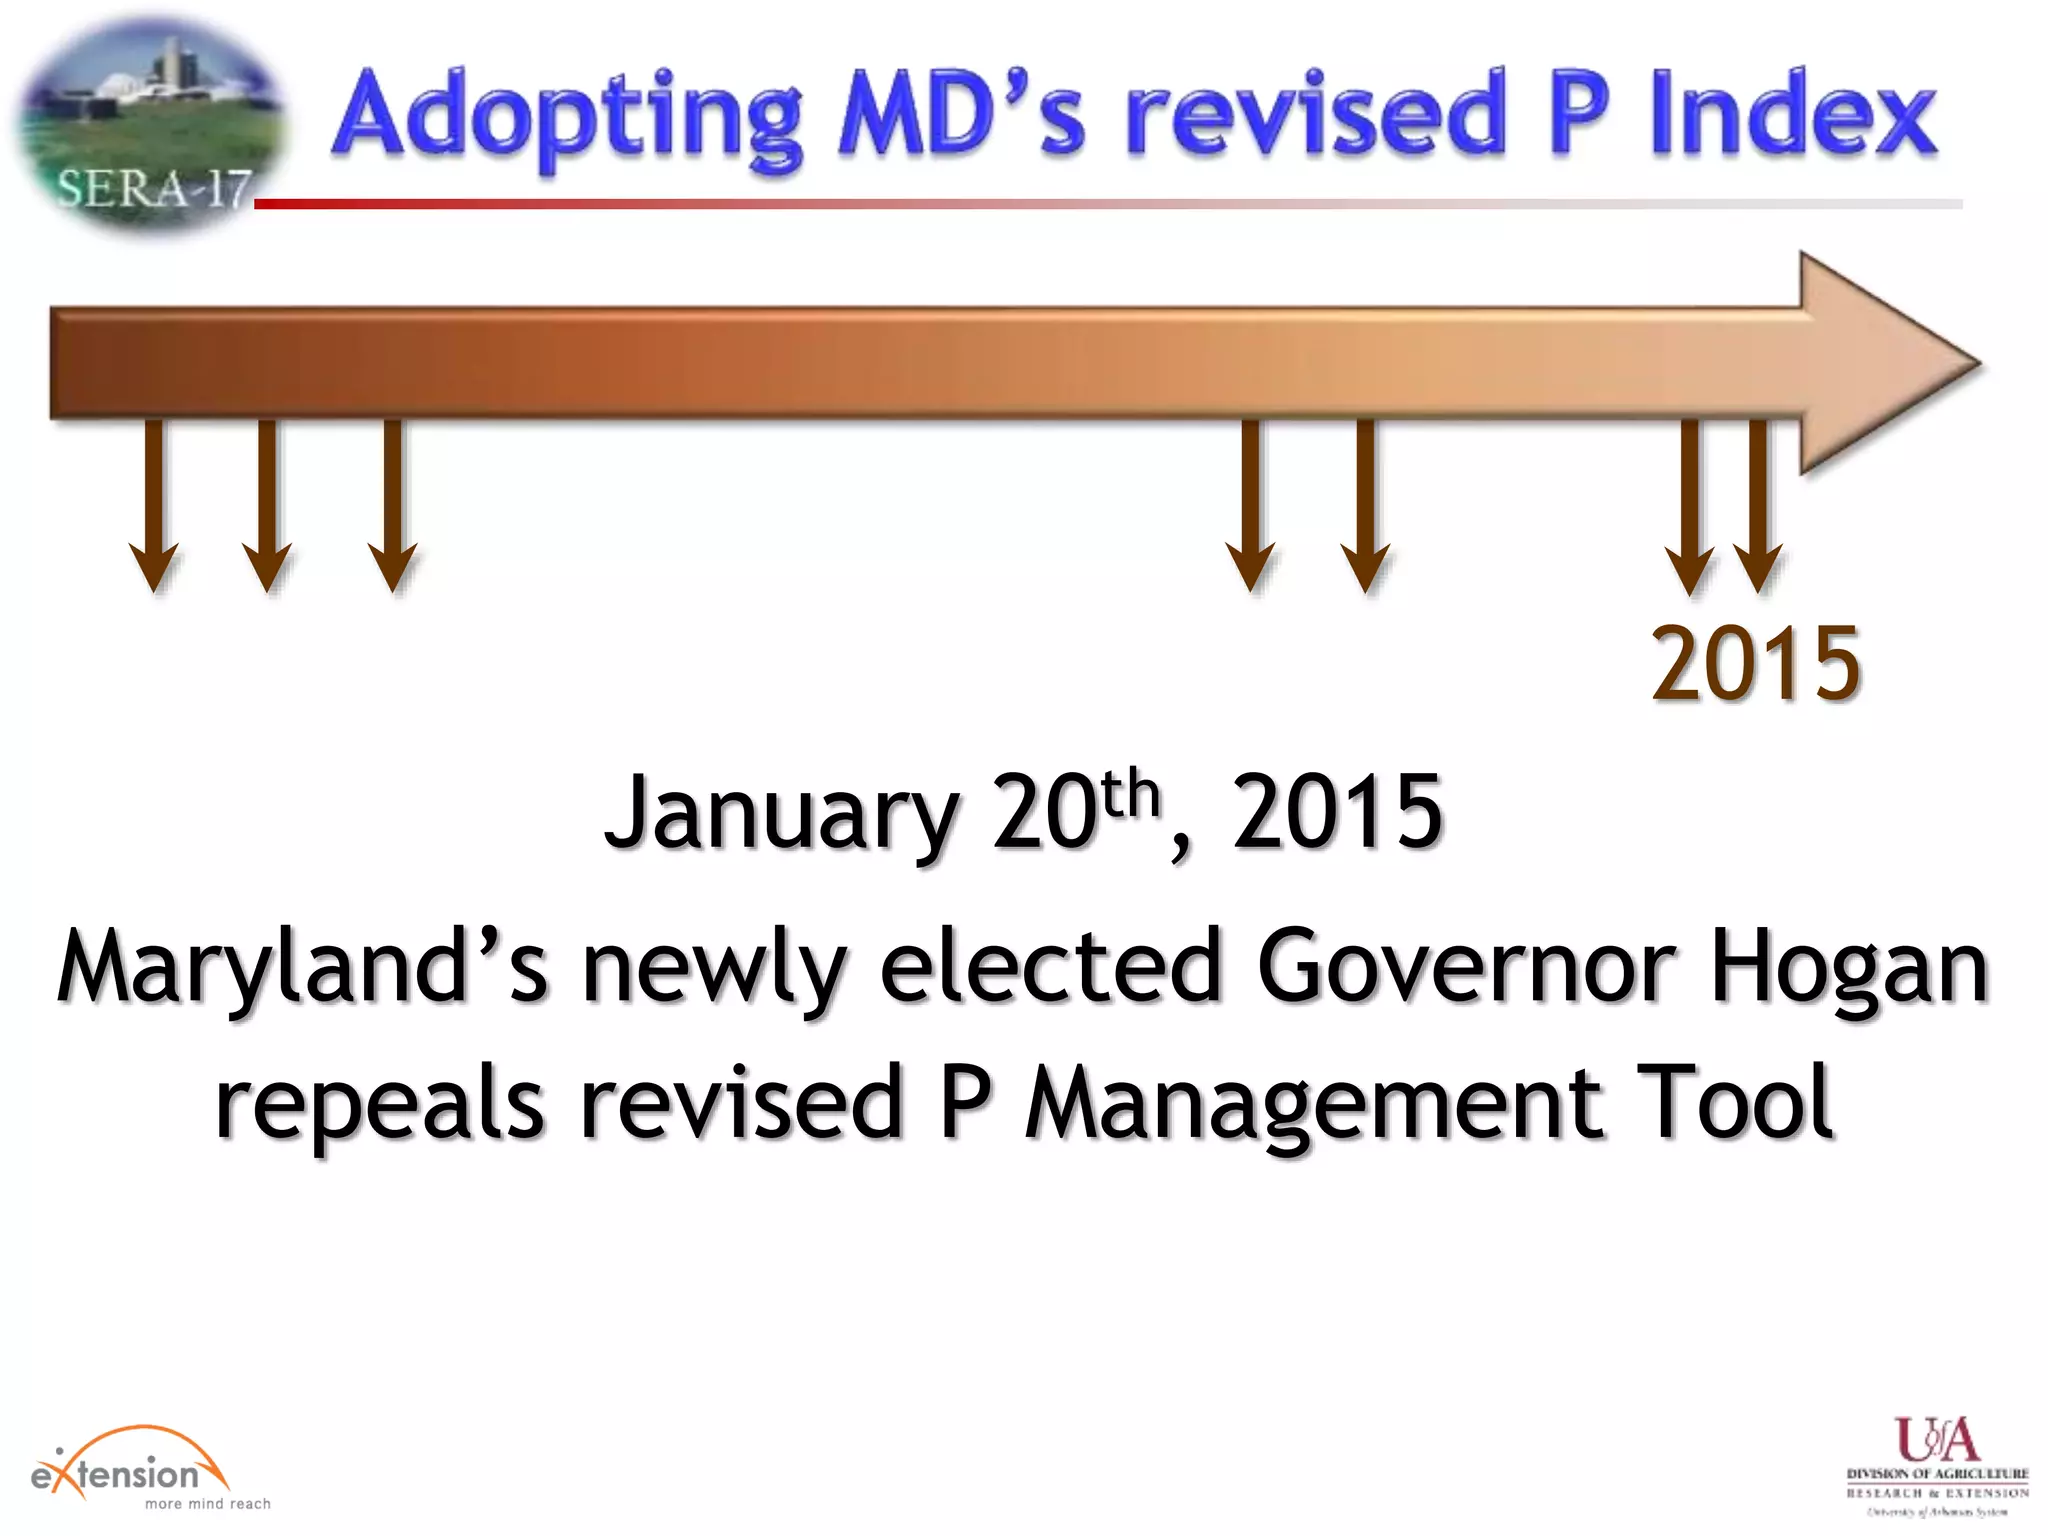
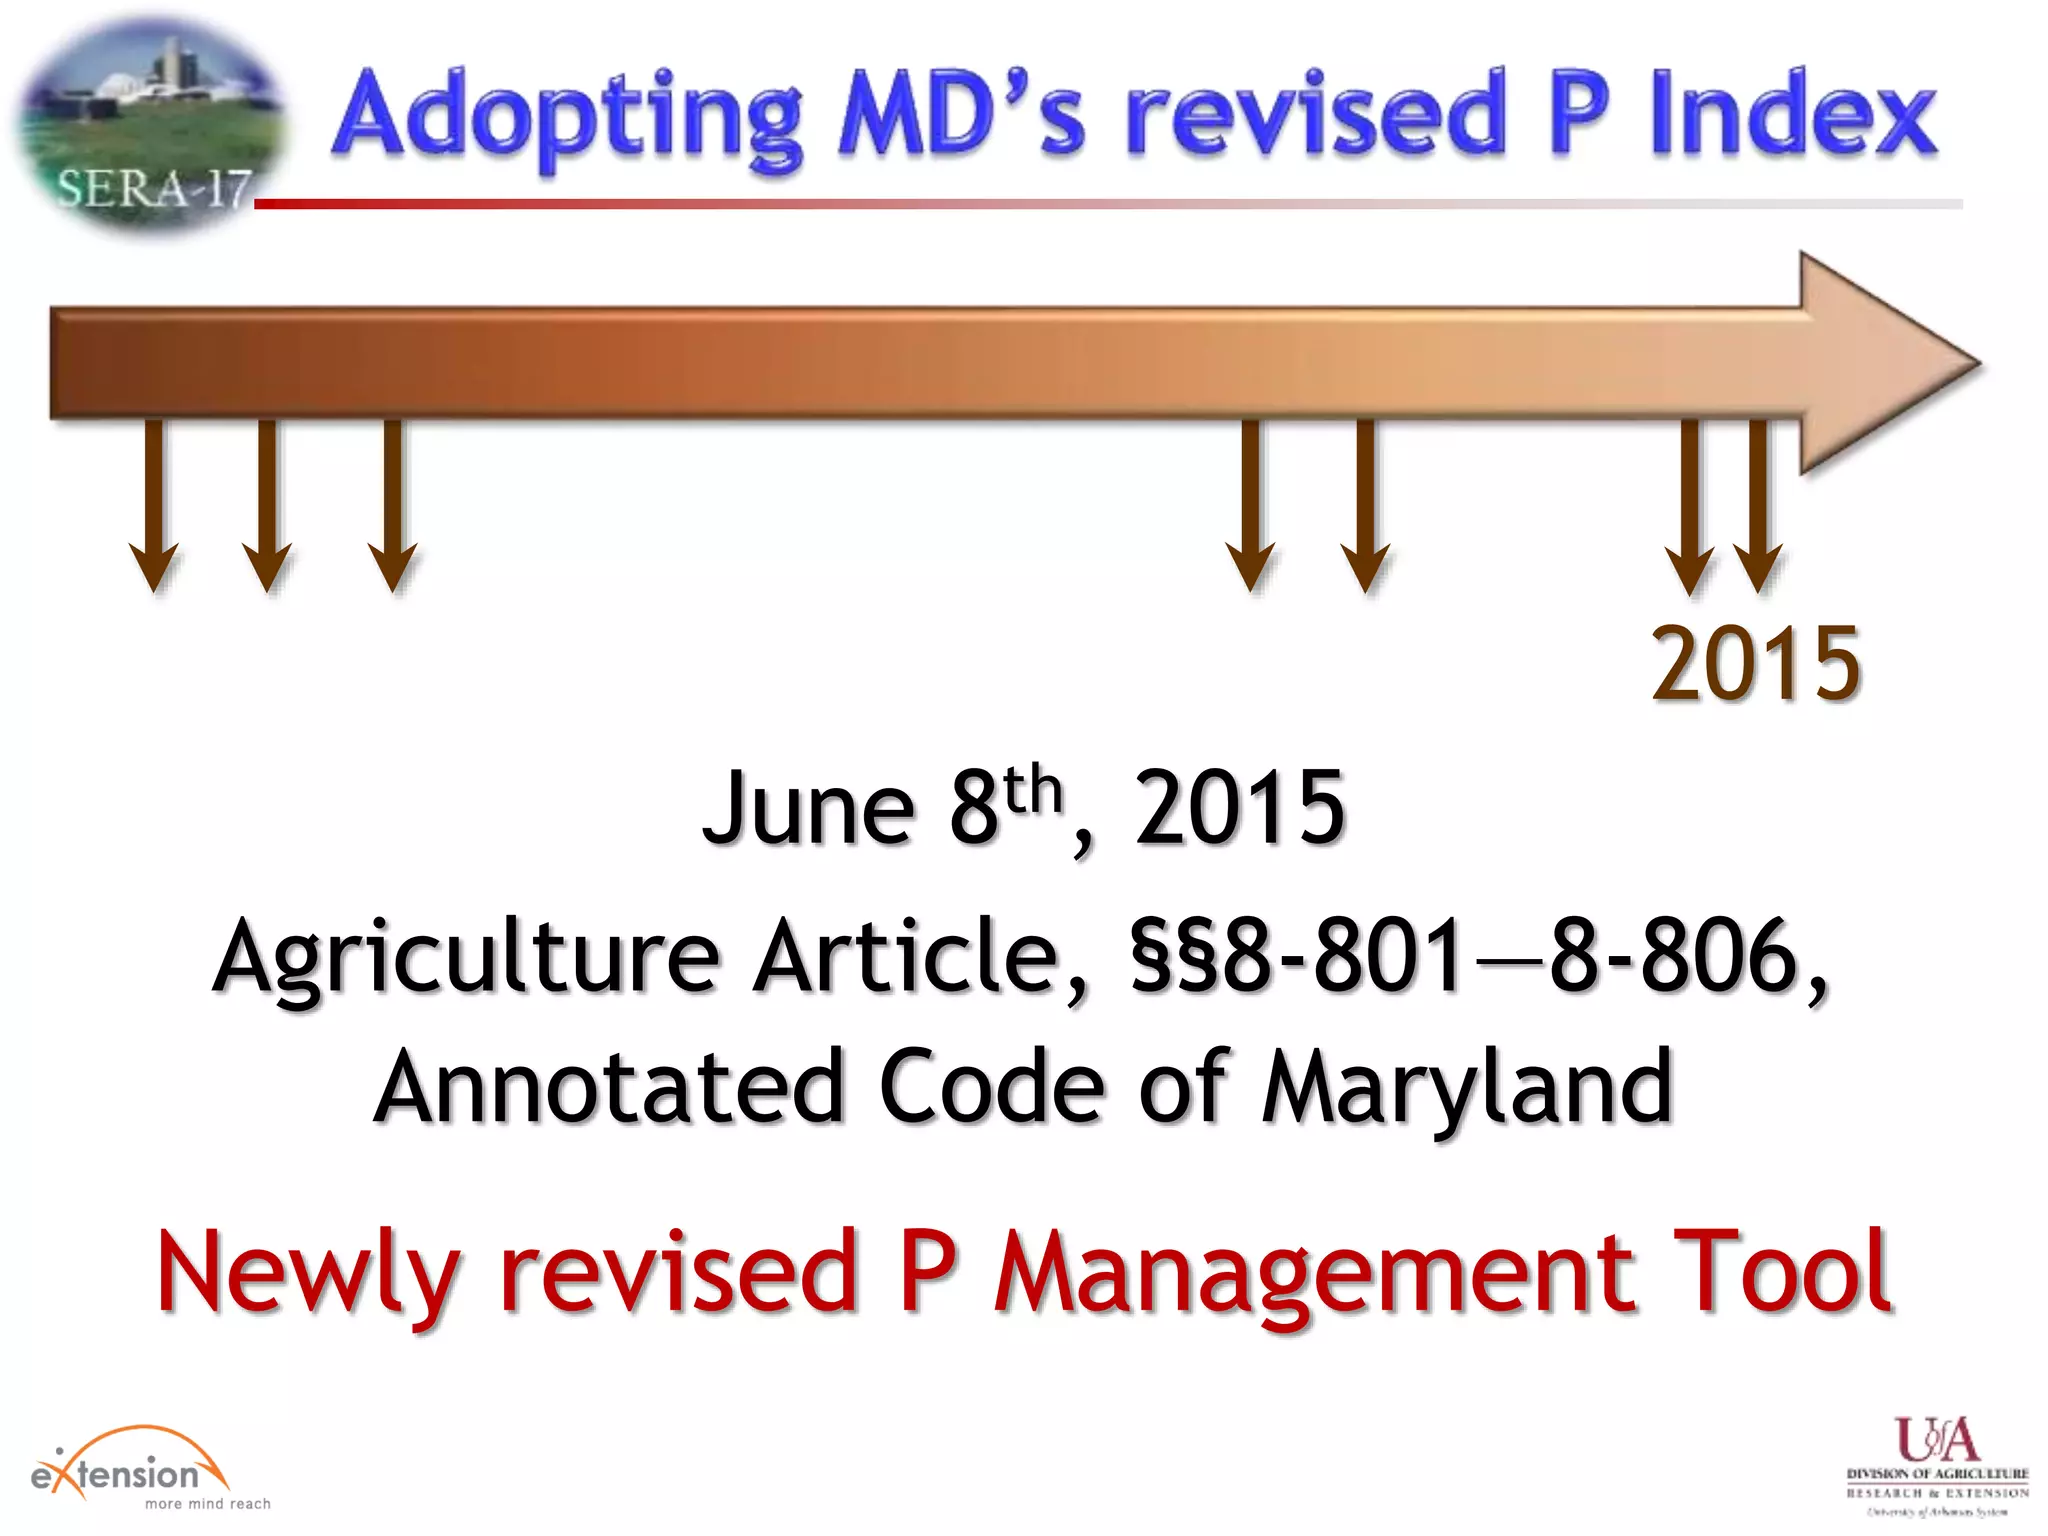


The document discusses advancements in sustainability practices for phosphorus (P) management in animal agriculture across the U.S., highlighting the variability and effectiveness of P indices amidst state-specific challenges. Recommendations emphasize the need for locally relevant assessments and modifications to existing P management tools to improve water quality outcomes. It notes significant changes in Maryland's P management policies, reflecting ongoing debates around effective nutrient management strategies.


