Download to read offline

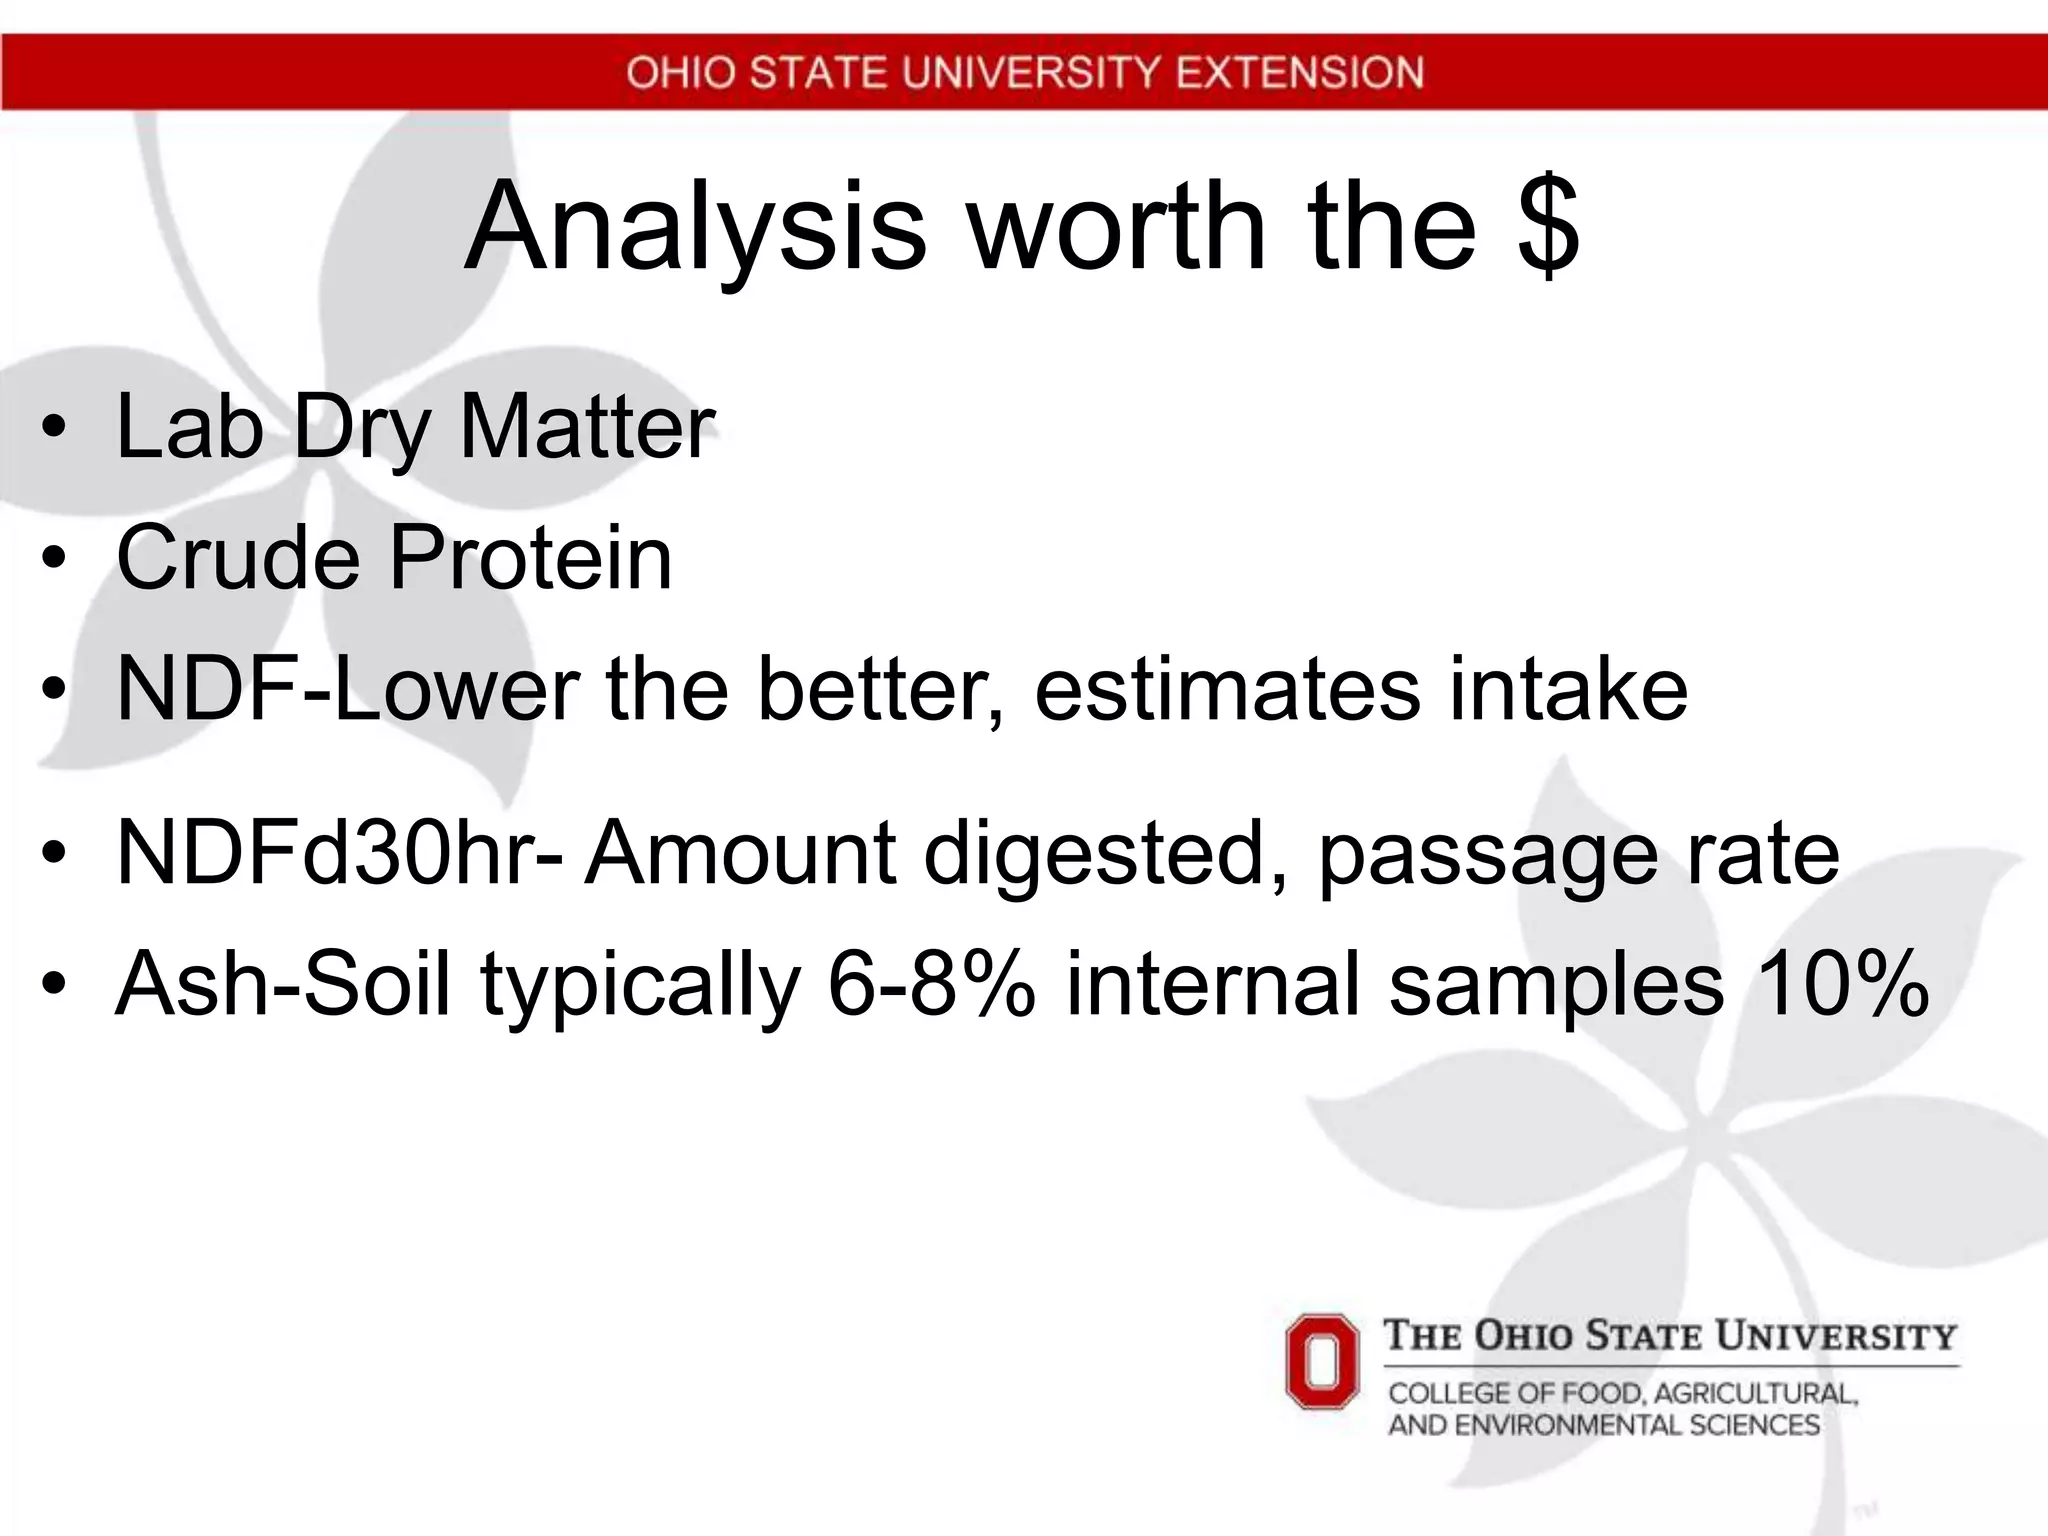


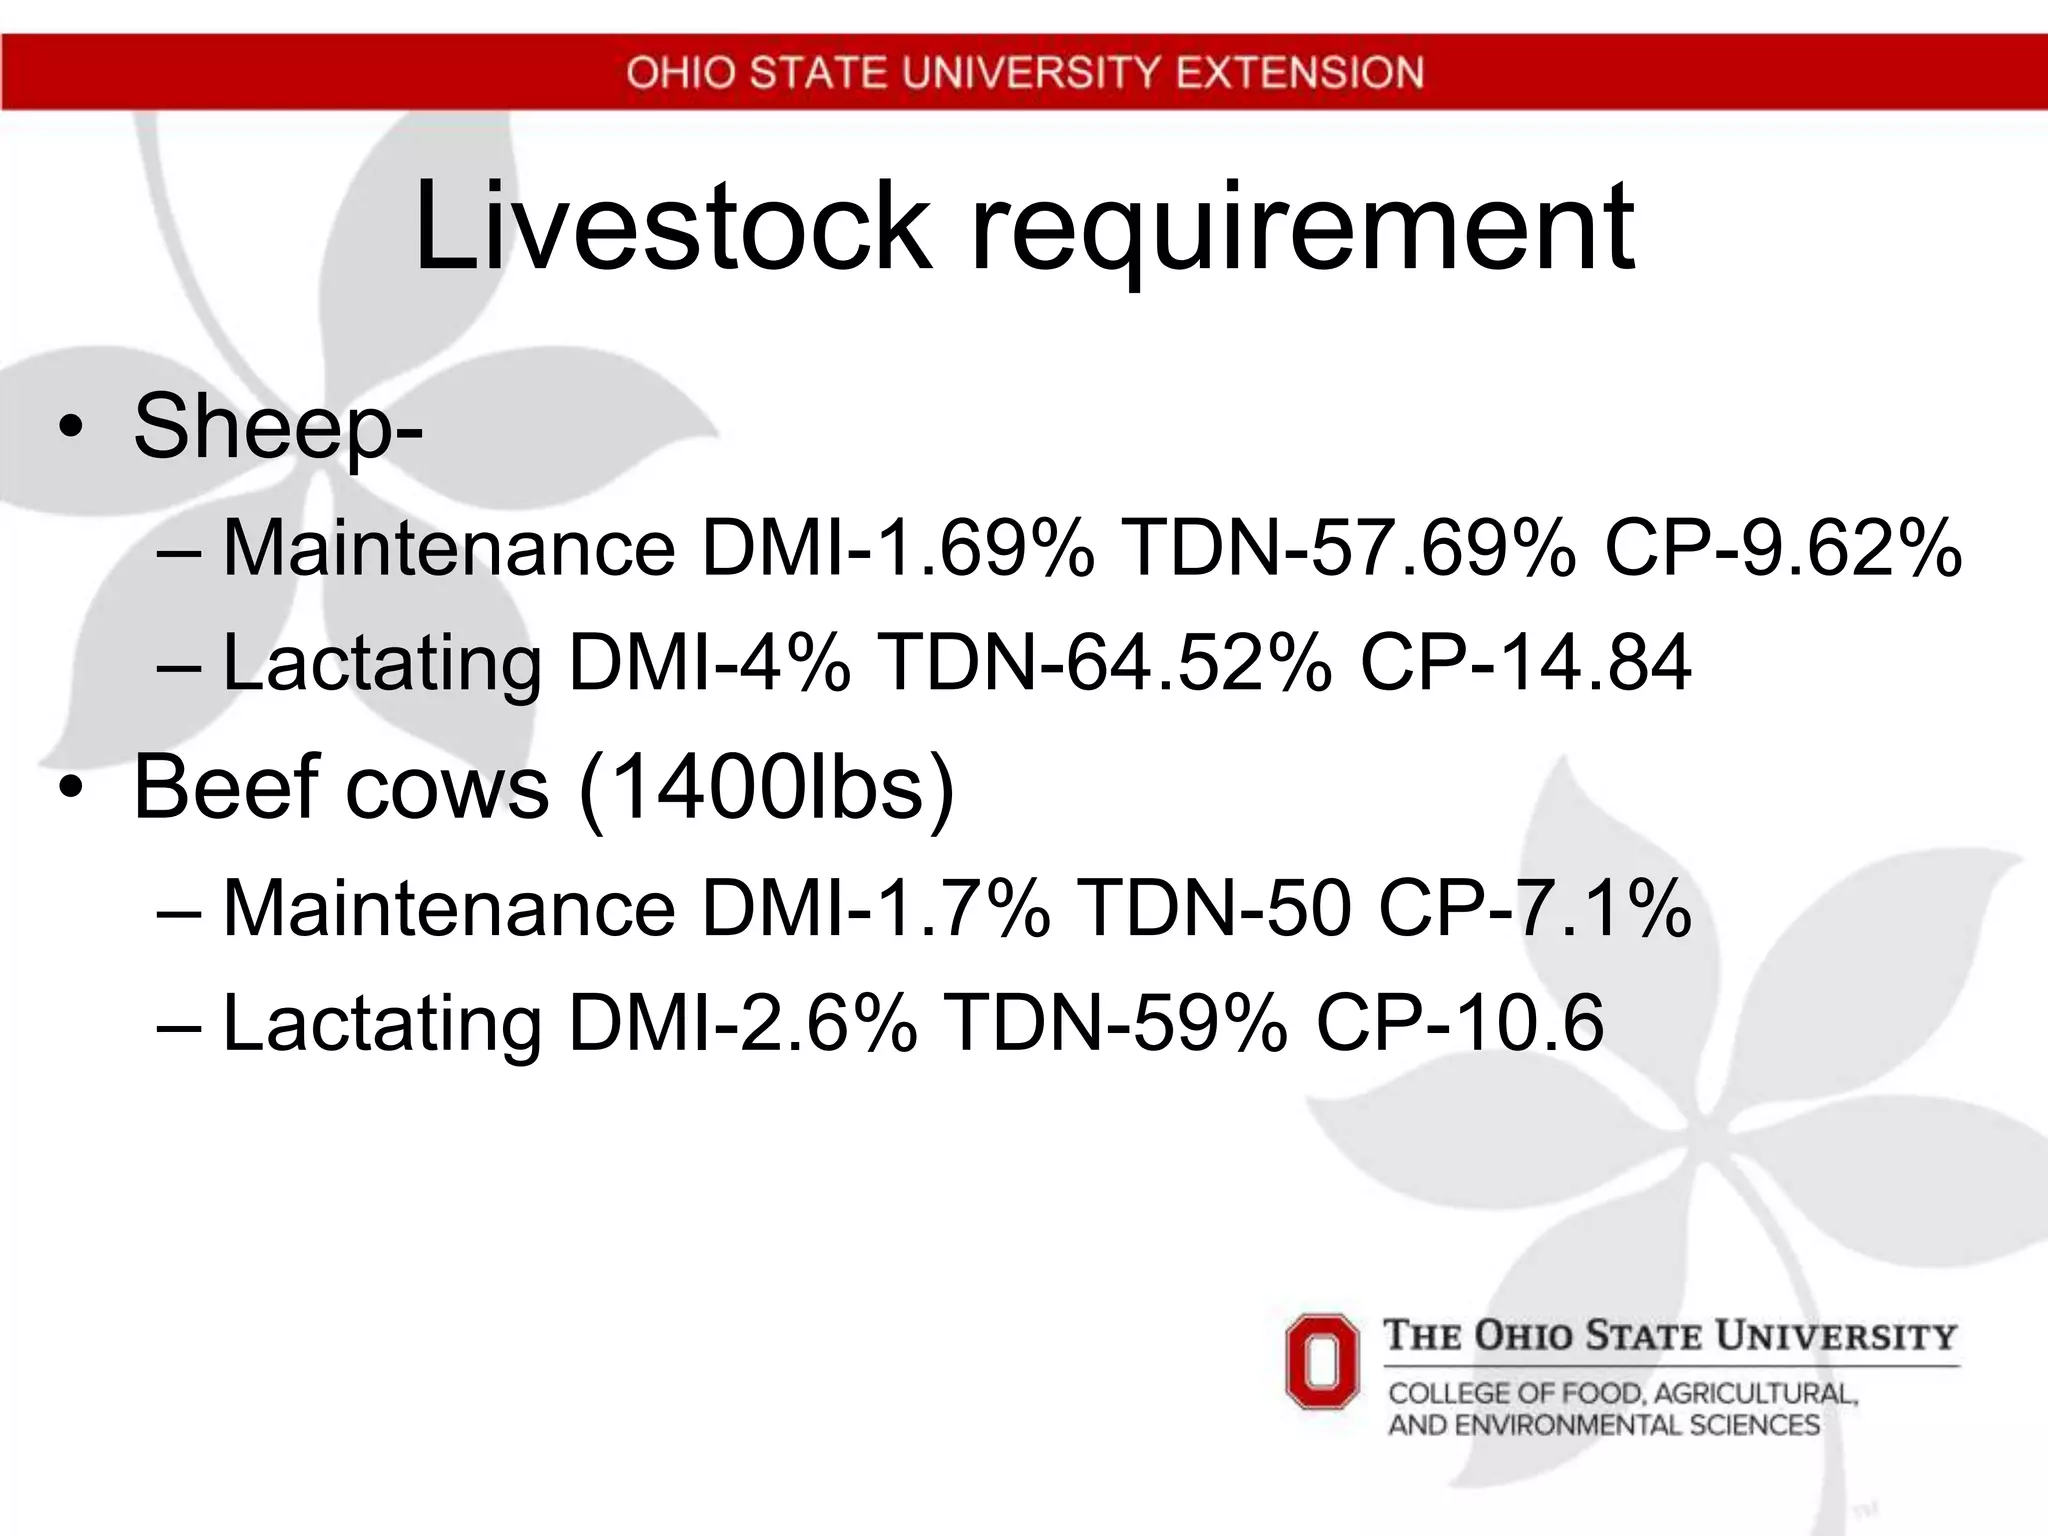
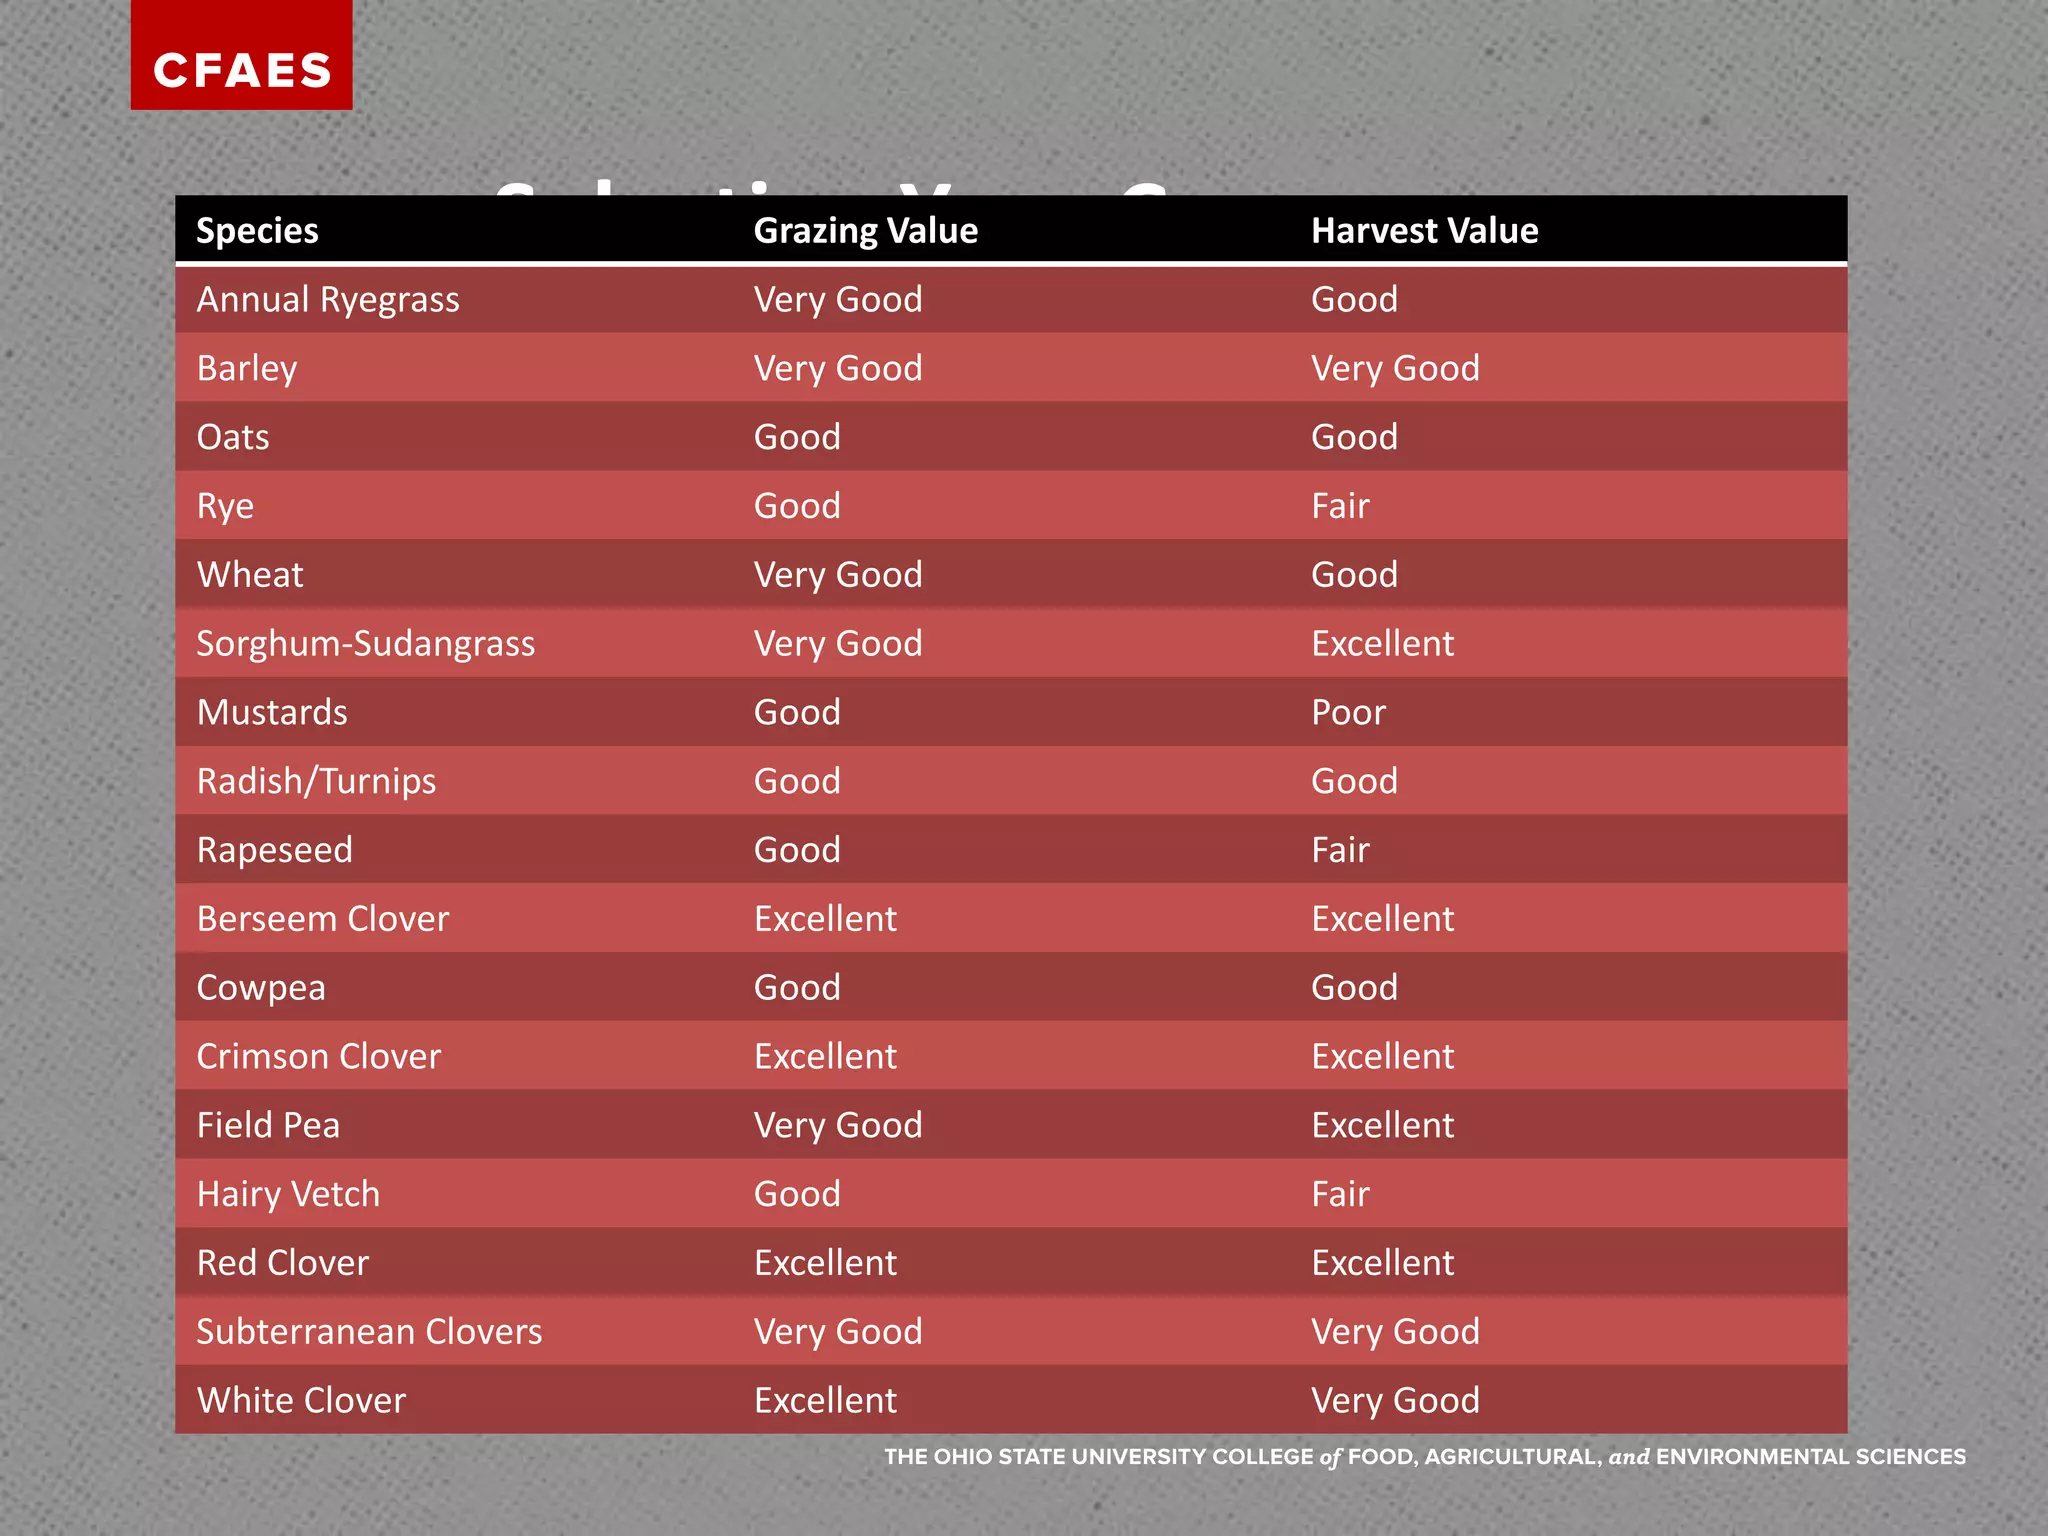
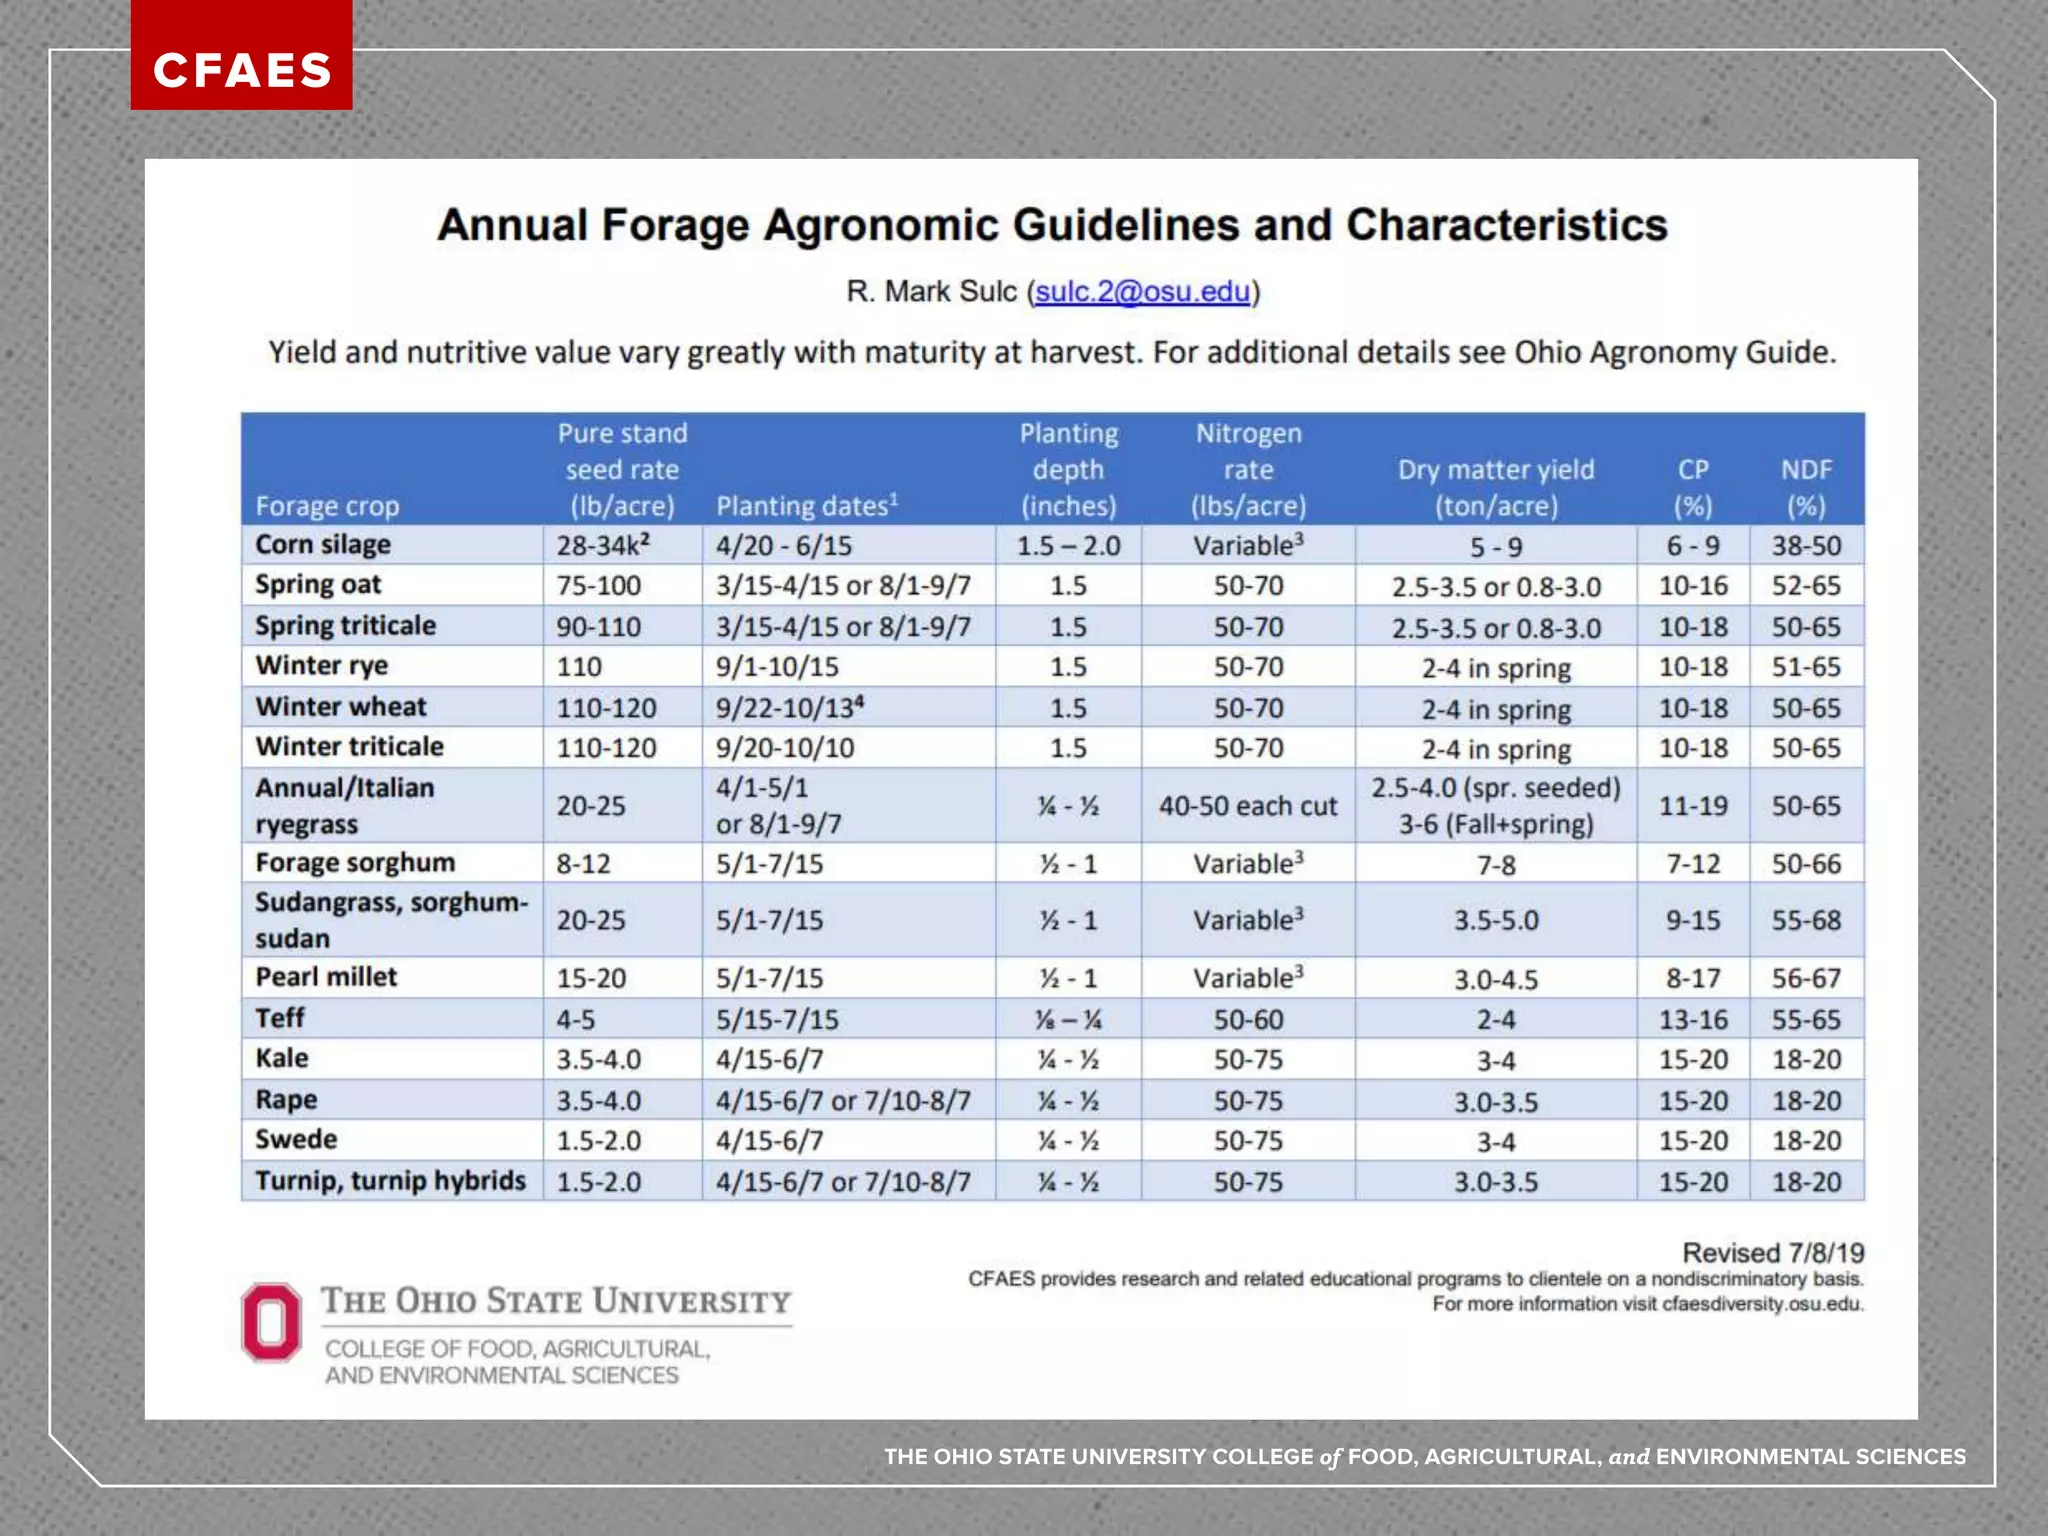
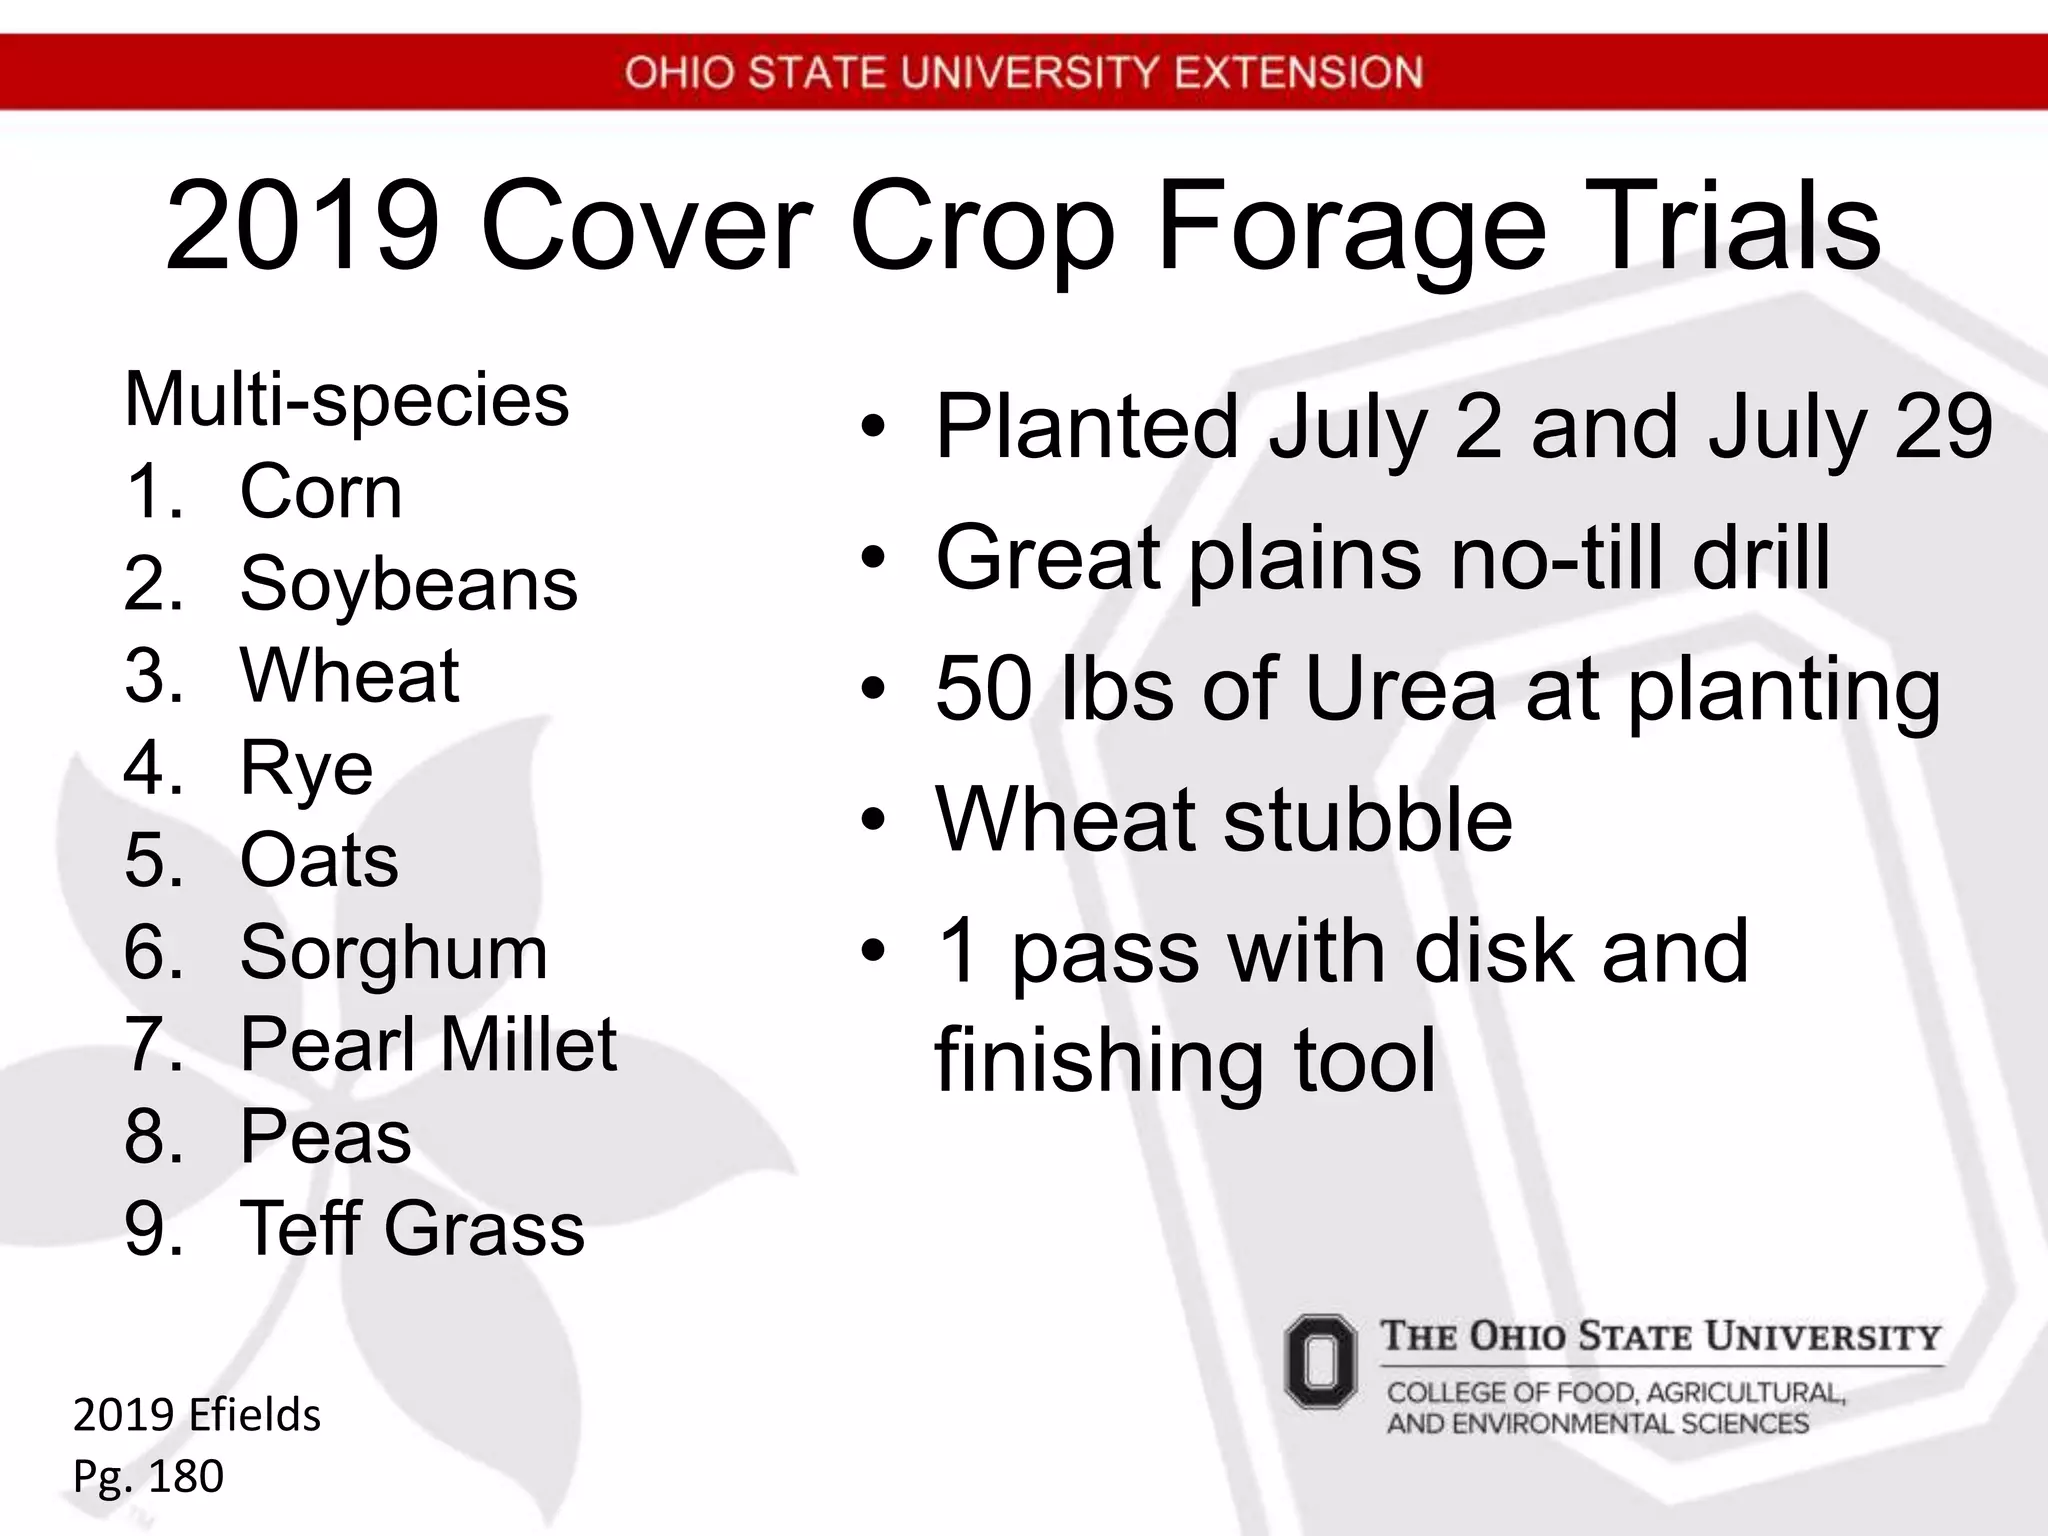
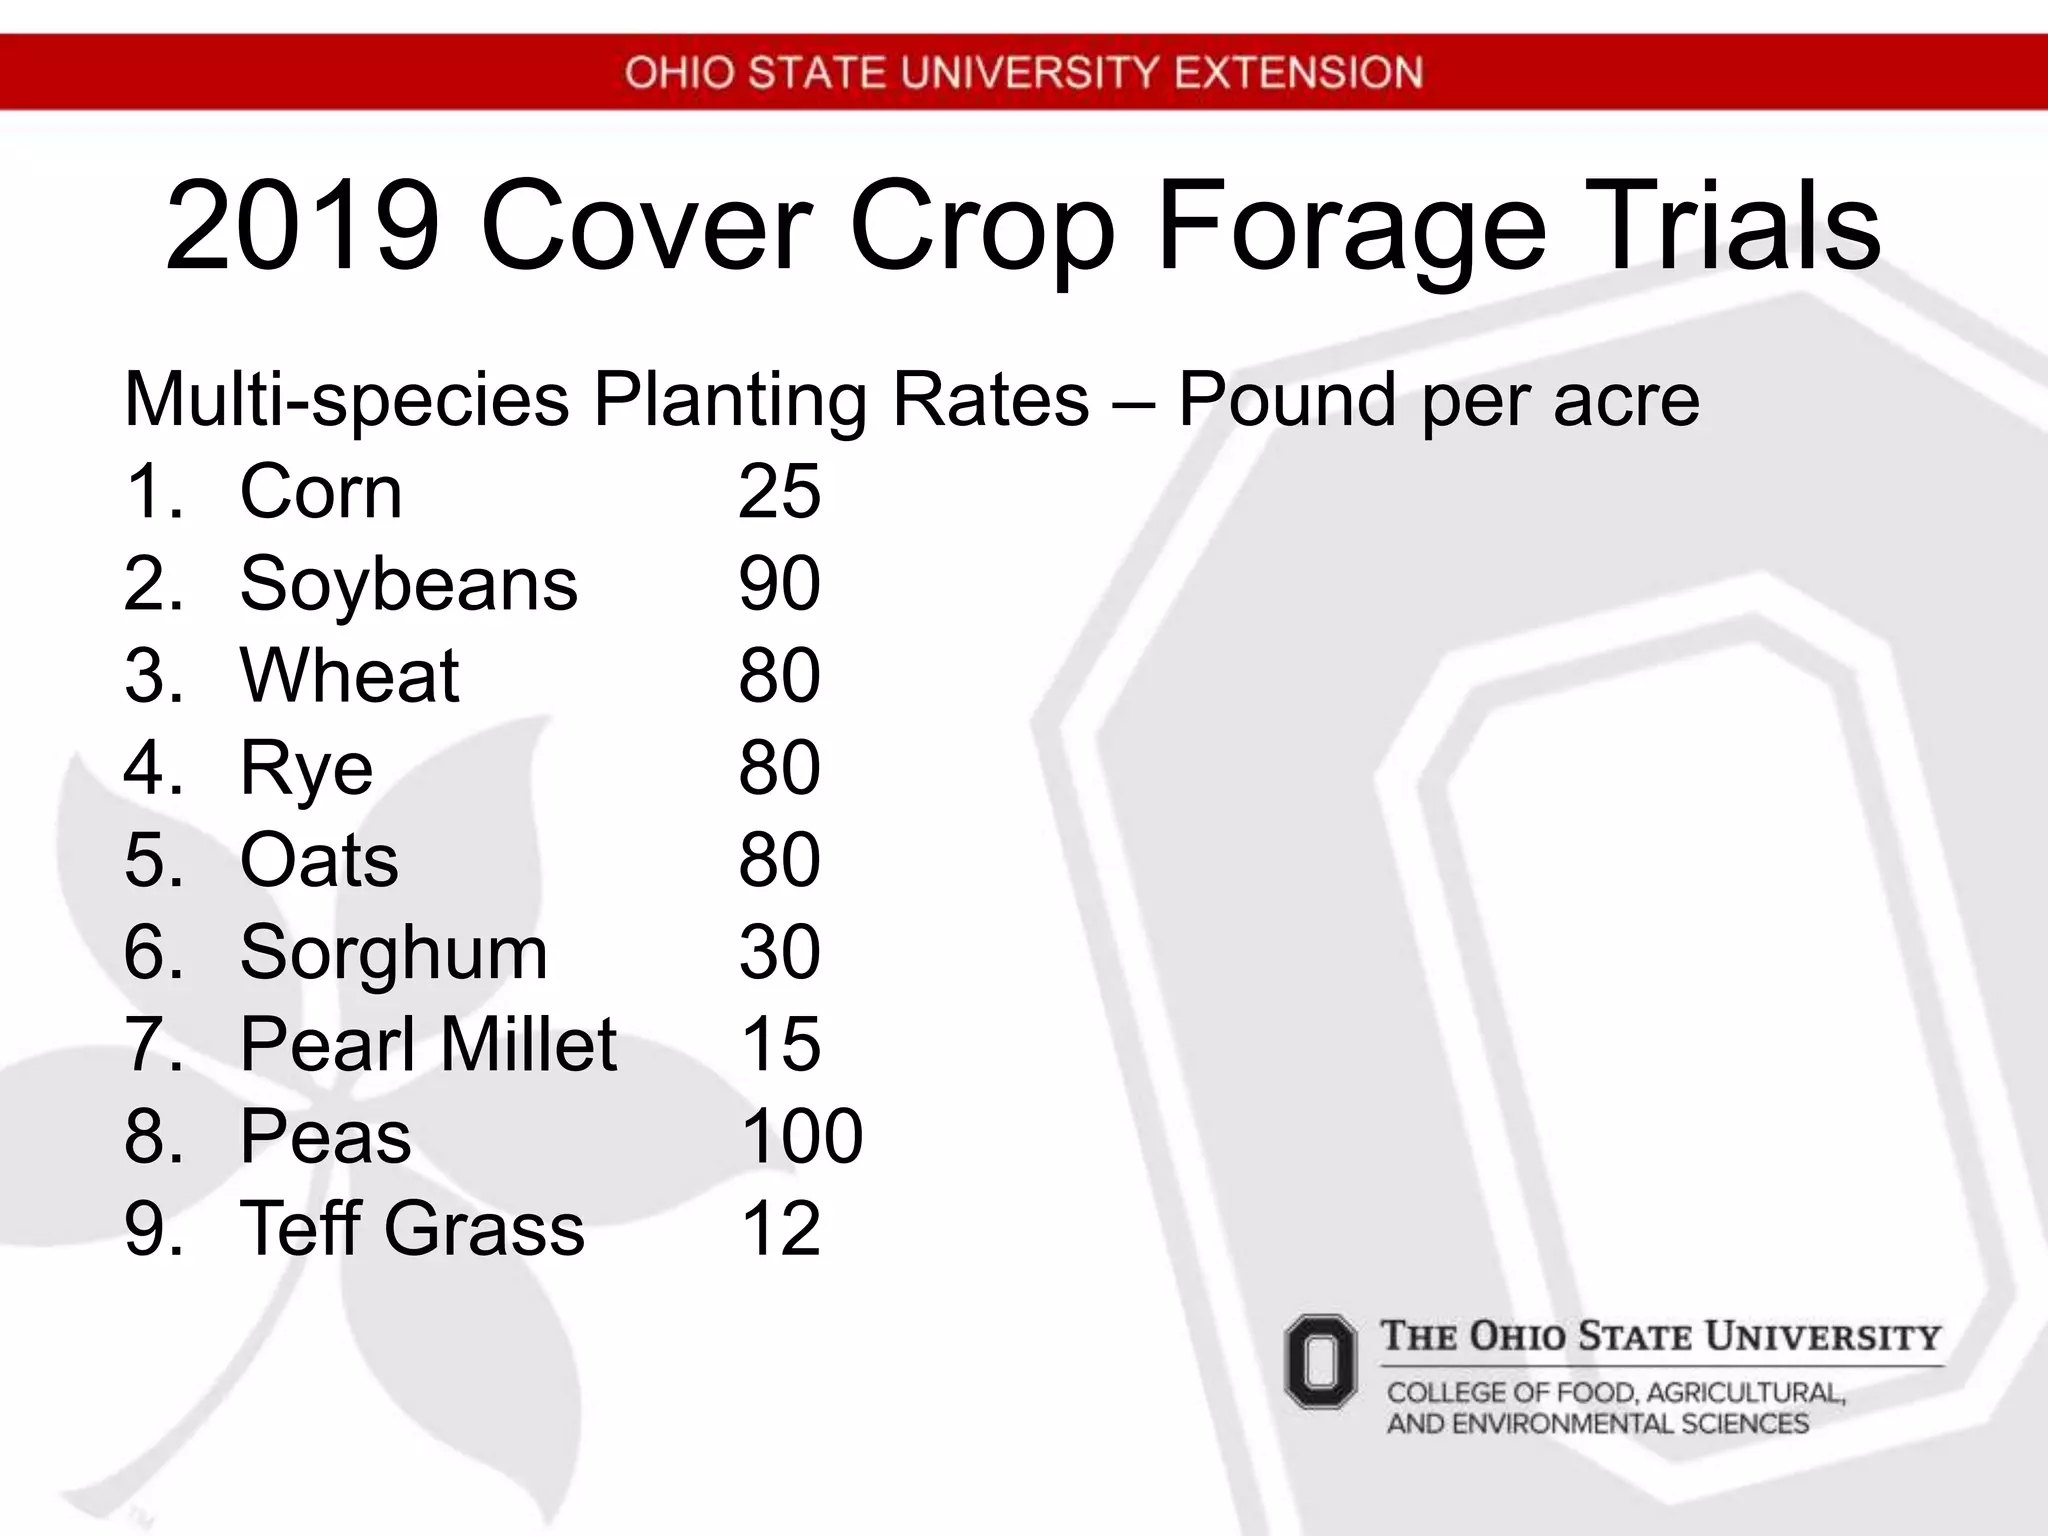
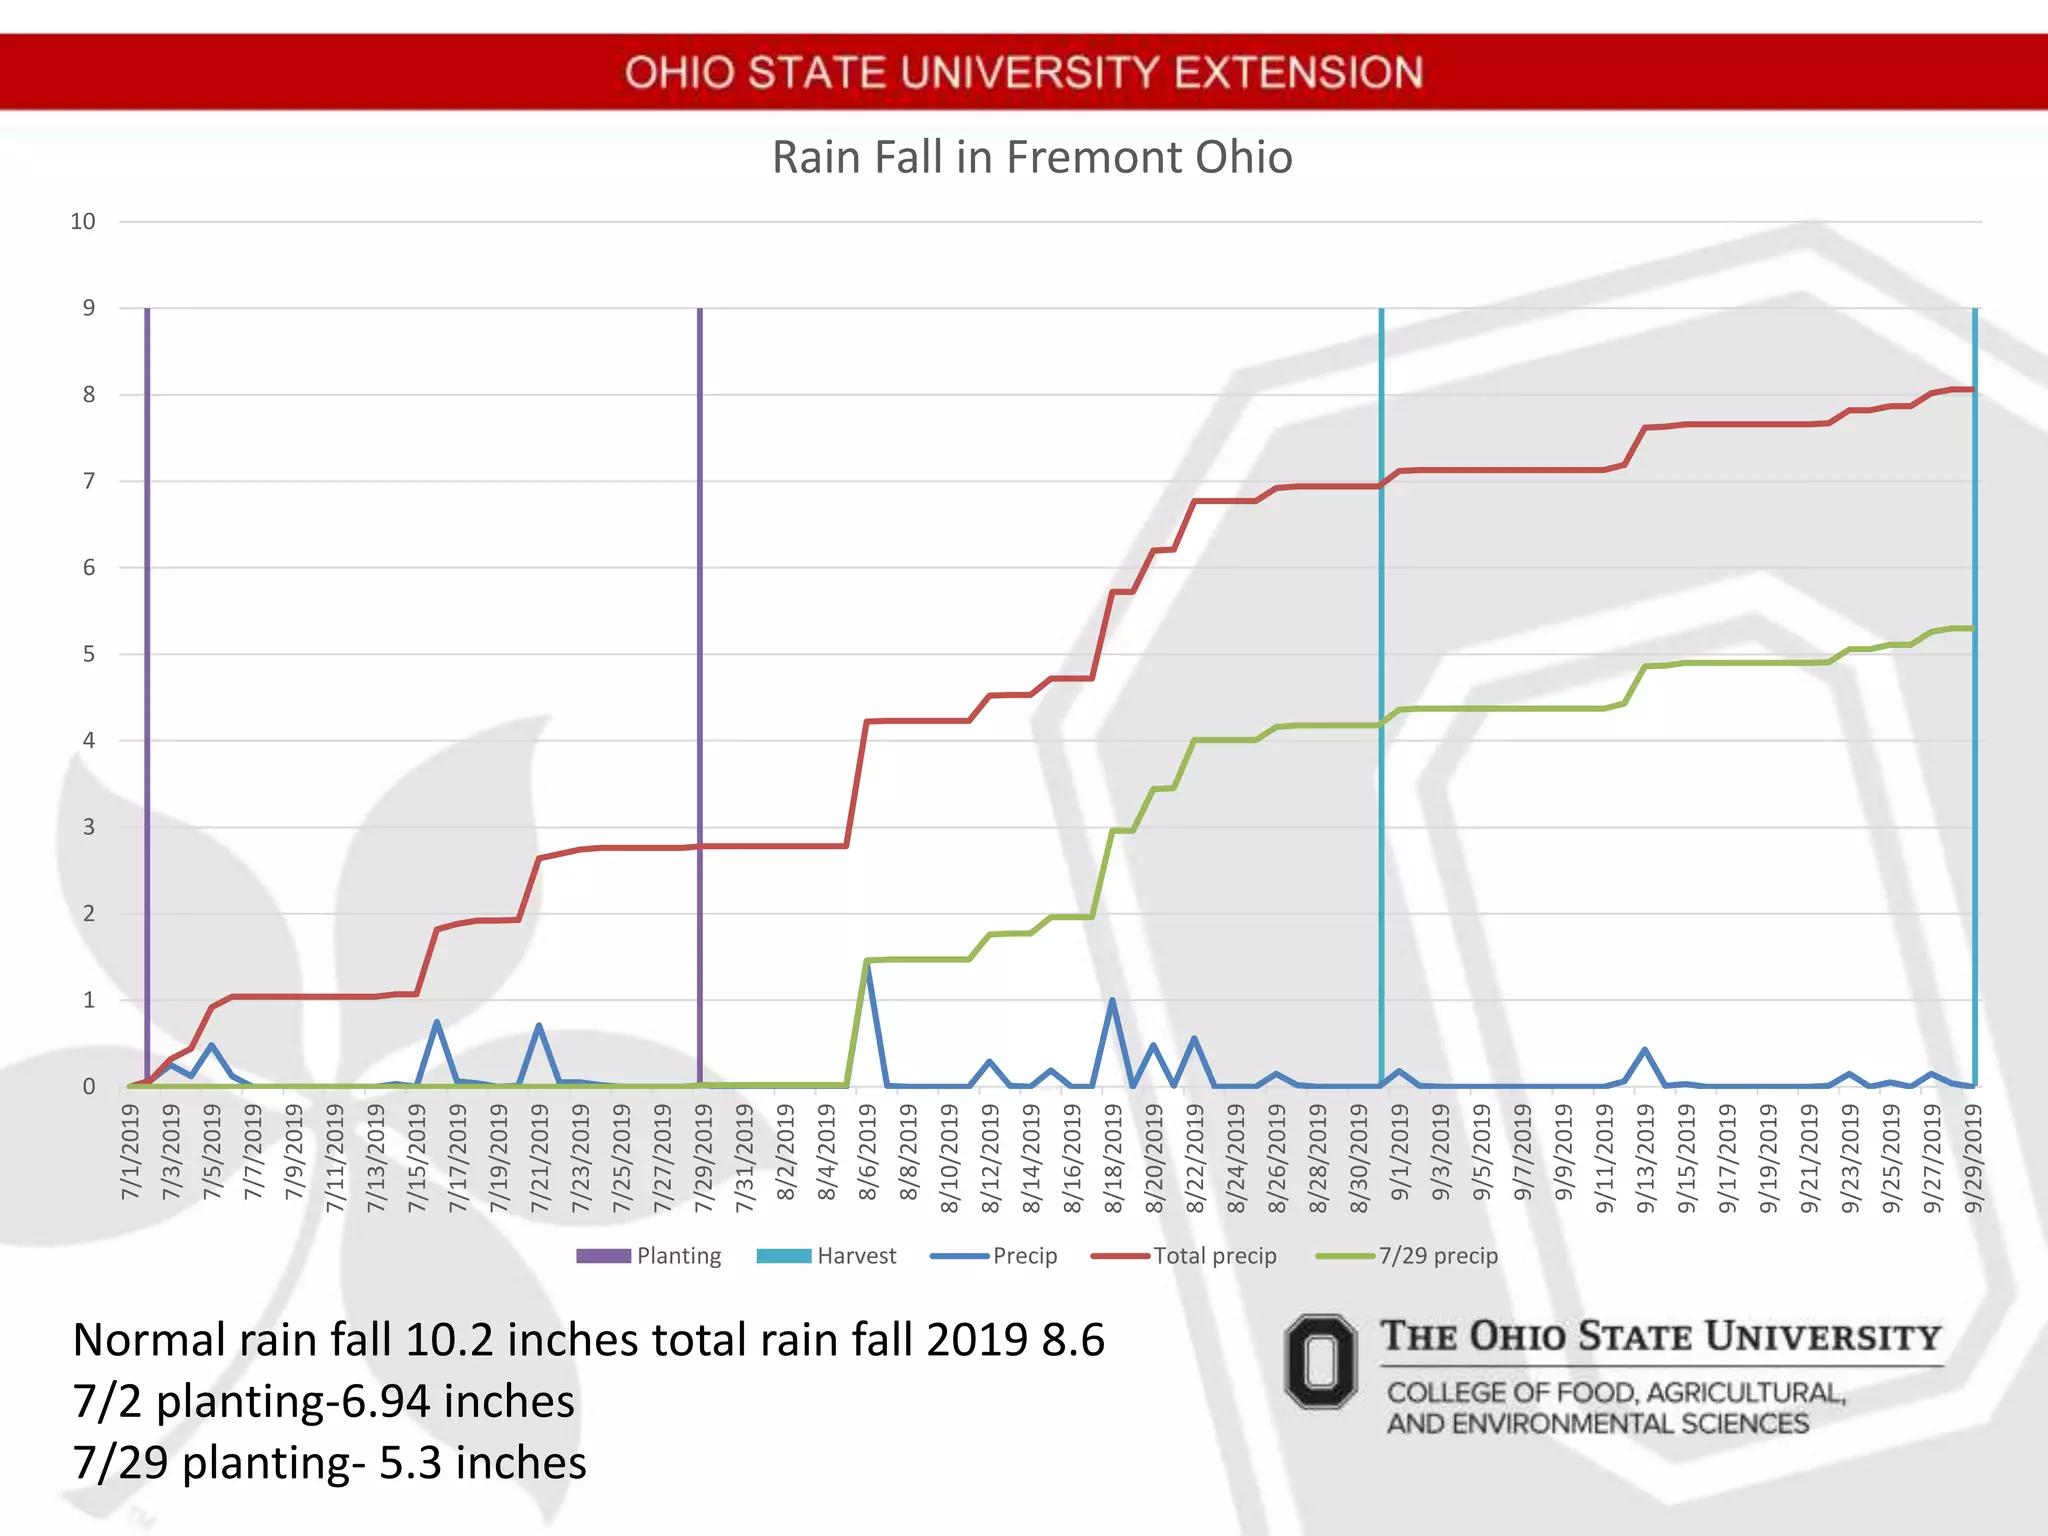


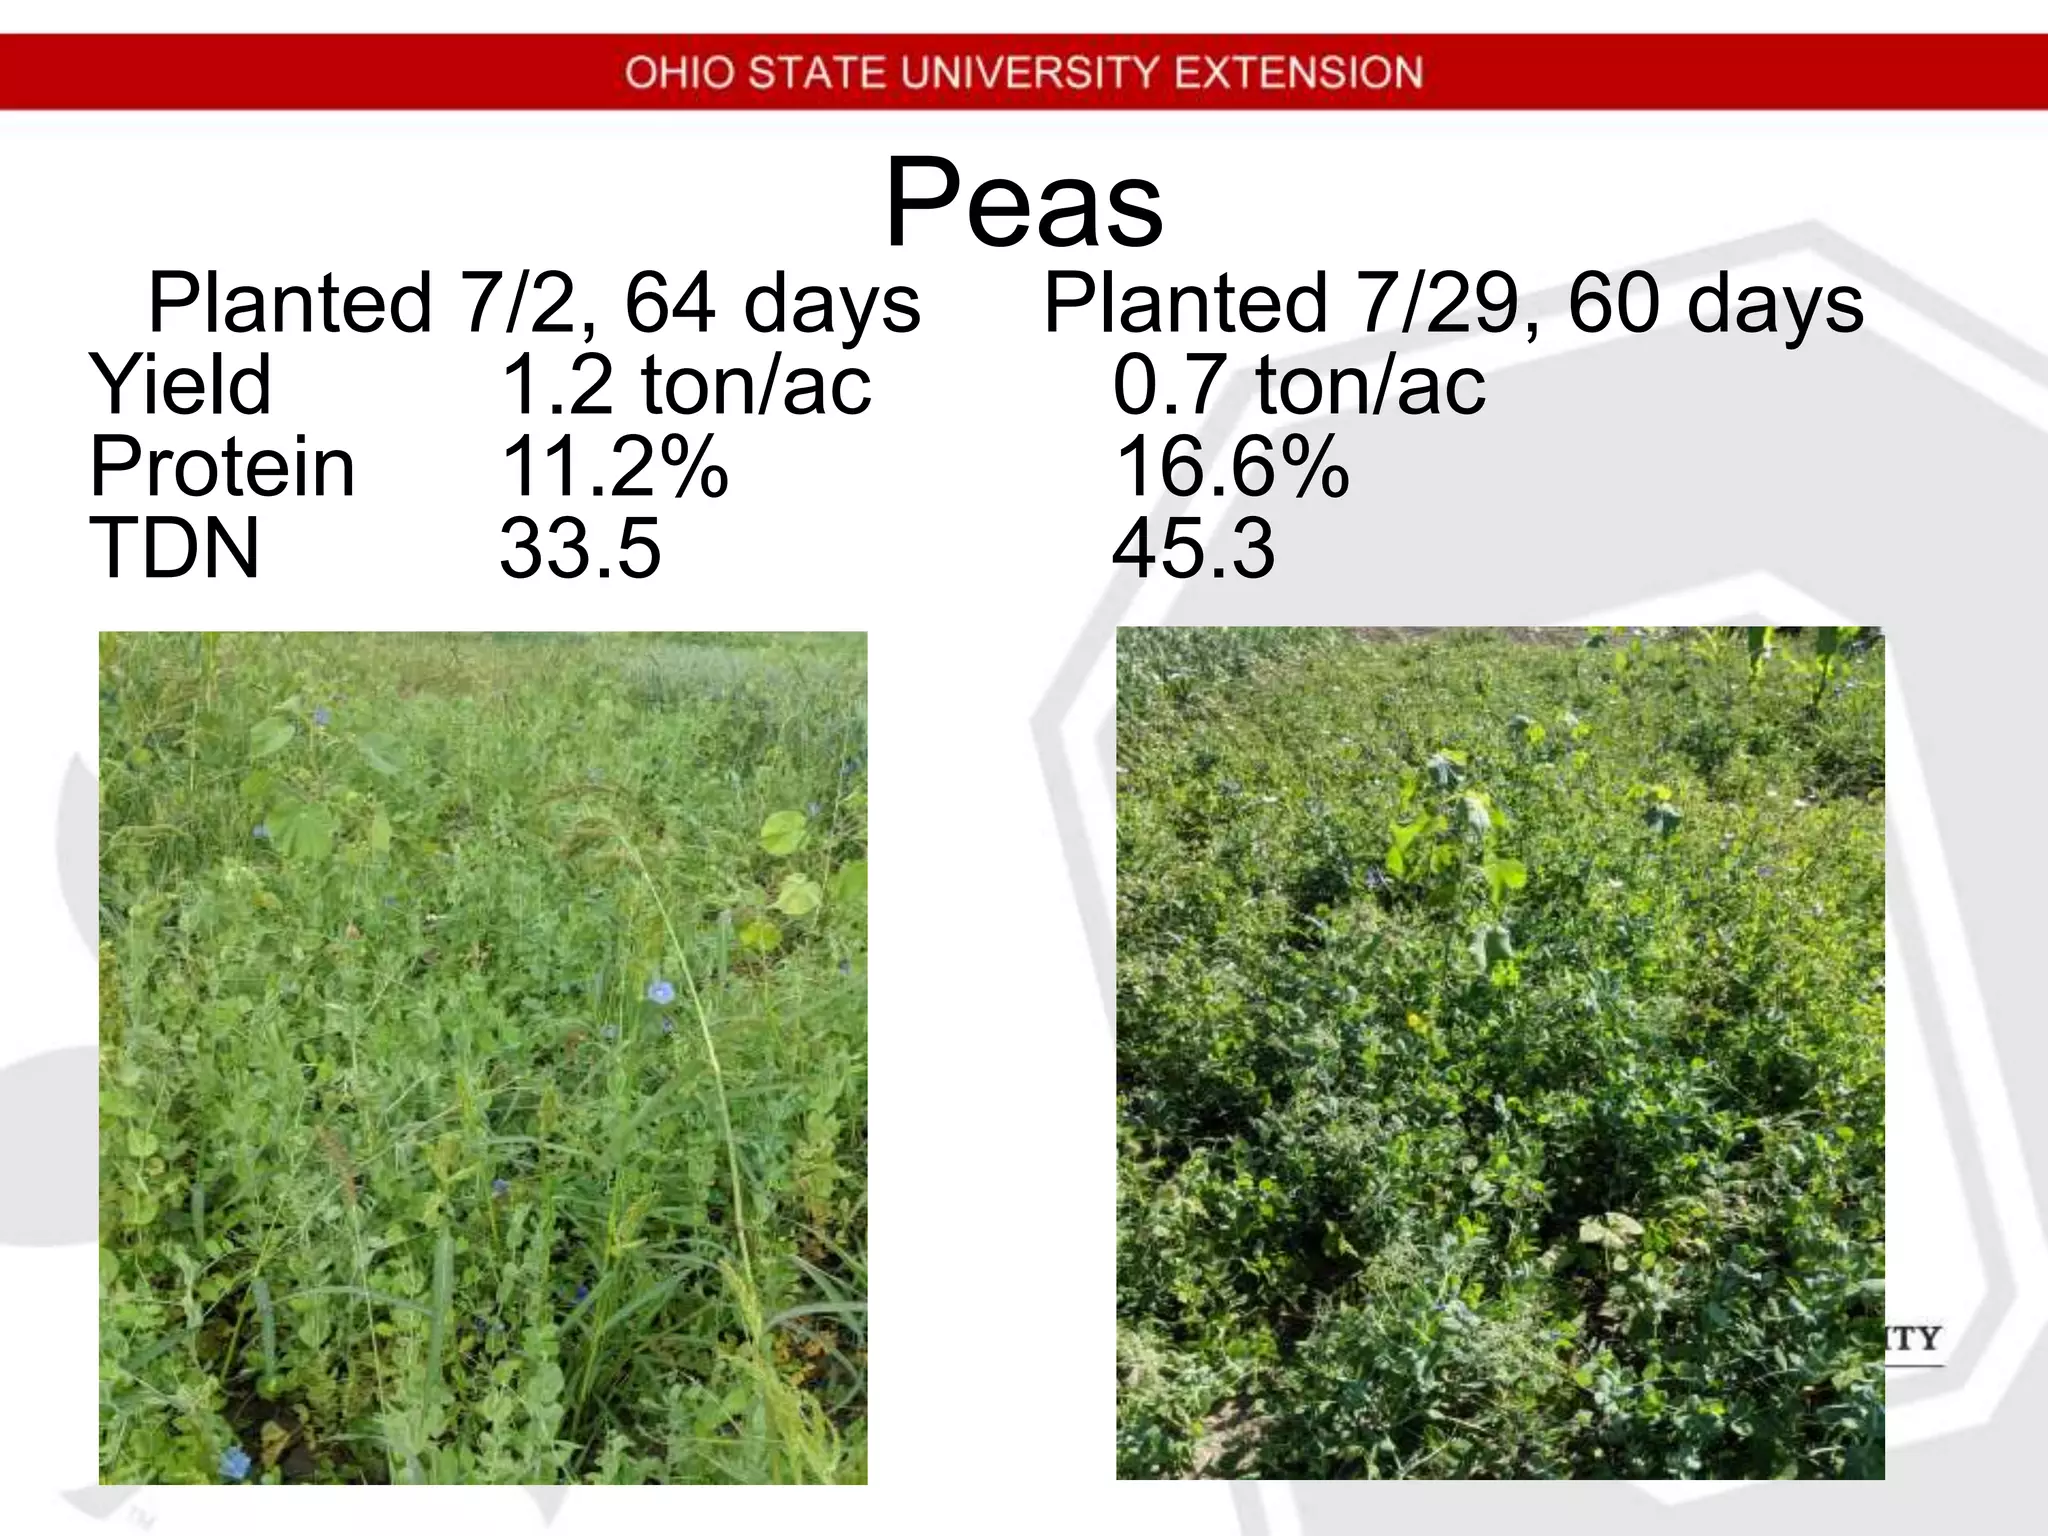
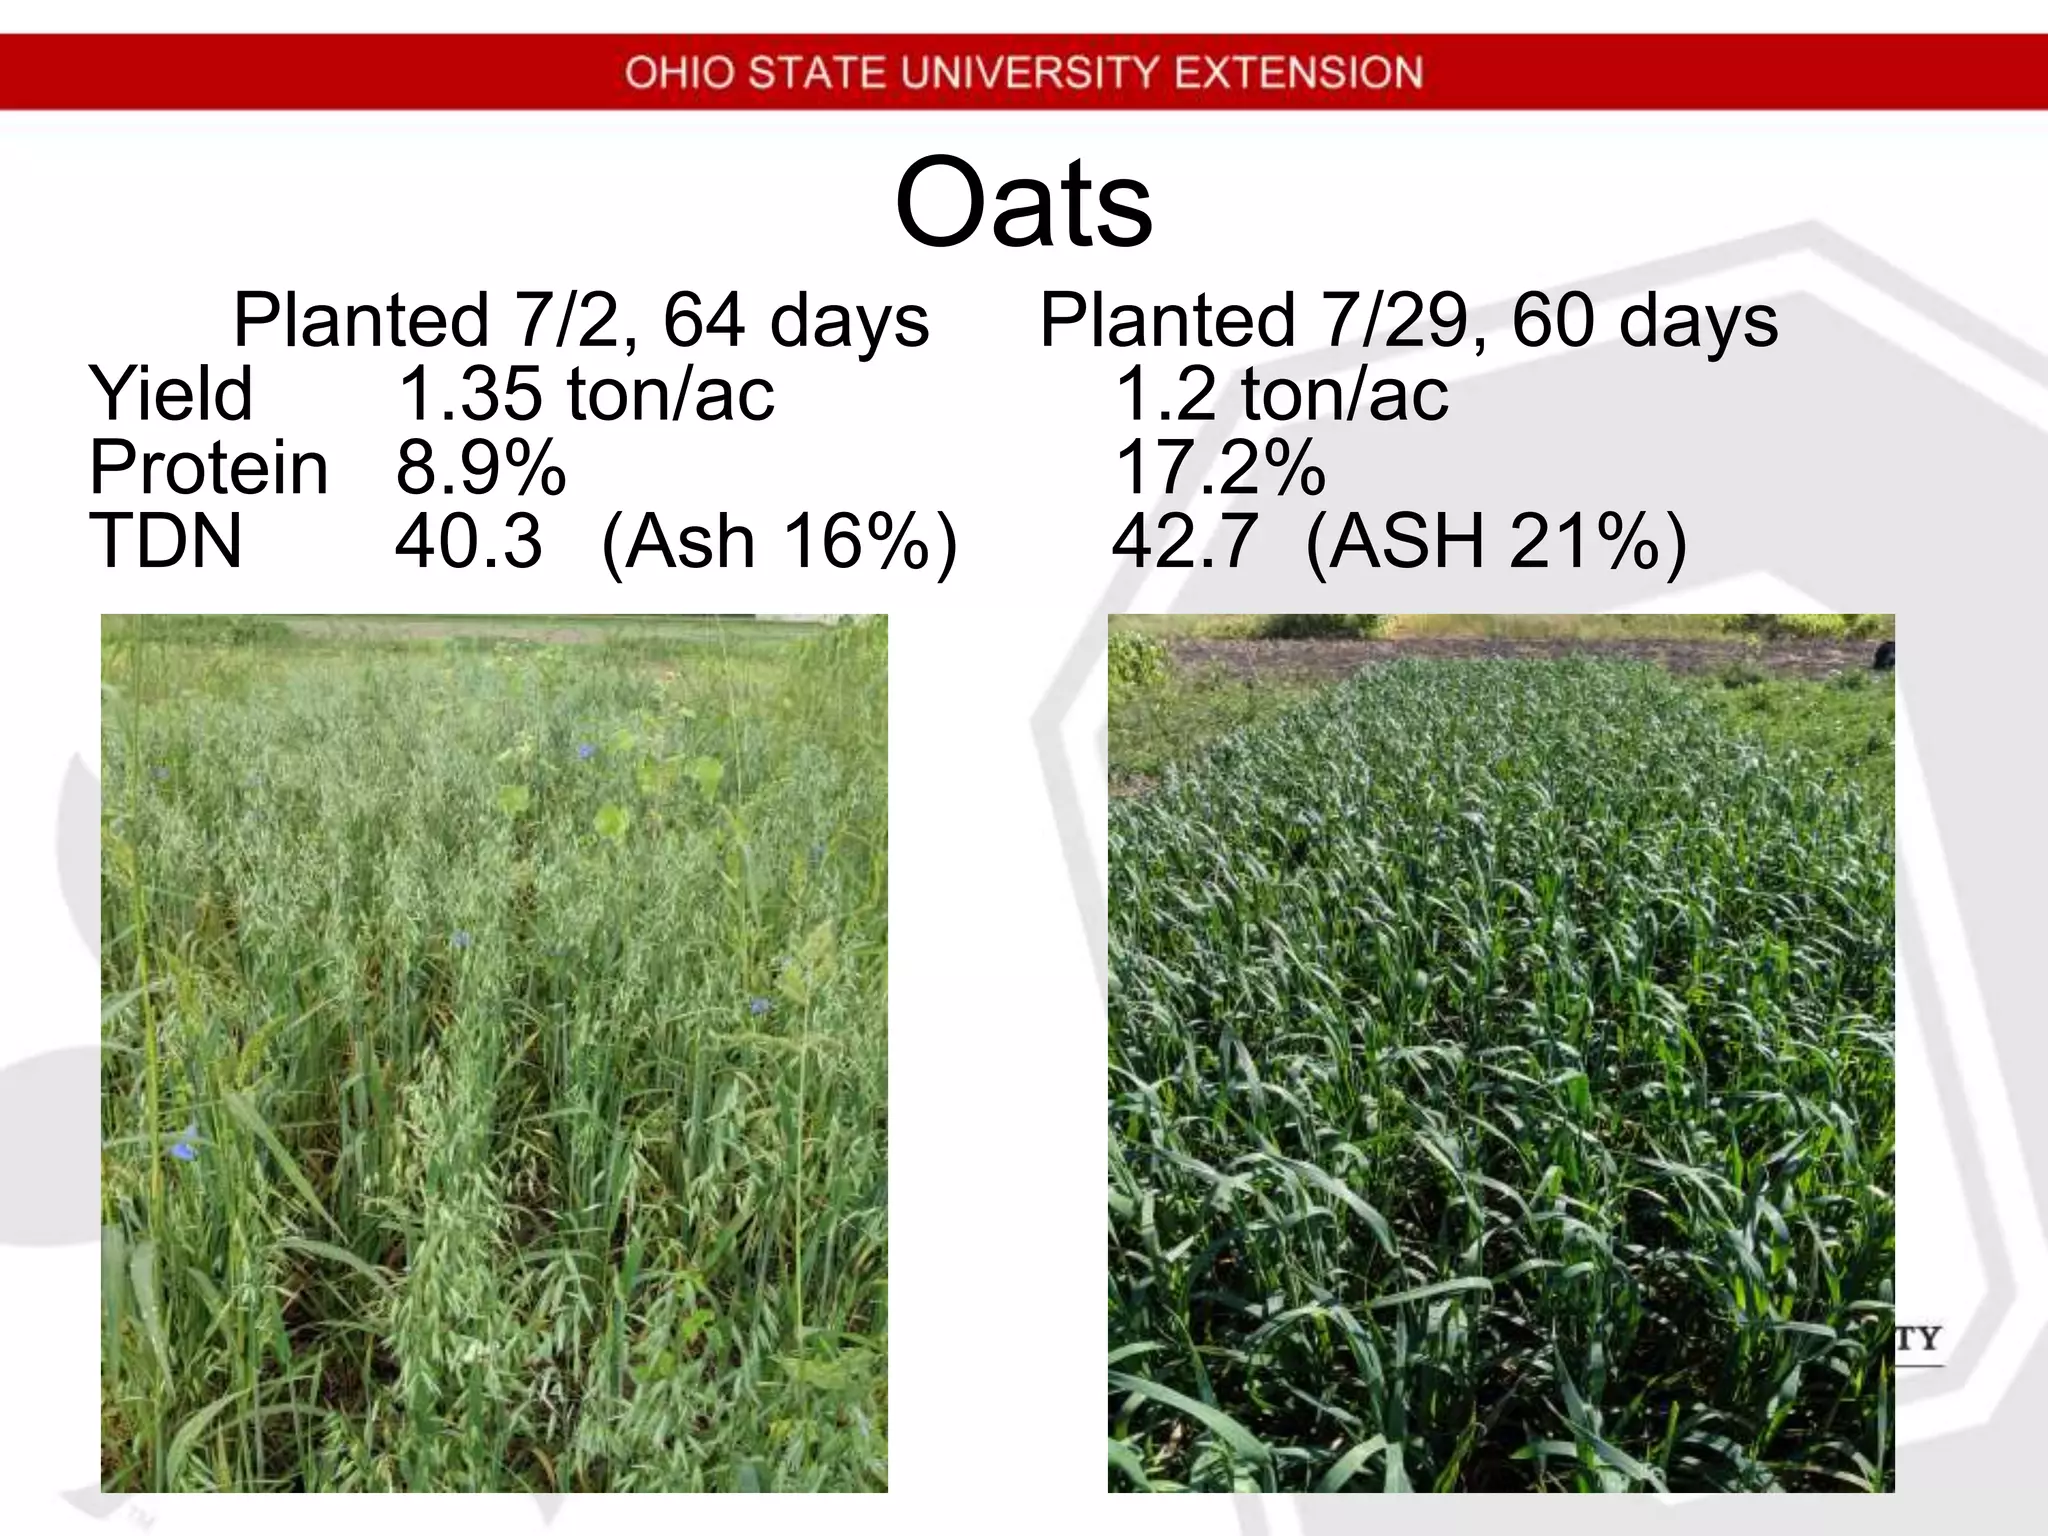
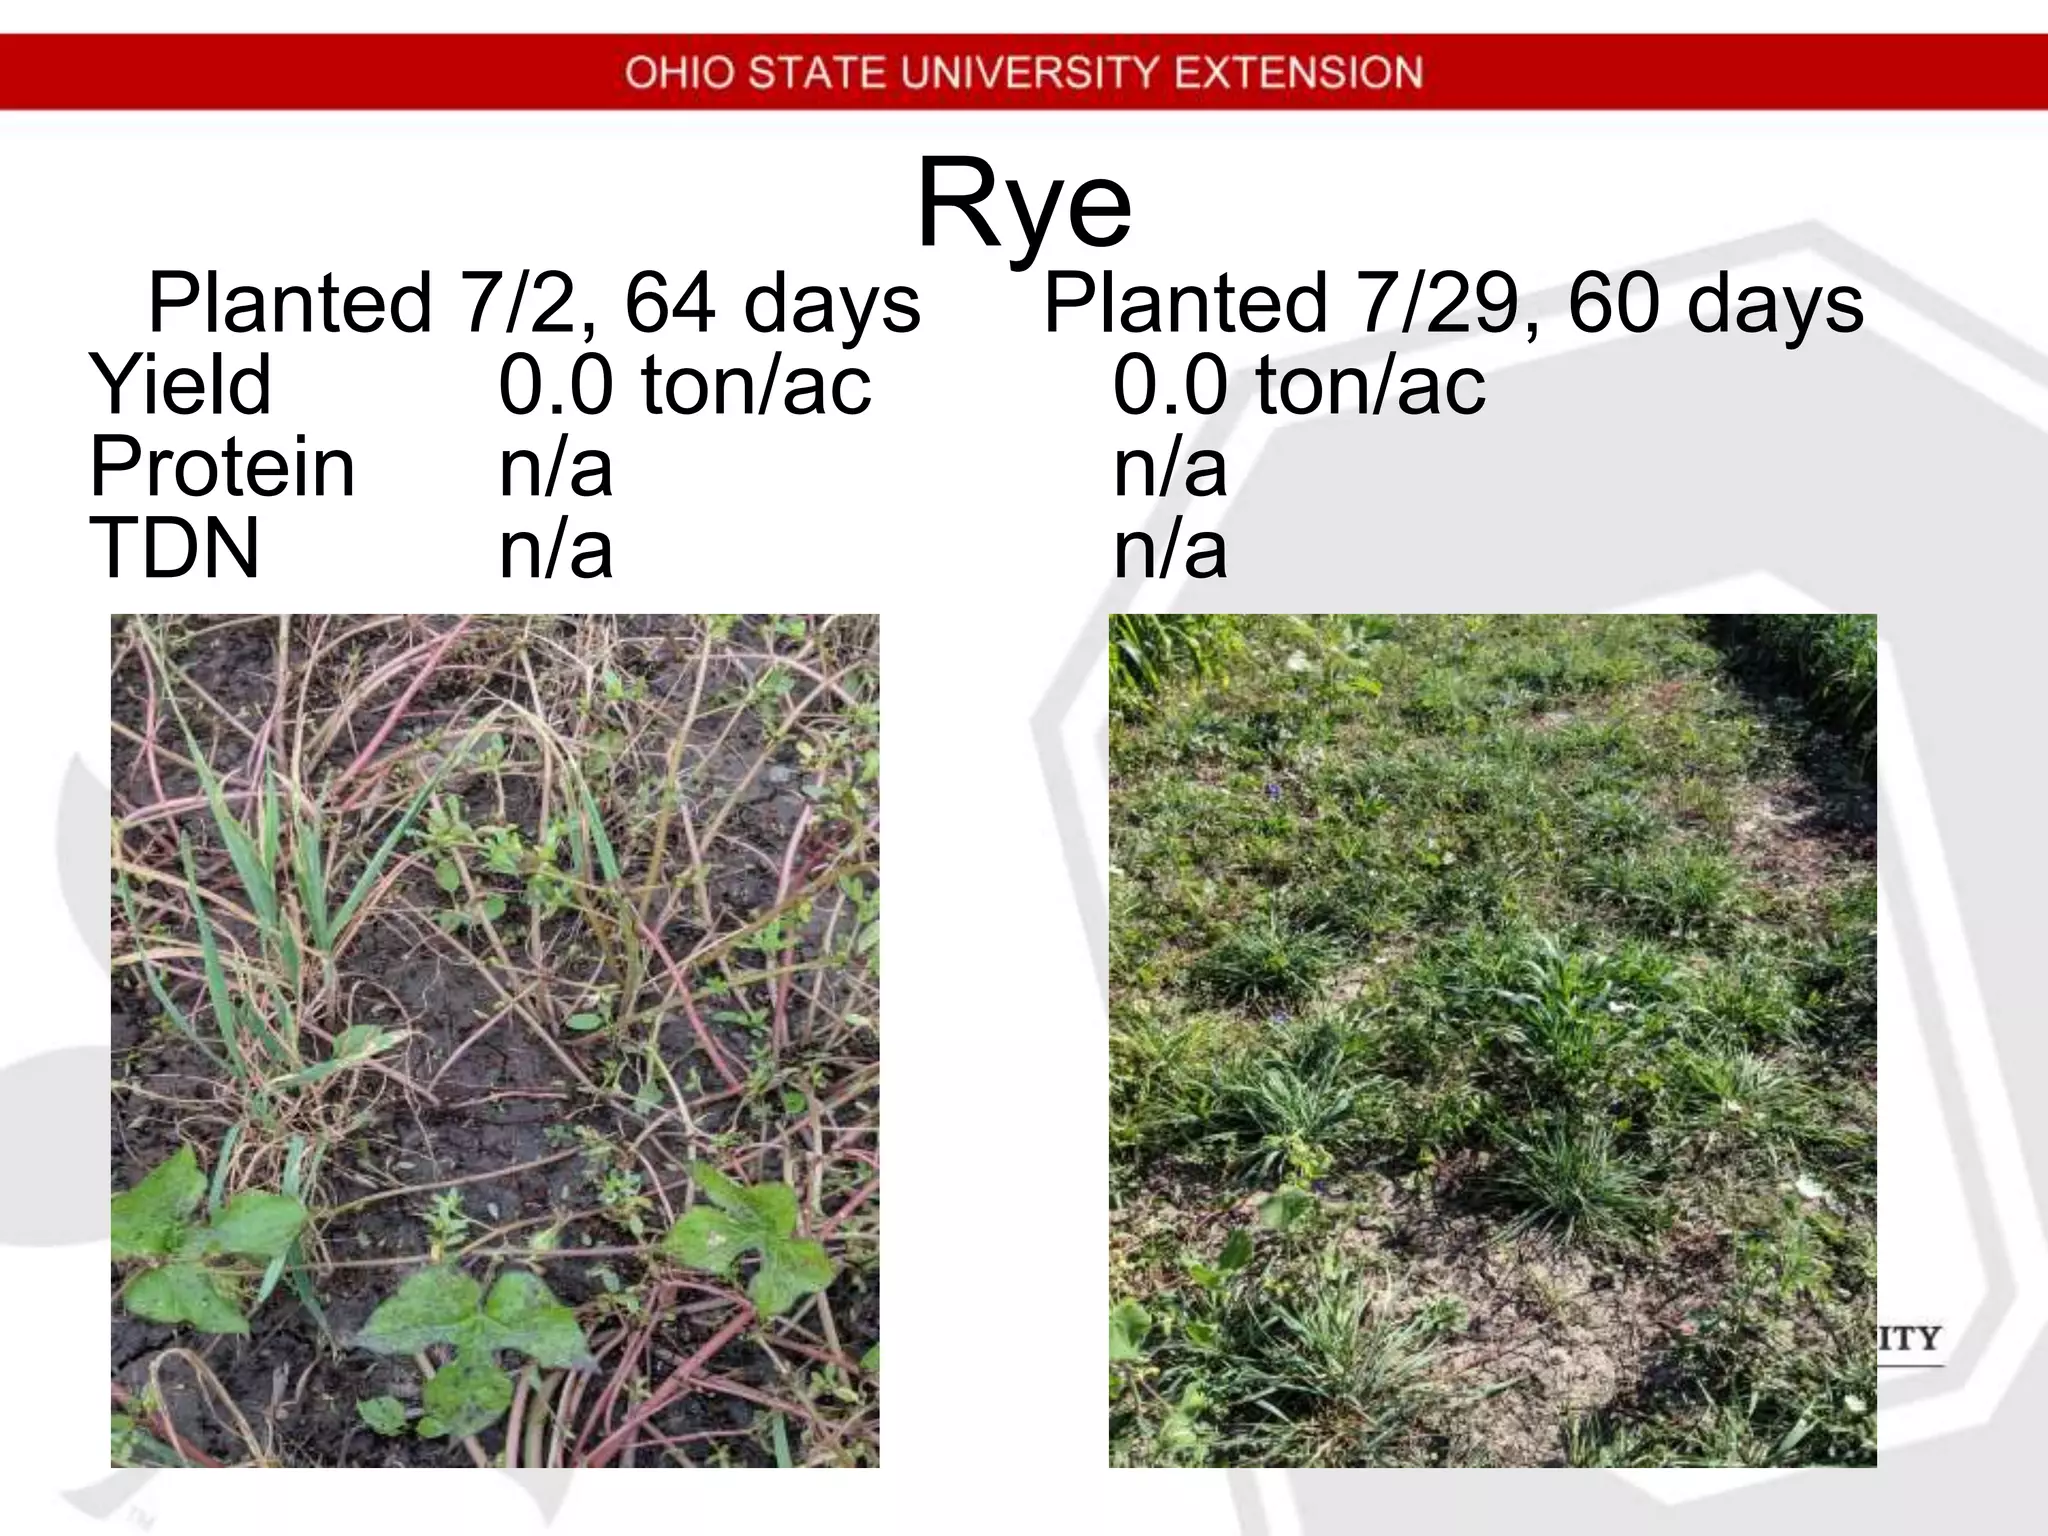


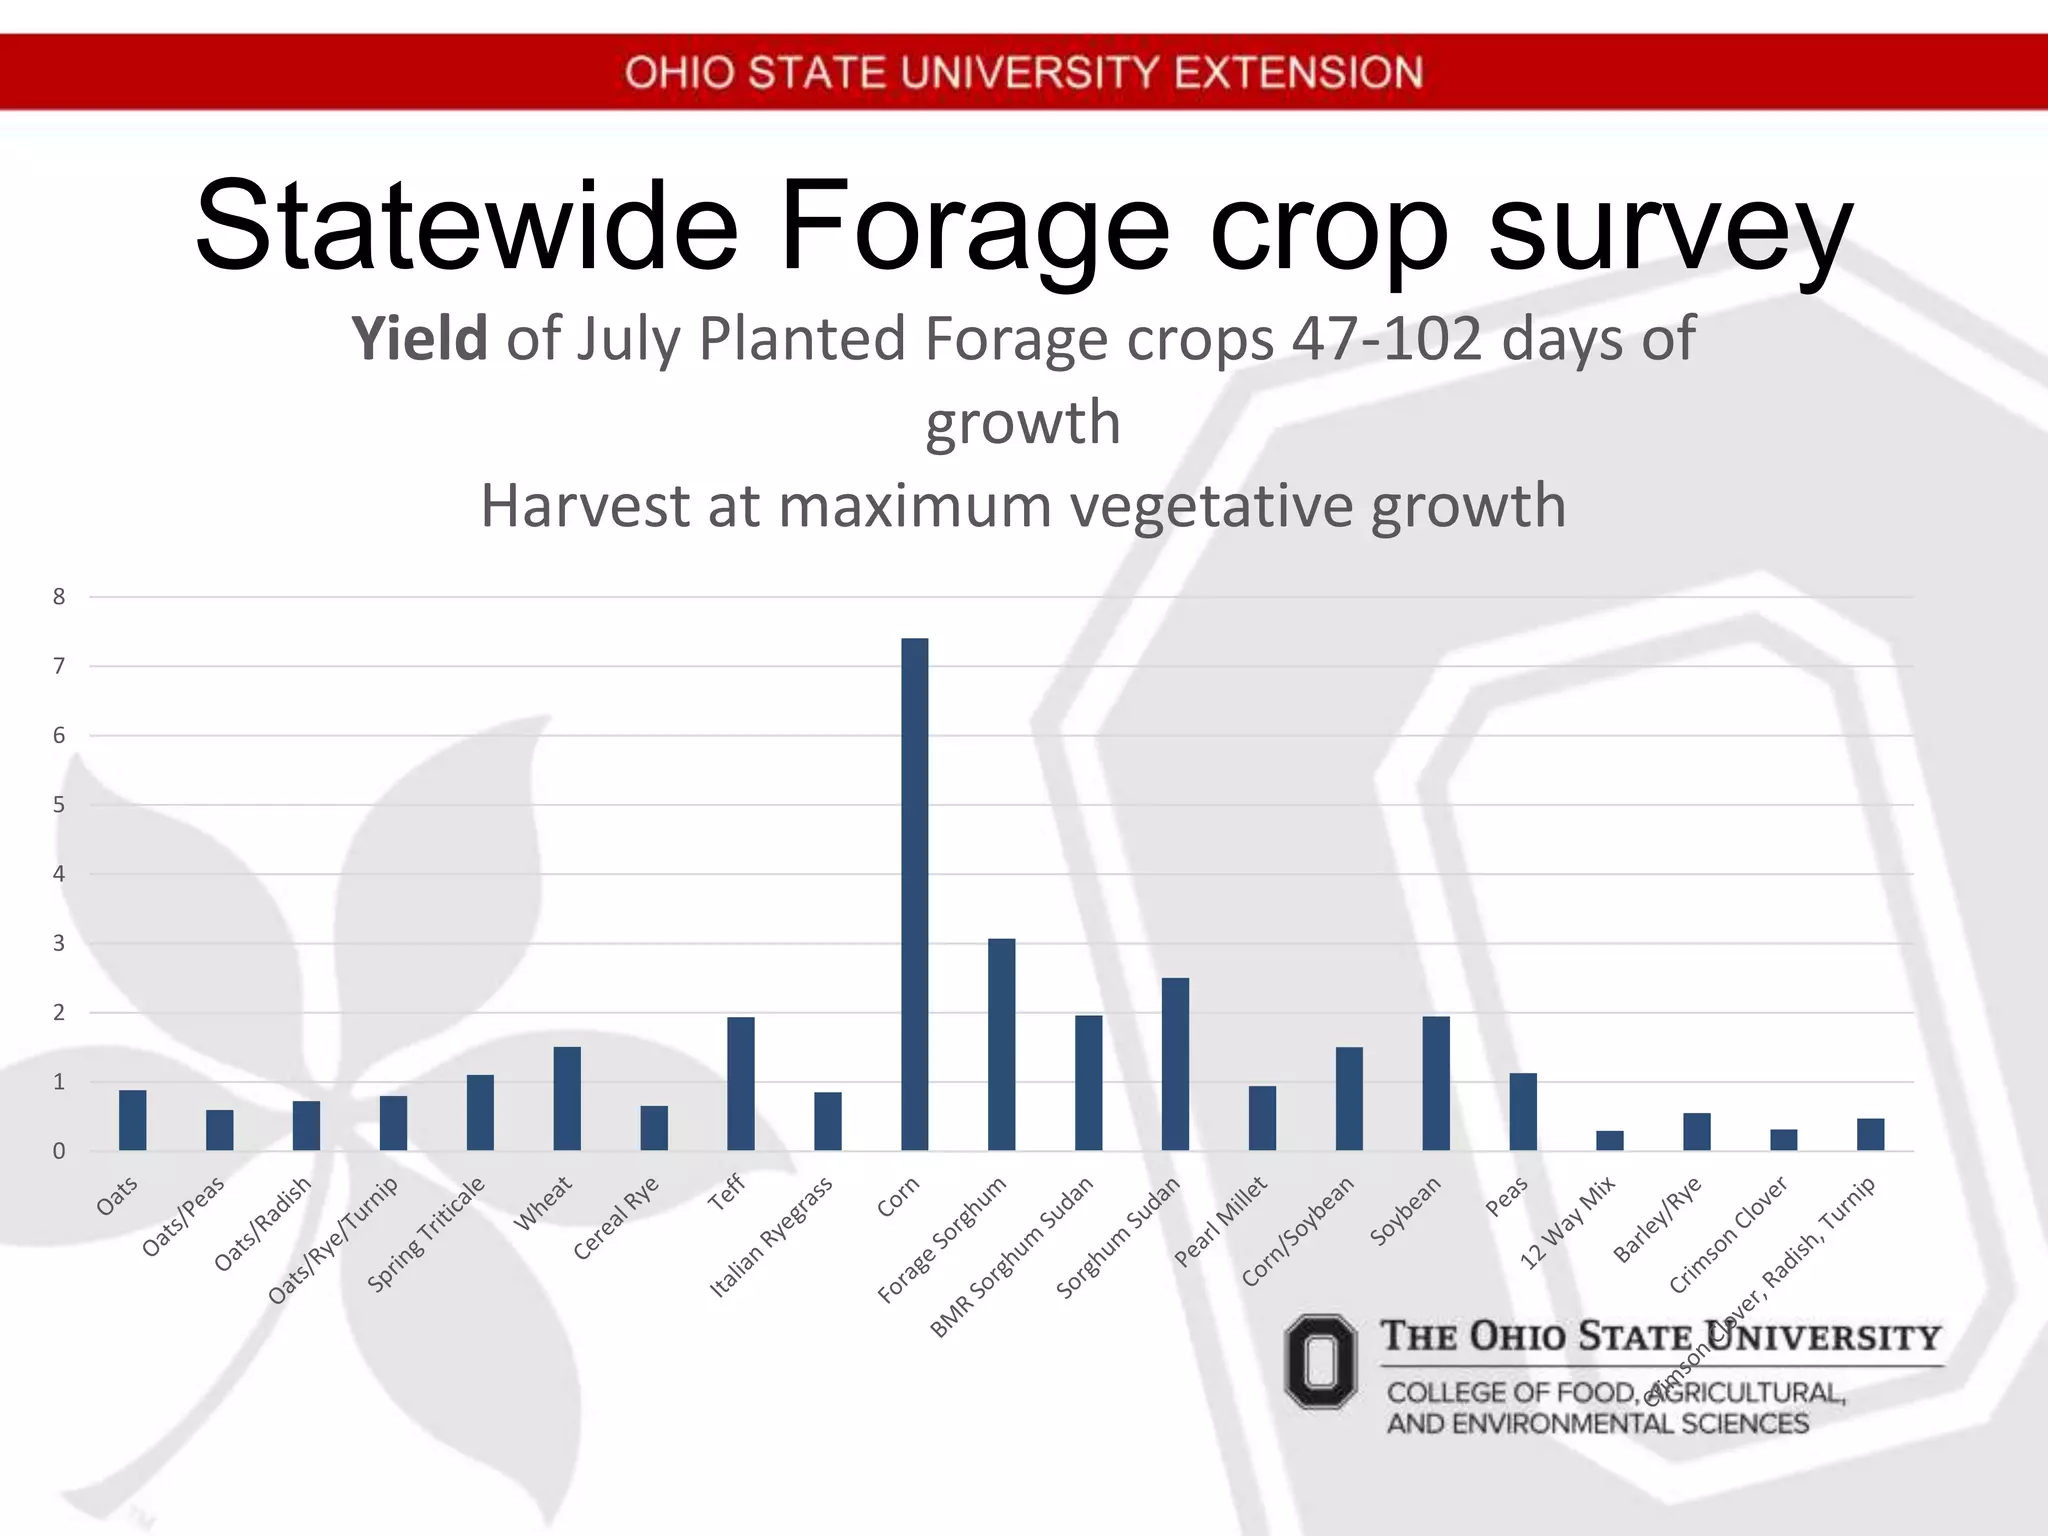


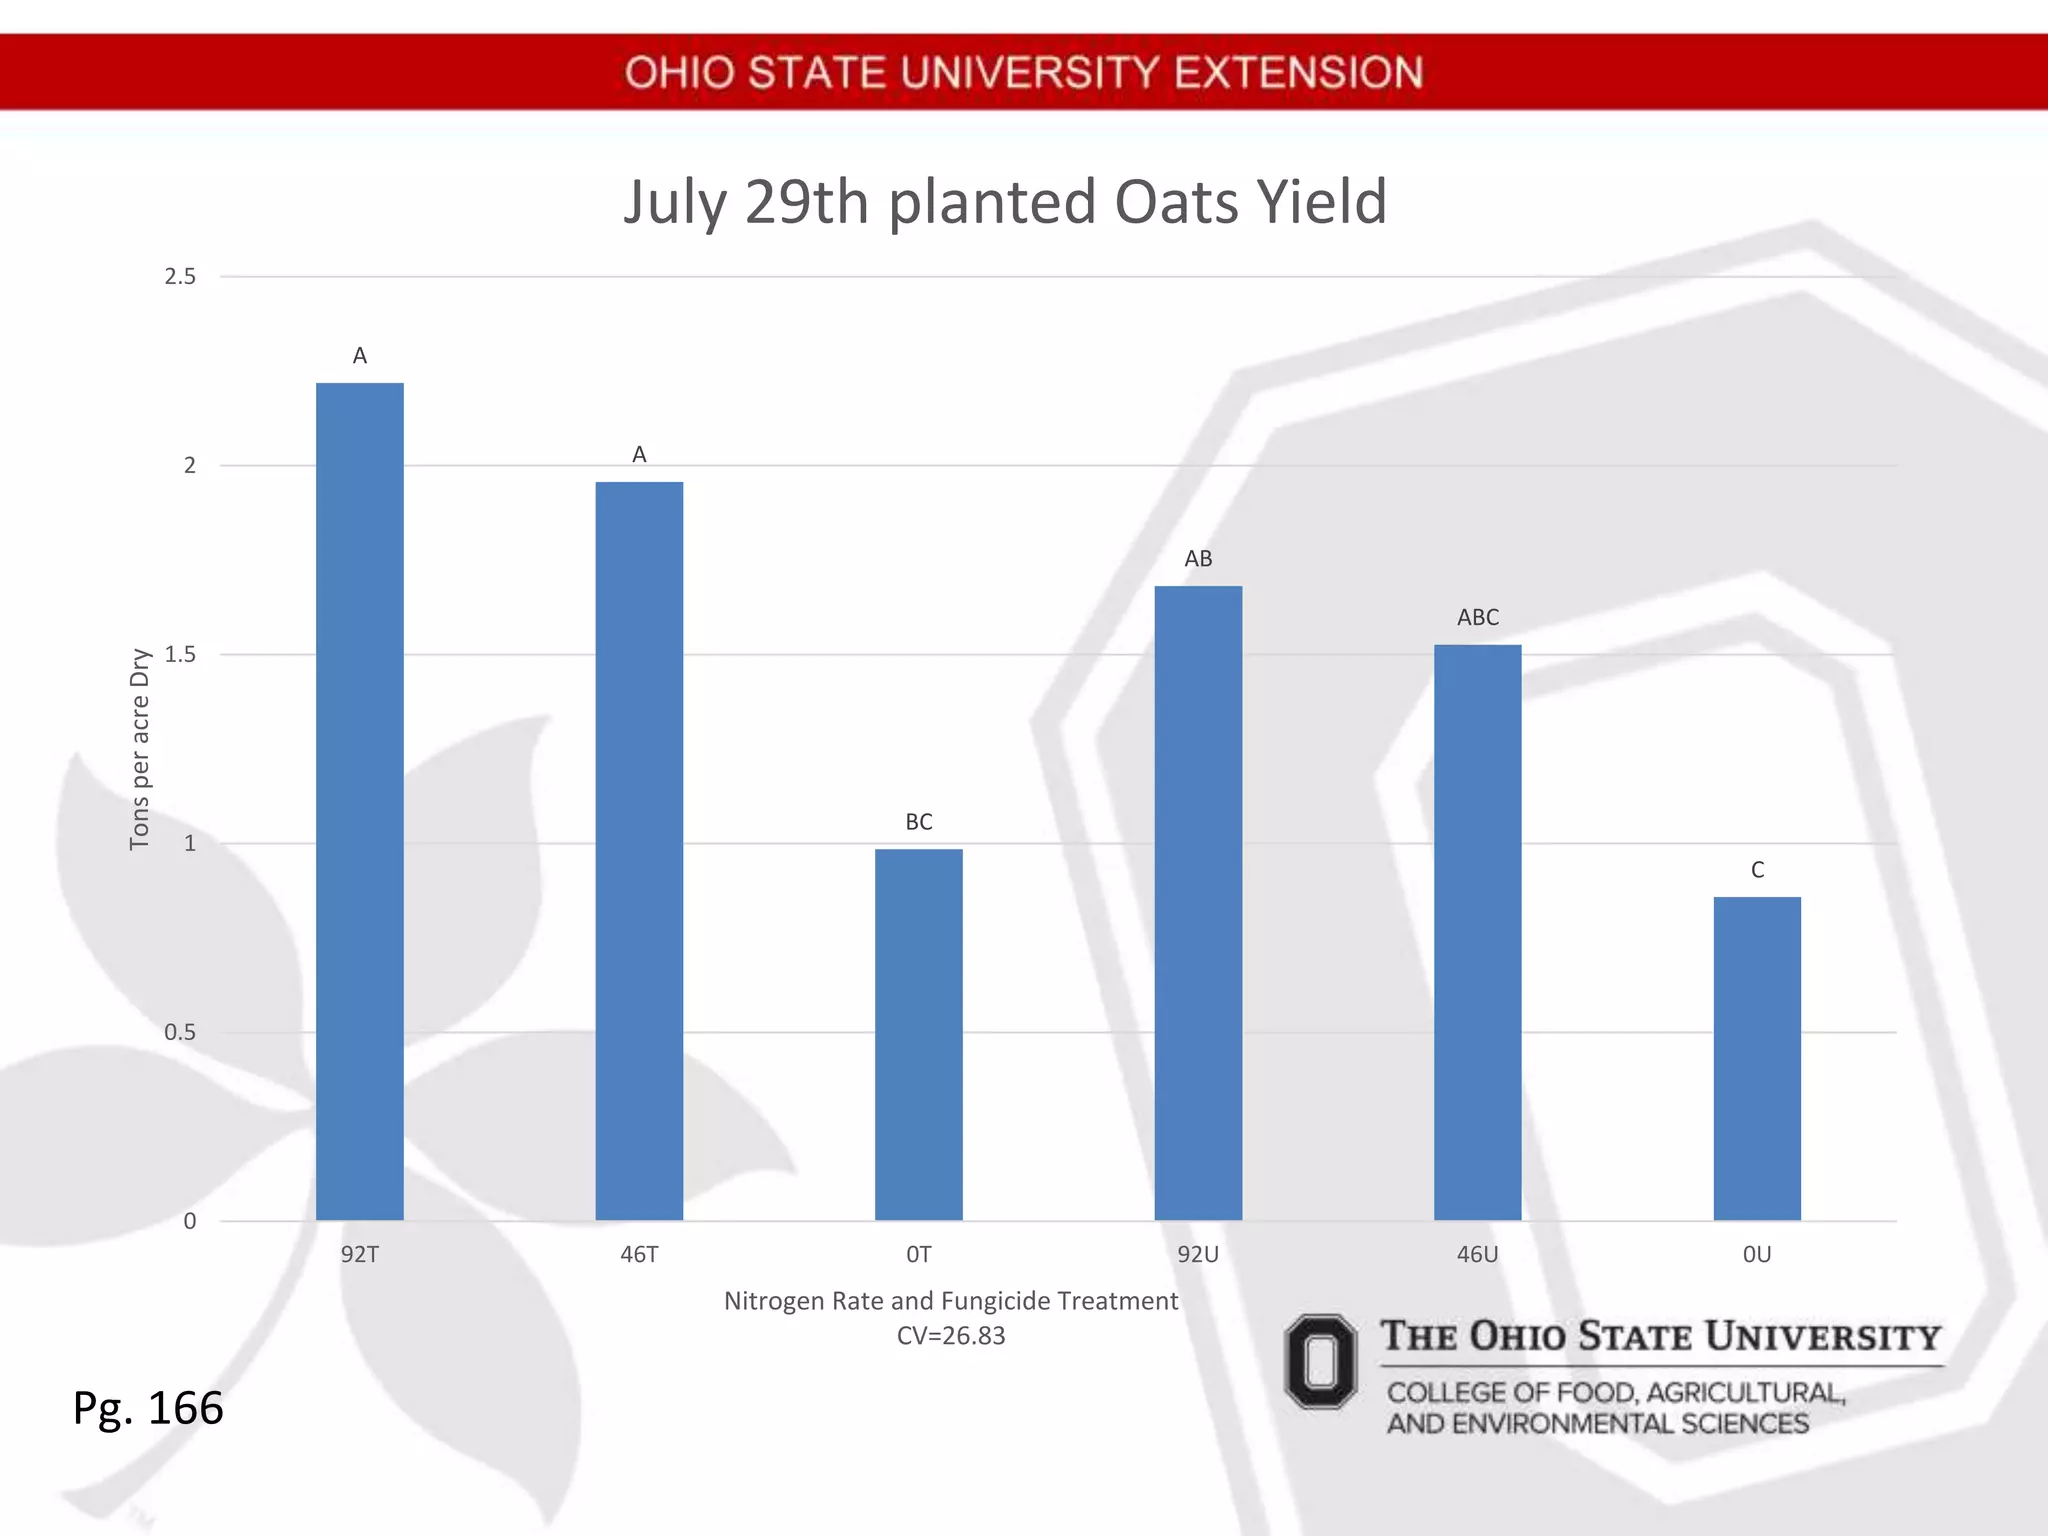


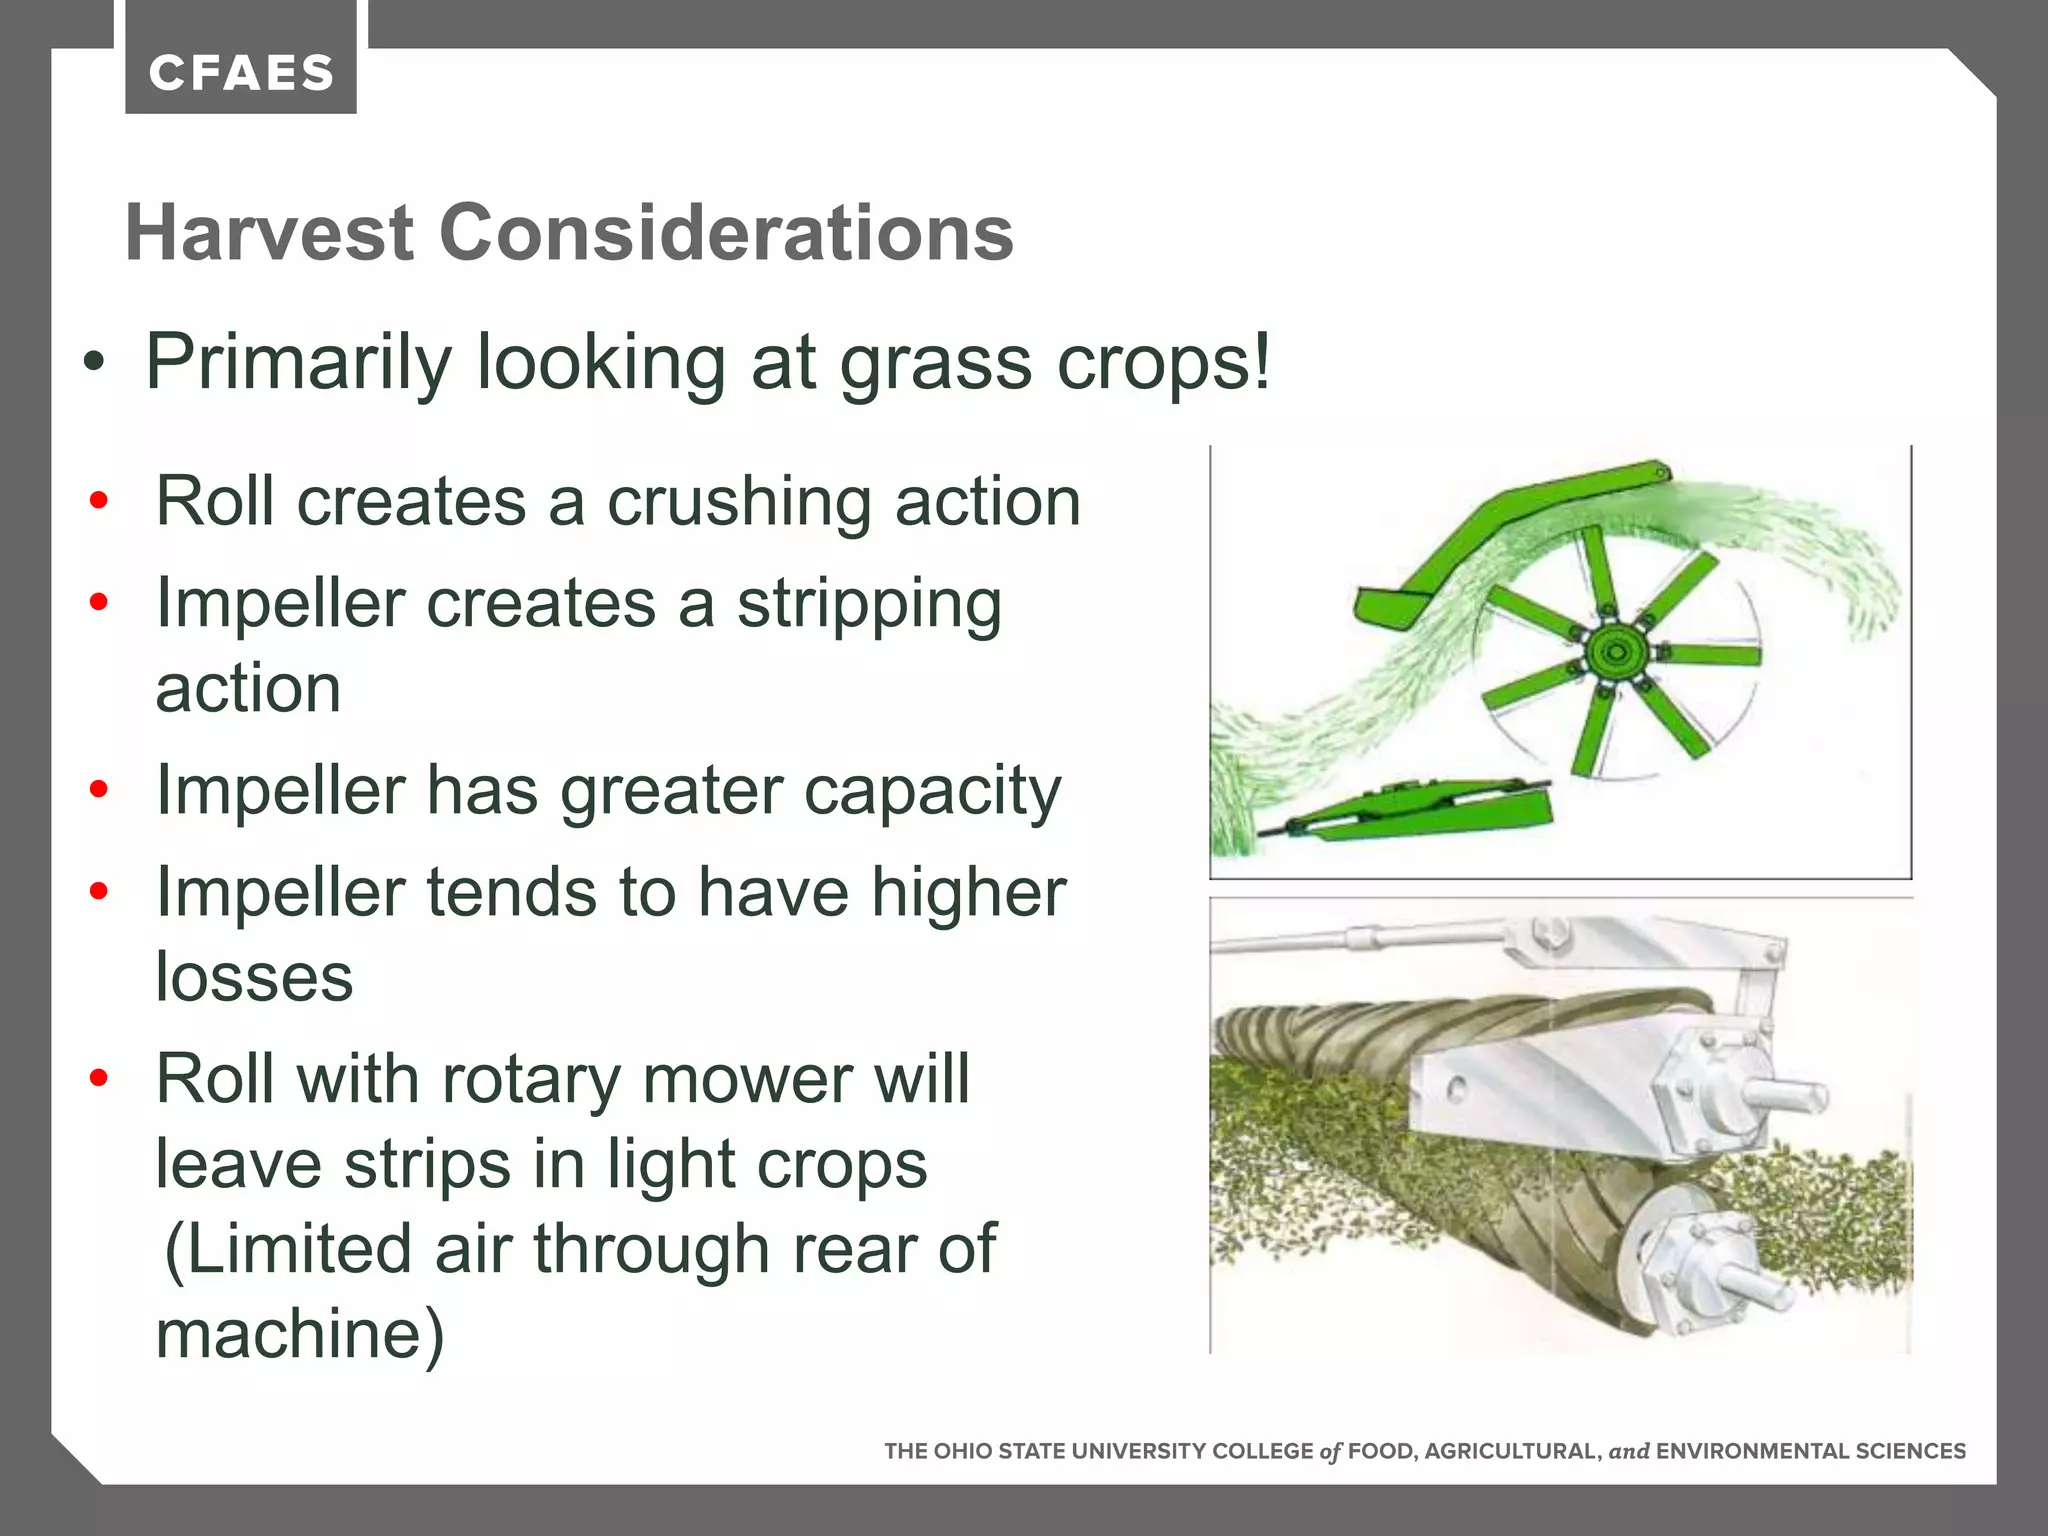


The document outlines various forage crops, their nutritional values, and harvesting practices for livestock management, focusing on factors such as dry matter, crude protein, and fiber content. It includes results from cover crop forage trials and recommendations for selecting and managing these crops for optimal livestock nutrition. Additionally, it offers insights into harvesting techniques and storage preservation to ensure quality forage for feed.