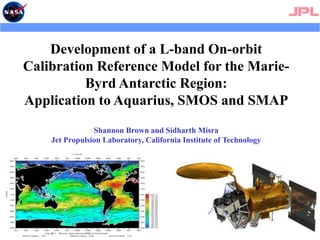
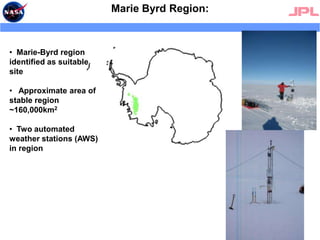
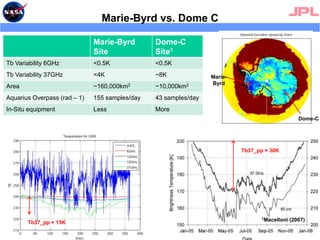
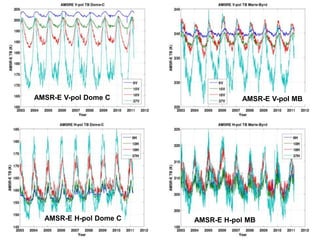
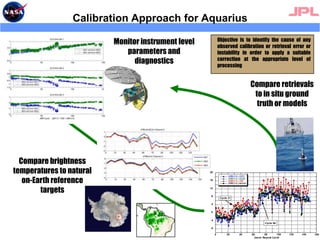
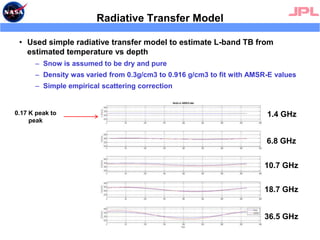
Development of a L-band On-orbit Calibration Reference Model for the Marie-Byrd Antarctic Region: Application to Aquarius, SMOS and SMAPShannon Brown and Sidharth MisraJet Propulsion Laboratory, California Institute of Technology
L-band Radiometer CalibrationCalibration at L-band has become an important issue:  SMOS, Aquarius, SMAPThese radiometers use an internal calibration approach; internal switches and noise diodesRequires external end-to-end calibration reference – pre-launch and on-orbitCalibration techniques developed for radiometers on-board satellite altimeter missions applicableAltimeter radiometers also employ internal calibrationFor Jason series radiometers, calibration referenced to stable on-Earth references2
TBReferences 18-37 GHzTune TB to hot and cold absolute brightness temperature referencesVicarious Cold Reference   (Ruf, 2000, TGARS)Stable, statistical lower bound on ocean surface brightness temperatureAmazon pseudo-blackbody regions (18-40 GHz) (Brown and Ruf, 2005, JTECH)THOT(frequency, incidence angle, Local Time, Time of year)SSM/I 37.0 GHz V-pol – H-pol TBTechniques recently used to generate 13-year climate data record from Topex radiometer data (Brown et al. 2009, JTECH)
Used on-Earth references to remove long-term drift, instrument temperature dependence and antenna pattern correction errorsHot Reference Targets
AMSR-E De-polarizationDeveloping On-Earth TB Calibration References at L-bandNatural targets for L-band radiometer calibration over on-Earth dynamic rangeCalm, flat ocean scenes – Cold referenceIce sheets: Antarctica (e.g. Dome-C), Greenland – Mid-range referenceLand areas:  flat, dry deserts; homogeneous heavily vegetated regions – Hot referenceUse to assess absolute calibration, monitor stability and assess residual instrument calibration errors37 V-H23 V-H18 V-H10 V-H6 V-H
Use match-ups between Aquarius and ocean altimeters to identify observations over calm seasCompare Aquarius to modeled TBCalm ocean surface reduces model uncertainty – nearly specular emissionModel inputs (e.g. SST, SSS) from ancillary data sourcesSort comparisons to identify residual errors in corrections (e.g. solar, galactic, ionosphere)Significant number of match-ups with minimal temporal and spatial difference (1 hr/100km)5Cold TB ReferenceNumber of match-ups per 1o bin – all horns
Cold Scene Stability MonitoringUsed simulated data to assess resolution of methodCompare TBs to model to look for jumps/drifts6TBV – Model : Horn 1  Inter-channel double difference : Horn 1Over range of 0 < WS < 5 m/sAssumes 0.5C SST knowledge and 0.5psu SSS knowledge
Antarctic Calibration ReferenceRecent work has shown Dome-C as suitable candidate for an on-Earth L-band reference (Floury et al., 2002; Macelloni et al. 2006 ; Macelloni et al. 2007)Region is heavily instrumented and studied, but small in sizeParticularly for Aquarius, larger site desired due to fixed independent radiometer beamsUsed AMSR-E to search for other suitable Antarctic calibration sitesIdentified other regions with low spatial and temporal variability of surface and deep ice temperatureAquarius 3-beams
Temporal stability at 6 and 37 GHz6.9 GHz37 GHz Regions below 0.5K std.dev chosen for 6GHz
 Regions below 4K std.dev chosen for 37GHz
 Spatial stability of region evaluated by searching for contiguous thermally stable sets within a 150km radiusMarie Byrd Region:  Marie-Byrd region identified as suitable site
   Approximate area of stable region ~160,000km2
  Two automated weather stations (AWS) in regionCharacteristics of Marie-Byrd Region10Accumulation in Marie-Byrd region ~30cm/yr, higher than in East AntarcticaGentle upward slope from north to south across the regionSurface density  ~350kg/m-3 with firn-ice transition around 64 m (Gow 1968)Accumulation RateRubin and Giovinetto 1962Cuffey and Patterson 2010
Characteristics of Marie-Byrd RegionWarmer surface temperatures in Marie-Byrd region than East Antarctica11Mean Surface TemperatureCosimo2000
126.9 GHz H-pol37 GHz H-pol6.9 GHz V-pol37 GHz V-pol
1337 GHz H-pol6.9 GHz H-pol37 GHz V-pol6.9 GHz V-pol
Marie-Byrd vs. Dome CMarie-ByrdDome-CTb37_pp = 30K1Macelloni (2007)Tb37_pp = 15K
15AMSR-E V-pol Dome CAMSR-E V-pol MBAMSR-E H-pol Dome CAMSR-E H-pol MB
`16AMSR-E  6 GHz H-polAMSR-E  6 GHz V-polAMSR-E  37 GHz H-polAMSR-E  37 GHz V-pol
Long Term Temperature Stability at Marie-ByrdAMSR-E 6 GHz TB stable to ~0.2K from 2003 to 2011
6 GHz TB stable to <0.1K over last 5 yearsAnnual averaged surface temperature from Byrd AWS stable to ~1C from 1980 – 200017
Development of Coupled Forward ModelUse model to transfer calibration from higher frequencies radiometers to L-bandModel couples an ice heat-transport equation and radiative-transfer equationConstrain model using AMSR-E and in situ AWS dataconstrain density profile, temperature profile and grain sizePredicts brightness temperature at L-bandUse as a calibration referenceTracking calibration stability over time
Sensitive to heat-transport model, but temporal variability small
Lower uncertainty on monthly or longer time scales
Inter-satellite calibration
Use region to assess calibration between sensors – daily observations
Model used to account for differences in incidence angle
Assessing absolute calibration
Uncertainty dependent on radiative transfer model
Evaluate several models to estimate uncertaintySurface temperature values obtained from AWS stations used as top boundary condition, with its mean as the bottom boundary conditionOnly considered annual harmonicUsed simple radiative transfer model assuming layered ice to estimate L-band and C-band V-pol TB annual signalsummerwinterautumnspring
206.9 GHz H-polSMOS 55o H-poldfSMOS 55o V-pol6.9 GHz V-pol
Time Series ComparisonMonthly averaged SMOS TB at 55o incidence angle compared to AMSR-E 6.9 GHz channel for June 2010 to June 2011Observed annual signal at L-band higher than expected21AMSR-E 6.9 GHz and SMOS V-polAMSR-E 6.9 GHz and SMOS H-pol

IGARSS_Brown_Aquarius_2011.pptx

  • 1.
    Development of aL-band On-orbit Calibration Reference Model for the Marie-Byrd Antarctic Region: Application to Aquarius, SMOS and SMAPShannon Brown and Sidharth MisraJet Propulsion Laboratory, California Institute of Technology
  • 2.
    L-band Radiometer CalibrationCalibrationat L-band has become an important issue: SMOS, Aquarius, SMAPThese radiometers use an internal calibration approach; internal switches and noise diodesRequires external end-to-end calibration reference – pre-launch and on-orbitCalibration techniques developed for radiometers on-board satellite altimeter missions applicableAltimeter radiometers also employ internal calibrationFor Jason series radiometers, calibration referenced to stable on-Earth references2
  • 3.
    TBReferences 18-37 GHzTuneTB to hot and cold absolute brightness temperature referencesVicarious Cold Reference (Ruf, 2000, TGARS)Stable, statistical lower bound on ocean surface brightness temperatureAmazon pseudo-blackbody regions (18-40 GHz) (Brown and Ruf, 2005, JTECH)THOT(frequency, incidence angle, Local Time, Time of year)SSM/I 37.0 GHz V-pol – H-pol TBTechniques recently used to generate 13-year climate data record from Topex radiometer data (Brown et al. 2009, JTECH)
  • 4.
    Used on-Earth referencesto remove long-term drift, instrument temperature dependence and antenna pattern correction errorsHot Reference Targets
  • 5.
    AMSR-E De-polarizationDeveloping On-EarthTB Calibration References at L-bandNatural targets for L-band radiometer calibration over on-Earth dynamic rangeCalm, flat ocean scenes – Cold referenceIce sheets: Antarctica (e.g. Dome-C), Greenland – Mid-range referenceLand areas: flat, dry deserts; homogeneous heavily vegetated regions – Hot referenceUse to assess absolute calibration, monitor stability and assess residual instrument calibration errors37 V-H23 V-H18 V-H10 V-H6 V-H
  • 6.
    Use match-ups betweenAquarius and ocean altimeters to identify observations over calm seasCompare Aquarius to modeled TBCalm ocean surface reduces model uncertainty – nearly specular emissionModel inputs (e.g. SST, SSS) from ancillary data sourcesSort comparisons to identify residual errors in corrections (e.g. solar, galactic, ionosphere)Significant number of match-ups with minimal temporal and spatial difference (1 hr/100km)5Cold TB ReferenceNumber of match-ups per 1o bin – all horns
  • 7.
    Cold Scene StabilityMonitoringUsed simulated data to assess resolution of methodCompare TBs to model to look for jumps/drifts6TBV – Model : Horn 1 Inter-channel double difference : Horn 1Over range of 0 < WS < 5 m/sAssumes 0.5C SST knowledge and 0.5psu SSS knowledge
  • 8.
    Antarctic Calibration ReferenceRecentwork has shown Dome-C as suitable candidate for an on-Earth L-band reference (Floury et al., 2002; Macelloni et al. 2006 ; Macelloni et al. 2007)Region is heavily instrumented and studied, but small in sizeParticularly for Aquarius, larger site desired due to fixed independent radiometer beamsUsed AMSR-E to search for other suitable Antarctic calibration sitesIdentified other regions with low spatial and temporal variability of surface and deep ice temperatureAquarius 3-beams
  • 9.
    Temporal stability at6 and 37 GHz6.9 GHz37 GHz Regions below 0.5K std.dev chosen for 6GHz
  • 10.
    Regions below4K std.dev chosen for 37GHz
  • 11.
    Spatial stabilityof region evaluated by searching for contiguous thermally stable sets within a 150km radiusMarie Byrd Region: Marie-Byrd region identified as suitable site
  • 12.
    Approximate area of stable region ~160,000km2
  • 13.
    Twoautomated weather stations (AWS) in regionCharacteristics of Marie-Byrd Region10Accumulation in Marie-Byrd region ~30cm/yr, higher than in East AntarcticaGentle upward slope from north to south across the regionSurface density ~350kg/m-3 with firn-ice transition around 64 m (Gow 1968)Accumulation RateRubin and Giovinetto 1962Cuffey and Patterson 2010
  • 14.
    Characteristics of Marie-ByrdRegionWarmer surface temperatures in Marie-Byrd region than East Antarctica11Mean Surface TemperatureCosimo2000
  • 15.
    126.9 GHz H-pol37GHz H-pol6.9 GHz V-pol37 GHz V-pol
  • 16.
    1337 GHz H-pol6.9GHz H-pol37 GHz V-pol6.9 GHz V-pol
  • 17.
    Marie-Byrd vs. DomeCMarie-ByrdDome-CTb37_pp = 30K1Macelloni (2007)Tb37_pp = 15K
  • 18.
    15AMSR-E V-pol DomeCAMSR-E V-pol MBAMSR-E H-pol Dome CAMSR-E H-pol MB
  • 19.
    `16AMSR-E 6GHz H-polAMSR-E 6 GHz V-polAMSR-E 37 GHz H-polAMSR-E 37 GHz V-pol
  • 20.
    Long Term TemperatureStability at Marie-ByrdAMSR-E 6 GHz TB stable to ~0.2K from 2003 to 2011
  • 21.
    6 GHz TBstable to <0.1K over last 5 yearsAnnual averaged surface temperature from Byrd AWS stable to ~1C from 1980 – 200017
  • 22.
    Development of CoupledForward ModelUse model to transfer calibration from higher frequencies radiometers to L-bandModel couples an ice heat-transport equation and radiative-transfer equationConstrain model using AMSR-E and in situ AWS dataconstrain density profile, temperature profile and grain sizePredicts brightness temperature at L-bandUse as a calibration referenceTracking calibration stability over time
  • 23.
    Sensitive to heat-transportmodel, but temporal variability small
  • 24.
    Lower uncertainty onmonthly or longer time scales
  • 25.
  • 26.
    Use region toassess calibration between sensors – daily observations
  • 27.
    Model used toaccount for differences in incidence angle
  • 28.
  • 29.
    Uncertainty dependent onradiative transfer model
  • 30.
    Evaluate several modelsto estimate uncertaintySurface temperature values obtained from AWS stations used as top boundary condition, with its mean as the bottom boundary conditionOnly considered annual harmonicUsed simple radiative transfer model assuming layered ice to estimate L-band and C-band V-pol TB annual signalsummerwinterautumnspring
  • 31.
    206.9 GHz H-polSMOS55o H-poldfSMOS 55o V-pol6.9 GHz V-pol
  • 32.
    Time Series ComparisonMonthlyaveraged SMOS TB at 55o incidence angle compared to AMSR-E 6.9 GHz channel for June 2010 to June 2011Observed annual signal at L-band higher than expected21AMSR-E 6.9 GHz and SMOS V-polAMSR-E 6.9 GHz and SMOS H-pol