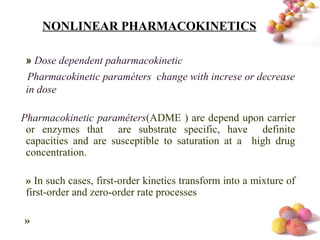
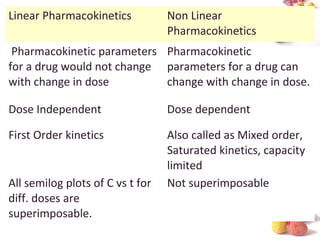
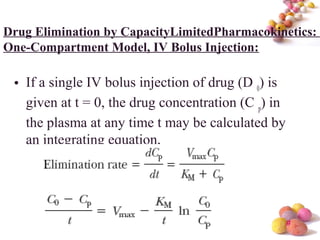
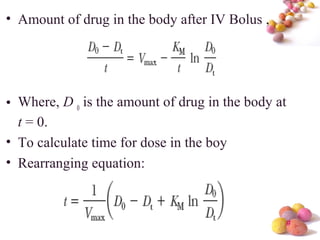
- The document discusses nonlinear pharmacokinetics where parameters like clearance and volume of distribution change with dose. This occurs when transporters or enzymes involved in absorption, distribution, metabolism and excretion get saturated at high drug concentrations.
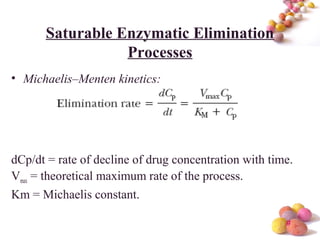
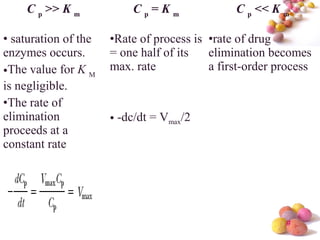
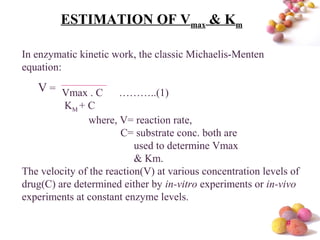
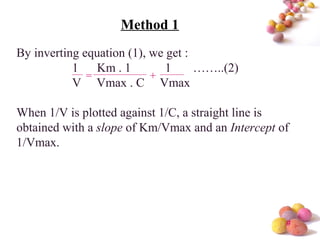
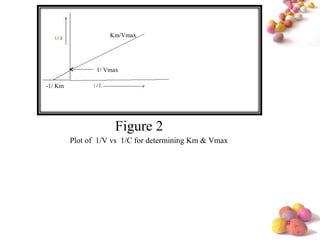
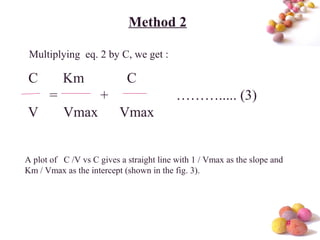
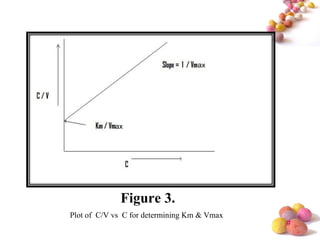
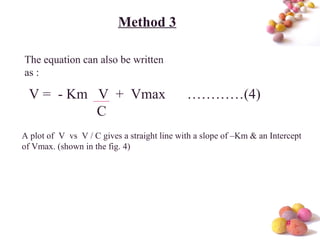
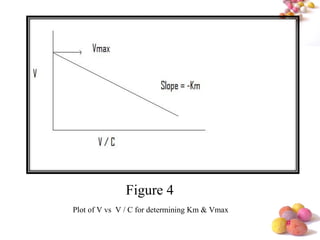
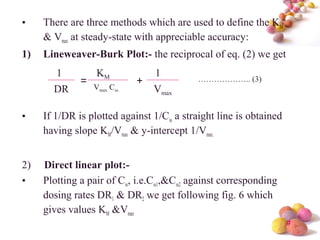
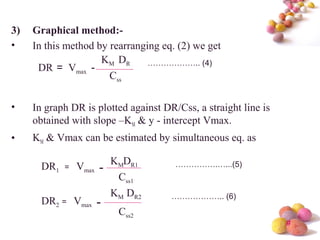
- The Michaelis-Menten equation is used to describe saturation kinetics and estimate parameters Km and Vmax. Various methods like Lineweaver-Burk, direct linear and graphical plots are presented to determine these values using in vivo or in vitro concentration and rate data.
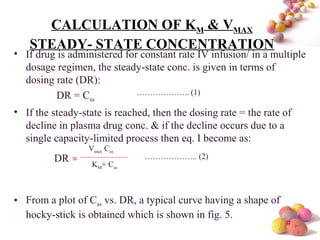
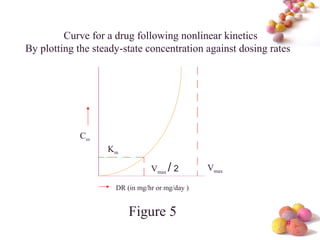
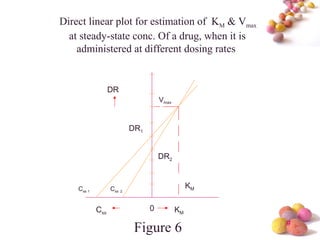
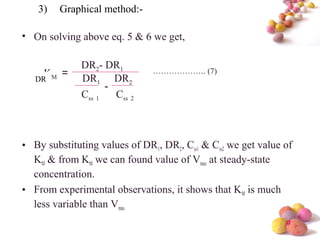
- Estimation of Km and Vmax is also described at steady-state concentrations achieved after constant rate infusion or multiple dosing, through plots of steady-state concentration versus dosing rate.