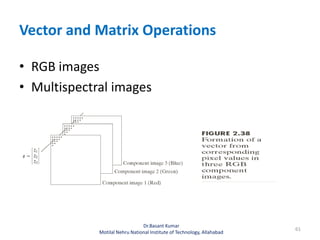
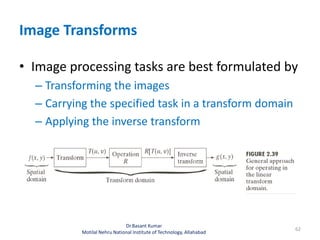
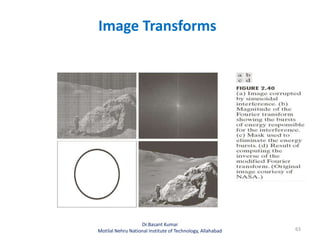
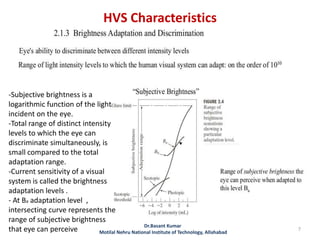
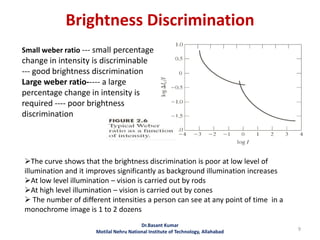
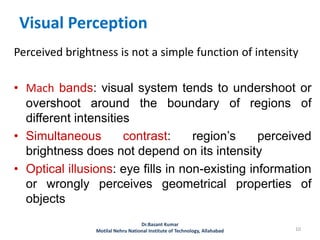
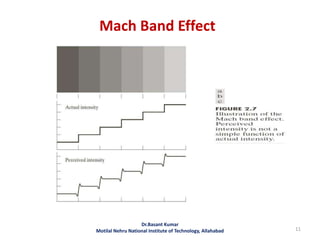
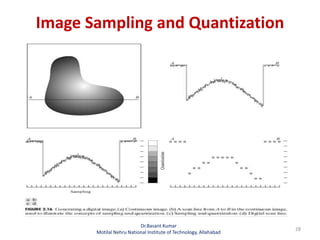
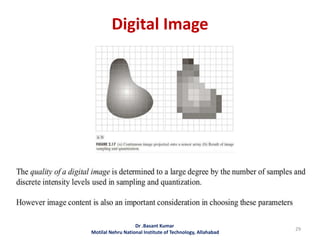
This document summarizes key concepts about digital image fundamentals. It discusses how images are formed in the eye and sensed by imaging devices. Images are discretized through sampling and quantization to create a digital image represented by a matrix of pixels with discrete intensity values. The document covers characteristics of the human visual system, image resolution, interpolation techniques, arithmetic operations on images like averaging, subtraction and multiplication, and how digital images are represented and stored in memory.

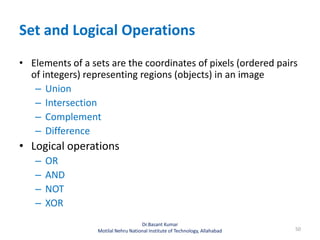
![Representing Digital Images
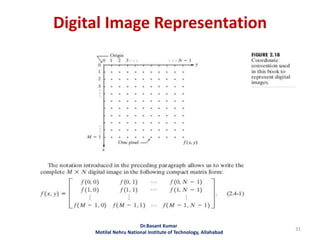
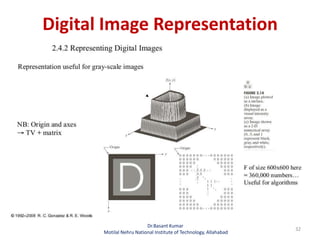
• Digital image
– M N array
– L discrete intensities – power of 2
• L = 2k
• Integers in the interval [0, L - 1]
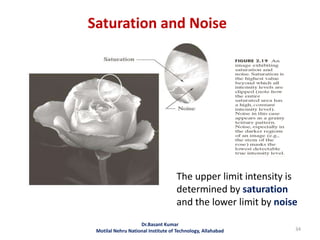
• Dynamic range: ratio of maximum / minimum
intensity
– Low: image has a dull, washed-out gray look
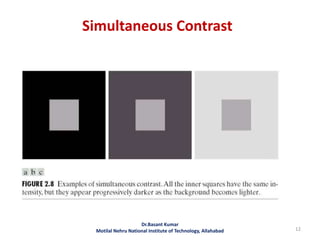
• Contrast: difference between highest and lowest
intensity
– High: image have high contrast
33
Dr.Basant Kumar
Motilal Nehru National Institute of Technology, Allahabad](https://image.slidesharecdn.com/dipchapter2-130911151815-phpapp01/85/Dip-chapter-2-33-320.jpg)
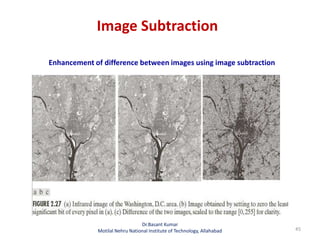
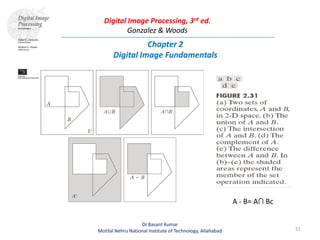
![Arithmetic Operations
• To guarantee that the full range of an arithmetic operation
between images is captured into a fixed number of bits, the
following approach is performed on image f
fm = f – min(f)
which creates an image whose minimum value is 0. Then the
scaled image is
fs = K [ fm / max(fm)]
whose value is in the range [0, K]
Example- for 8-bit image , setting K=255 gives scaled image
whose intensities span from 0 to 255
49
Dr.Basant Kumar
Motilal Nehru National Institute of Technology, Allahabad](https://image.slidesharecdn.com/dipchapter2-130911151815-phpapp01/85/Dip-chapter-2-49-320.jpg)
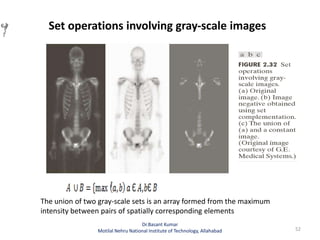
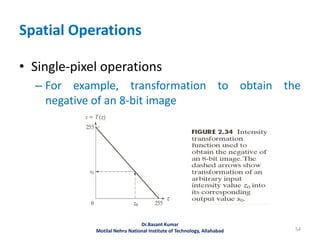
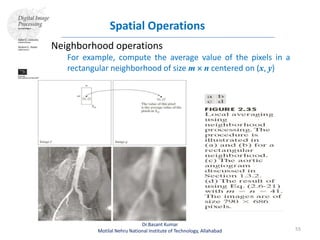
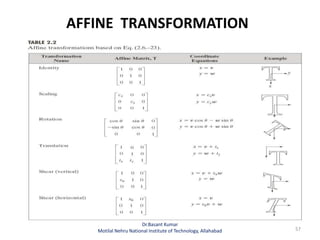
![Spatial Operations
• Geometric spatial transformations
– Called rubber-sheet transformations
– Consists of two operations
• Spatial transformation of coordinates
e.g. (x, y) = T { ( v, w) } = ( v/2, w/2)
– Affine transform: scale, rotate, transform, or sheer a set of
points
• Intensity interpolation
• Affine transform
[x y 1]= [v w 1] [Affine Matrix, T]
56
Dr.Basant Kumar
Motilal Nehru National Institute of Technology, Allahabad](https://image.slidesharecdn.com/dipchapter2-130911151815-phpapp01/85/Dip-chapter-2-56-320.jpg)