Downloaded 18 times

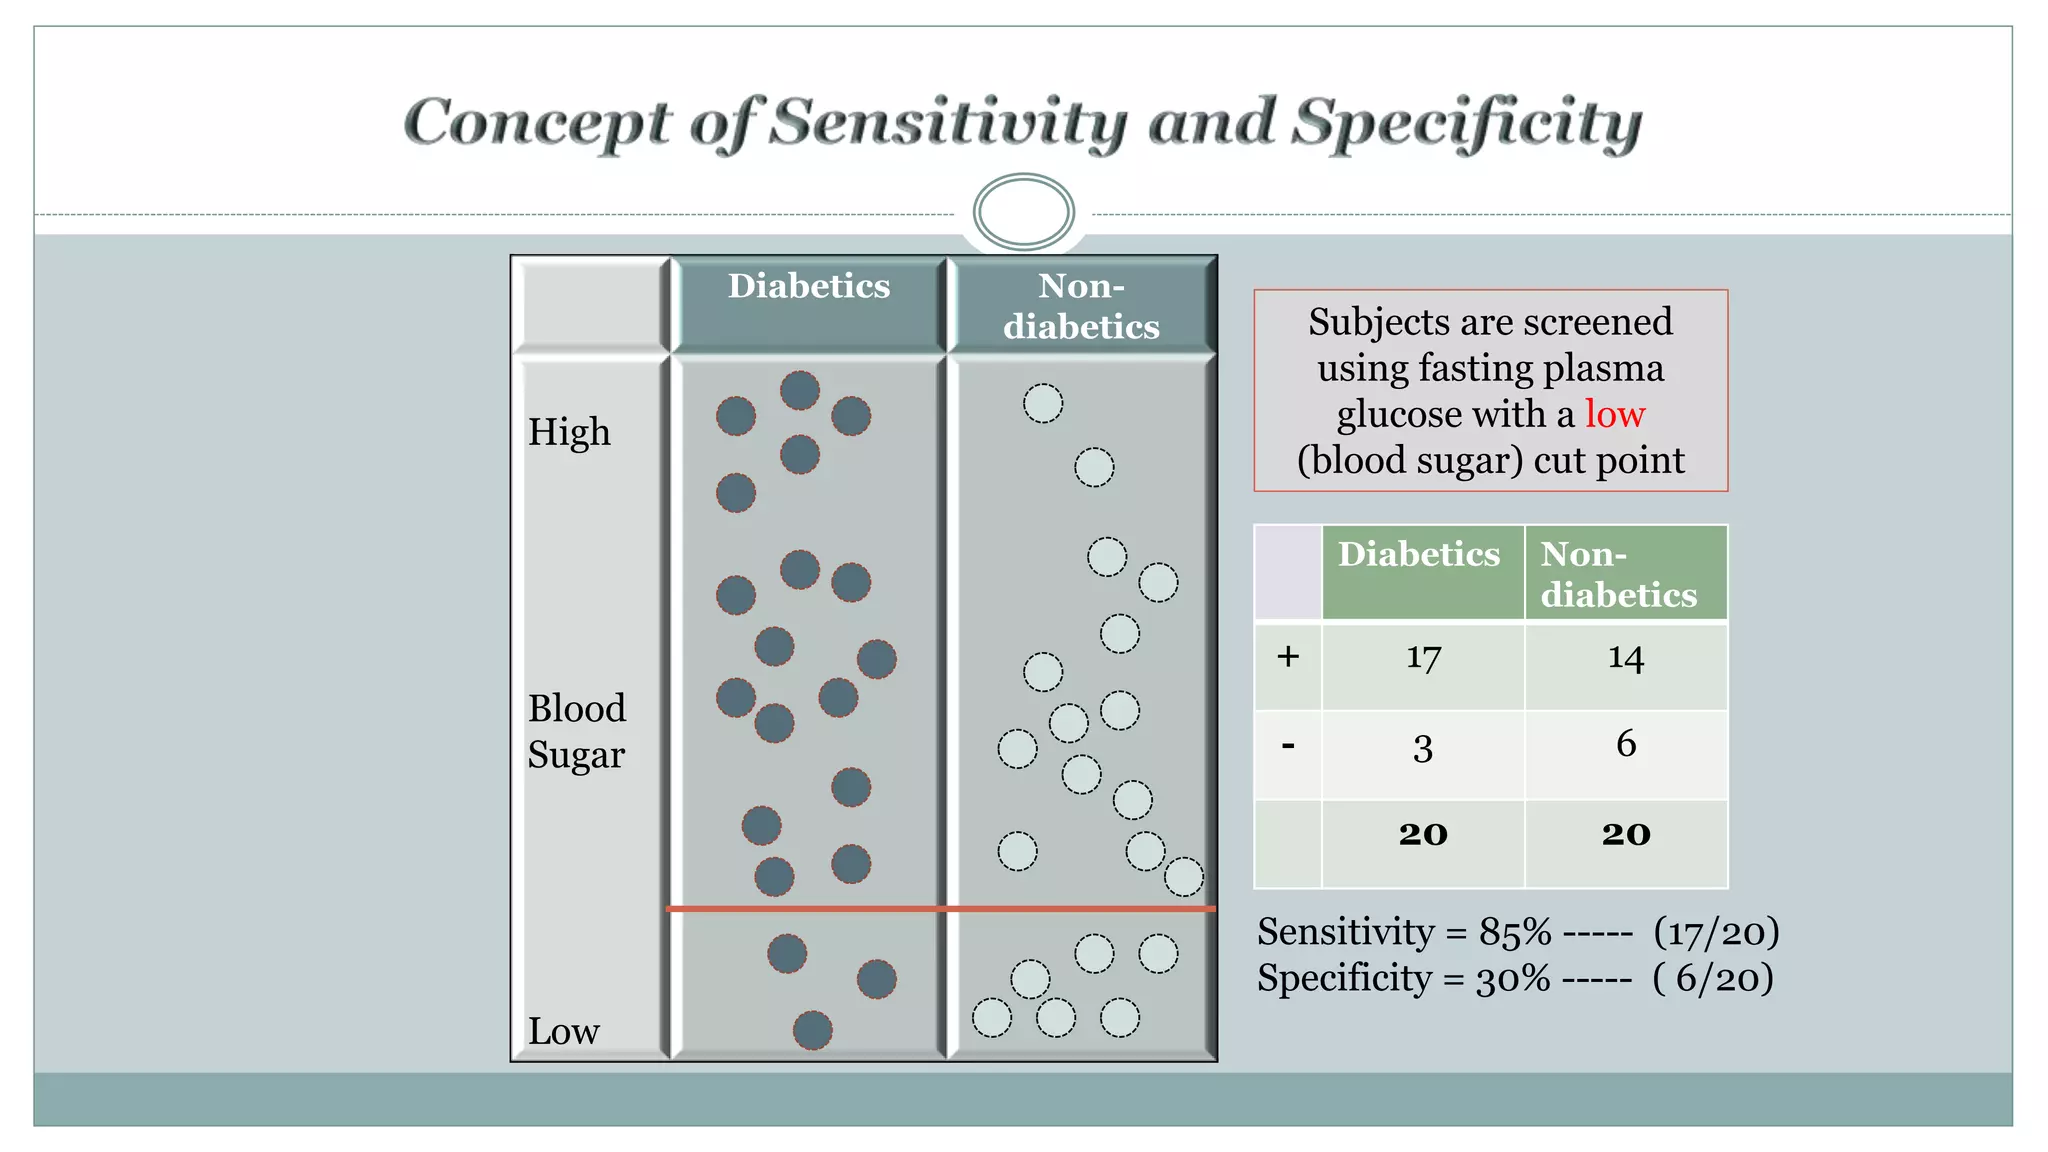
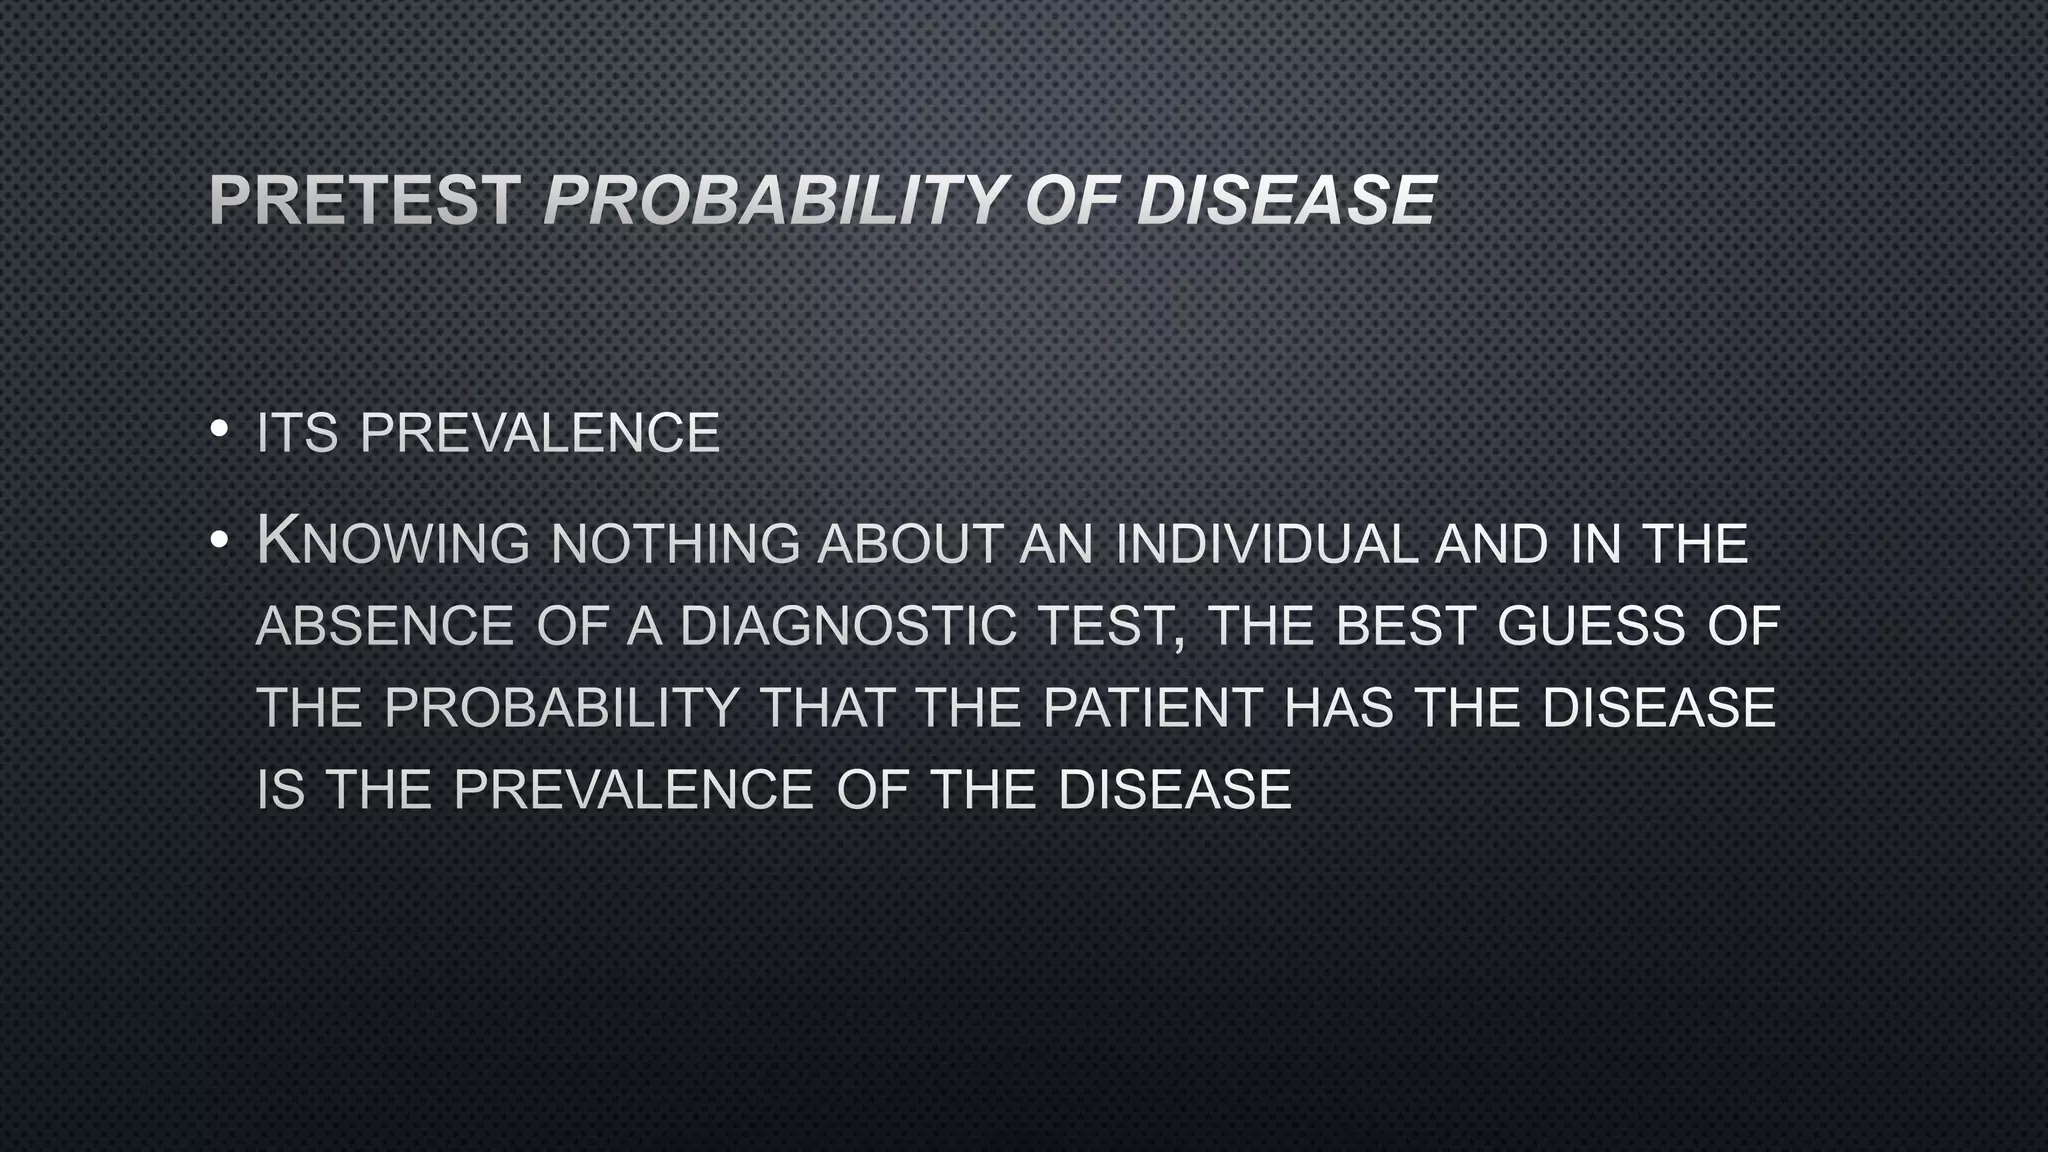
![ The ability of a diagnostic test (or procedure) to correctly classify
individuals into two categories (positive and negative) is
assessed by two parameters, sensitivity and specificity
Sensitivity
P[T +|D +]
True Positive Rate
Proportion of true positives correctly identified as such
=1-false negative rate
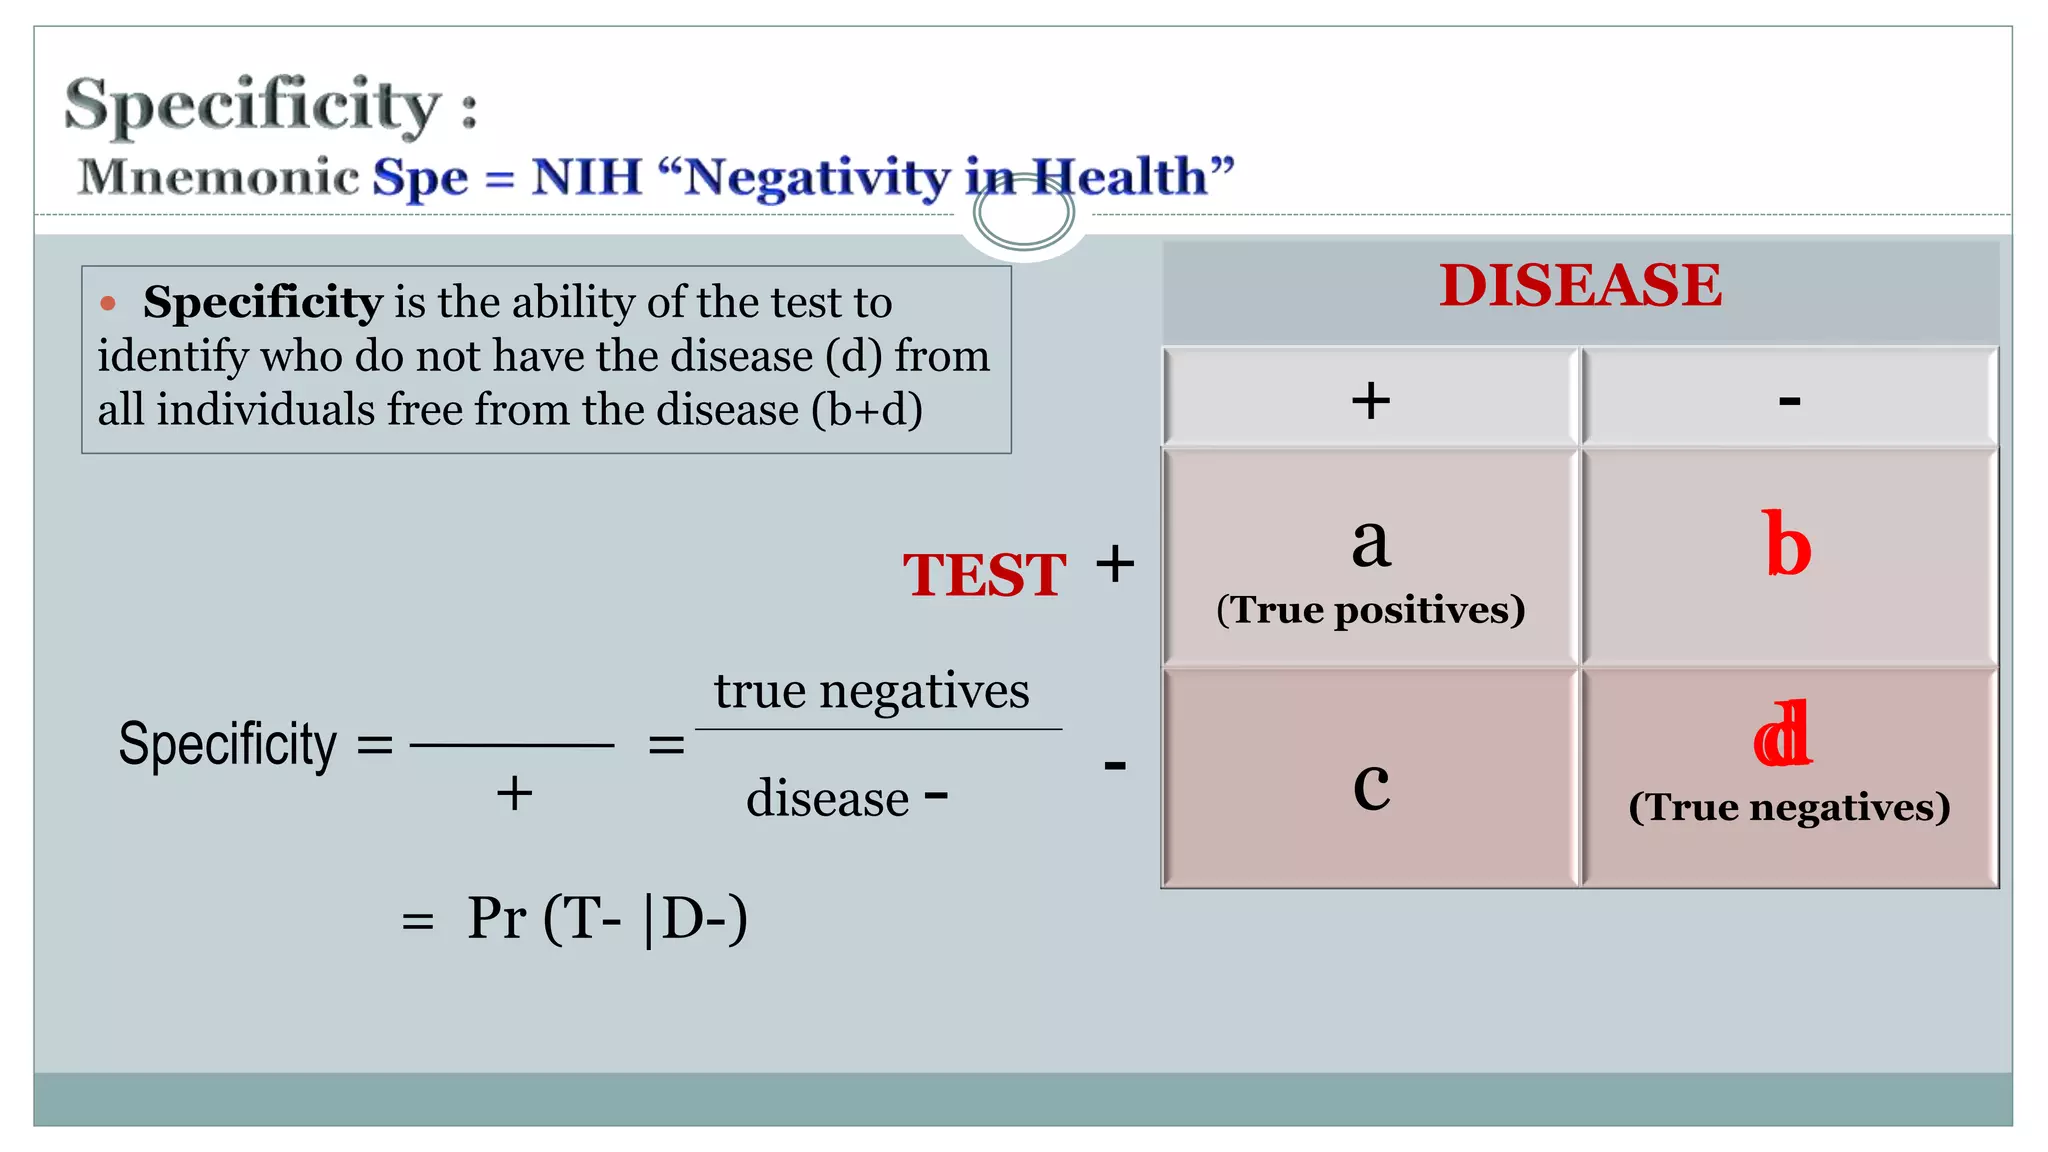
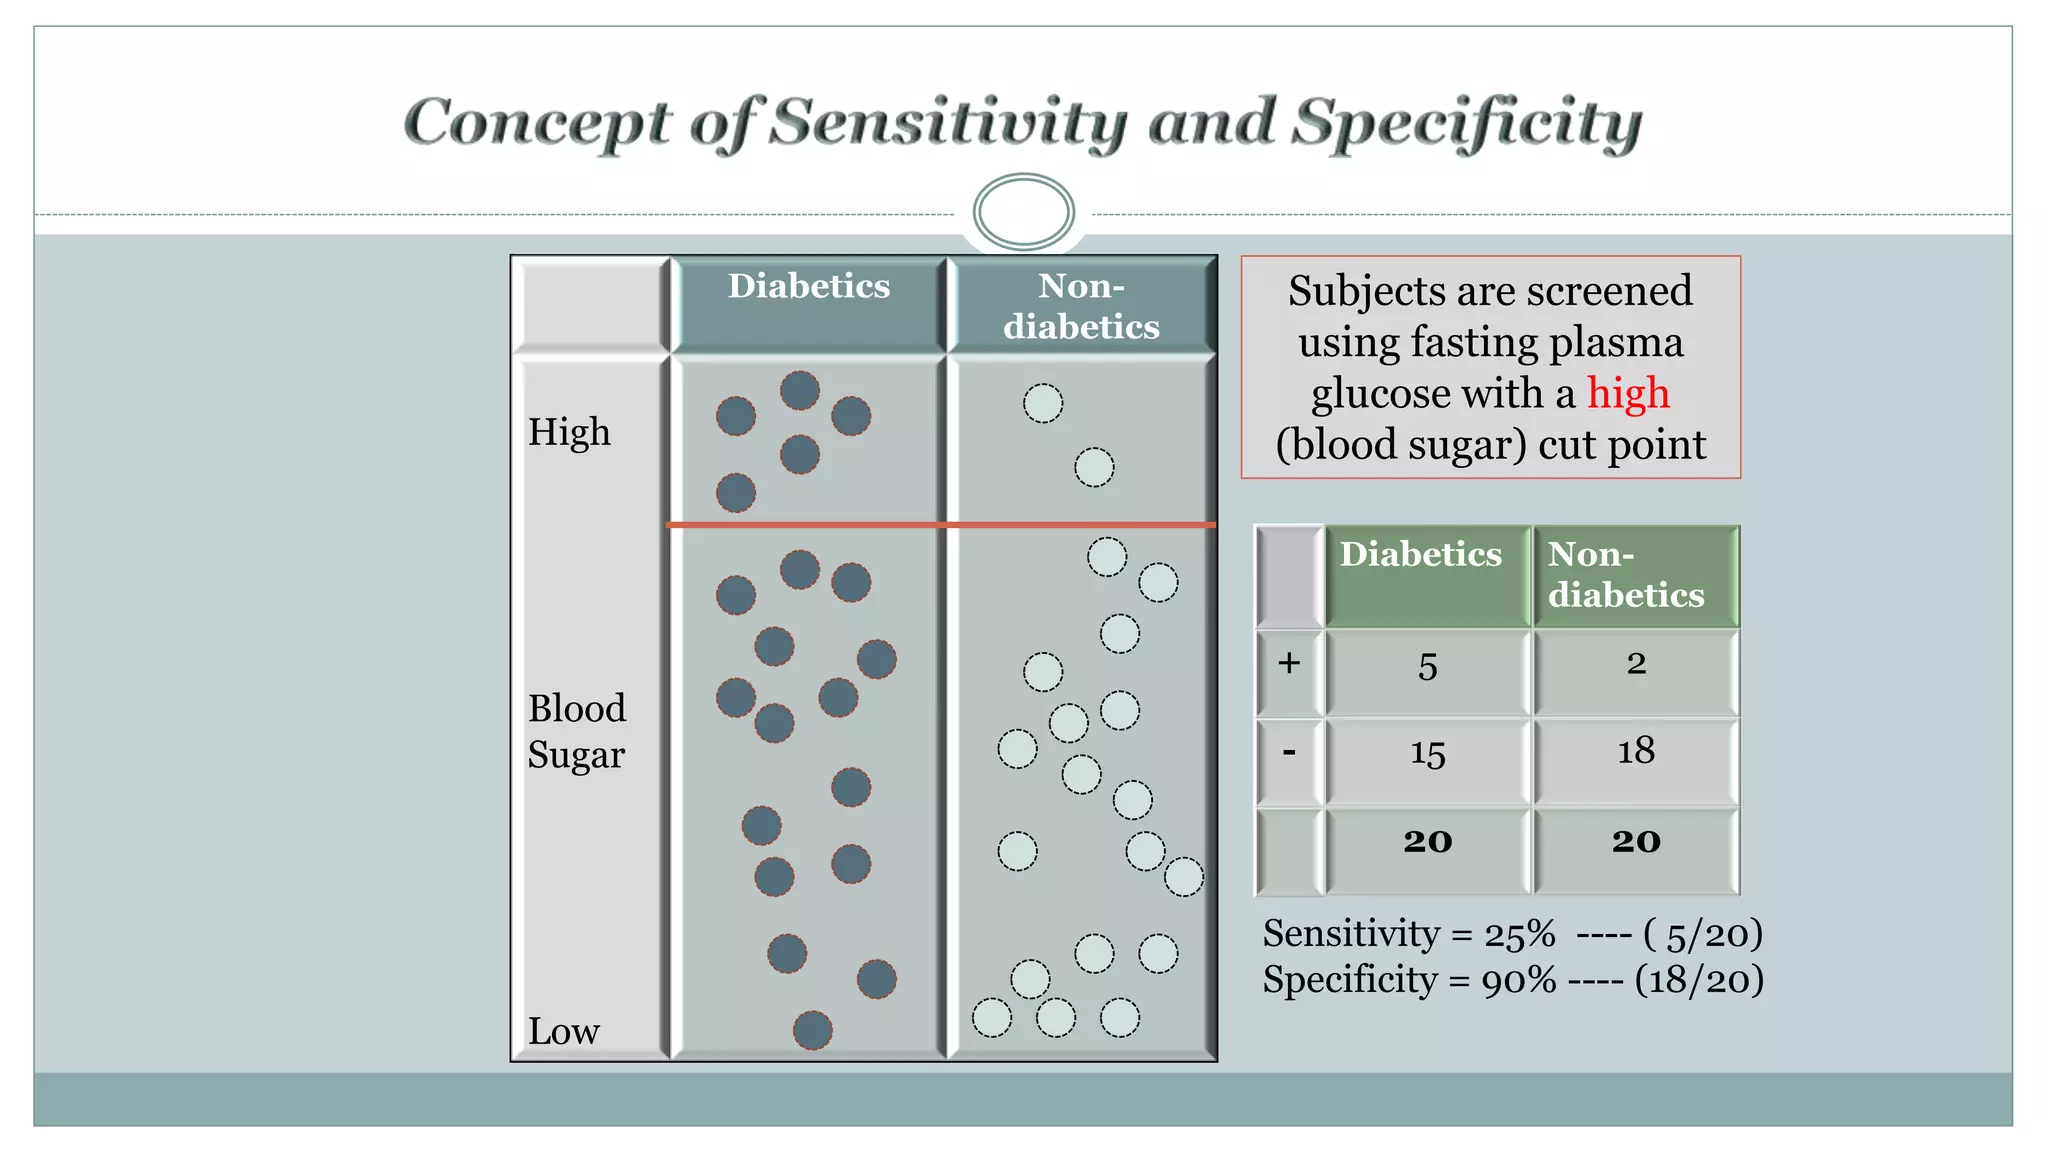
Specificity
P[T-|D -]
True Negative Rate
Proportion of true negatives correctly identified as such
=1- false positive rate](https://image.slidesharecdn.com/diagnostictests-class-201003073625/75/Diagnostic-Tests-for-PGs-6-2048.jpg)


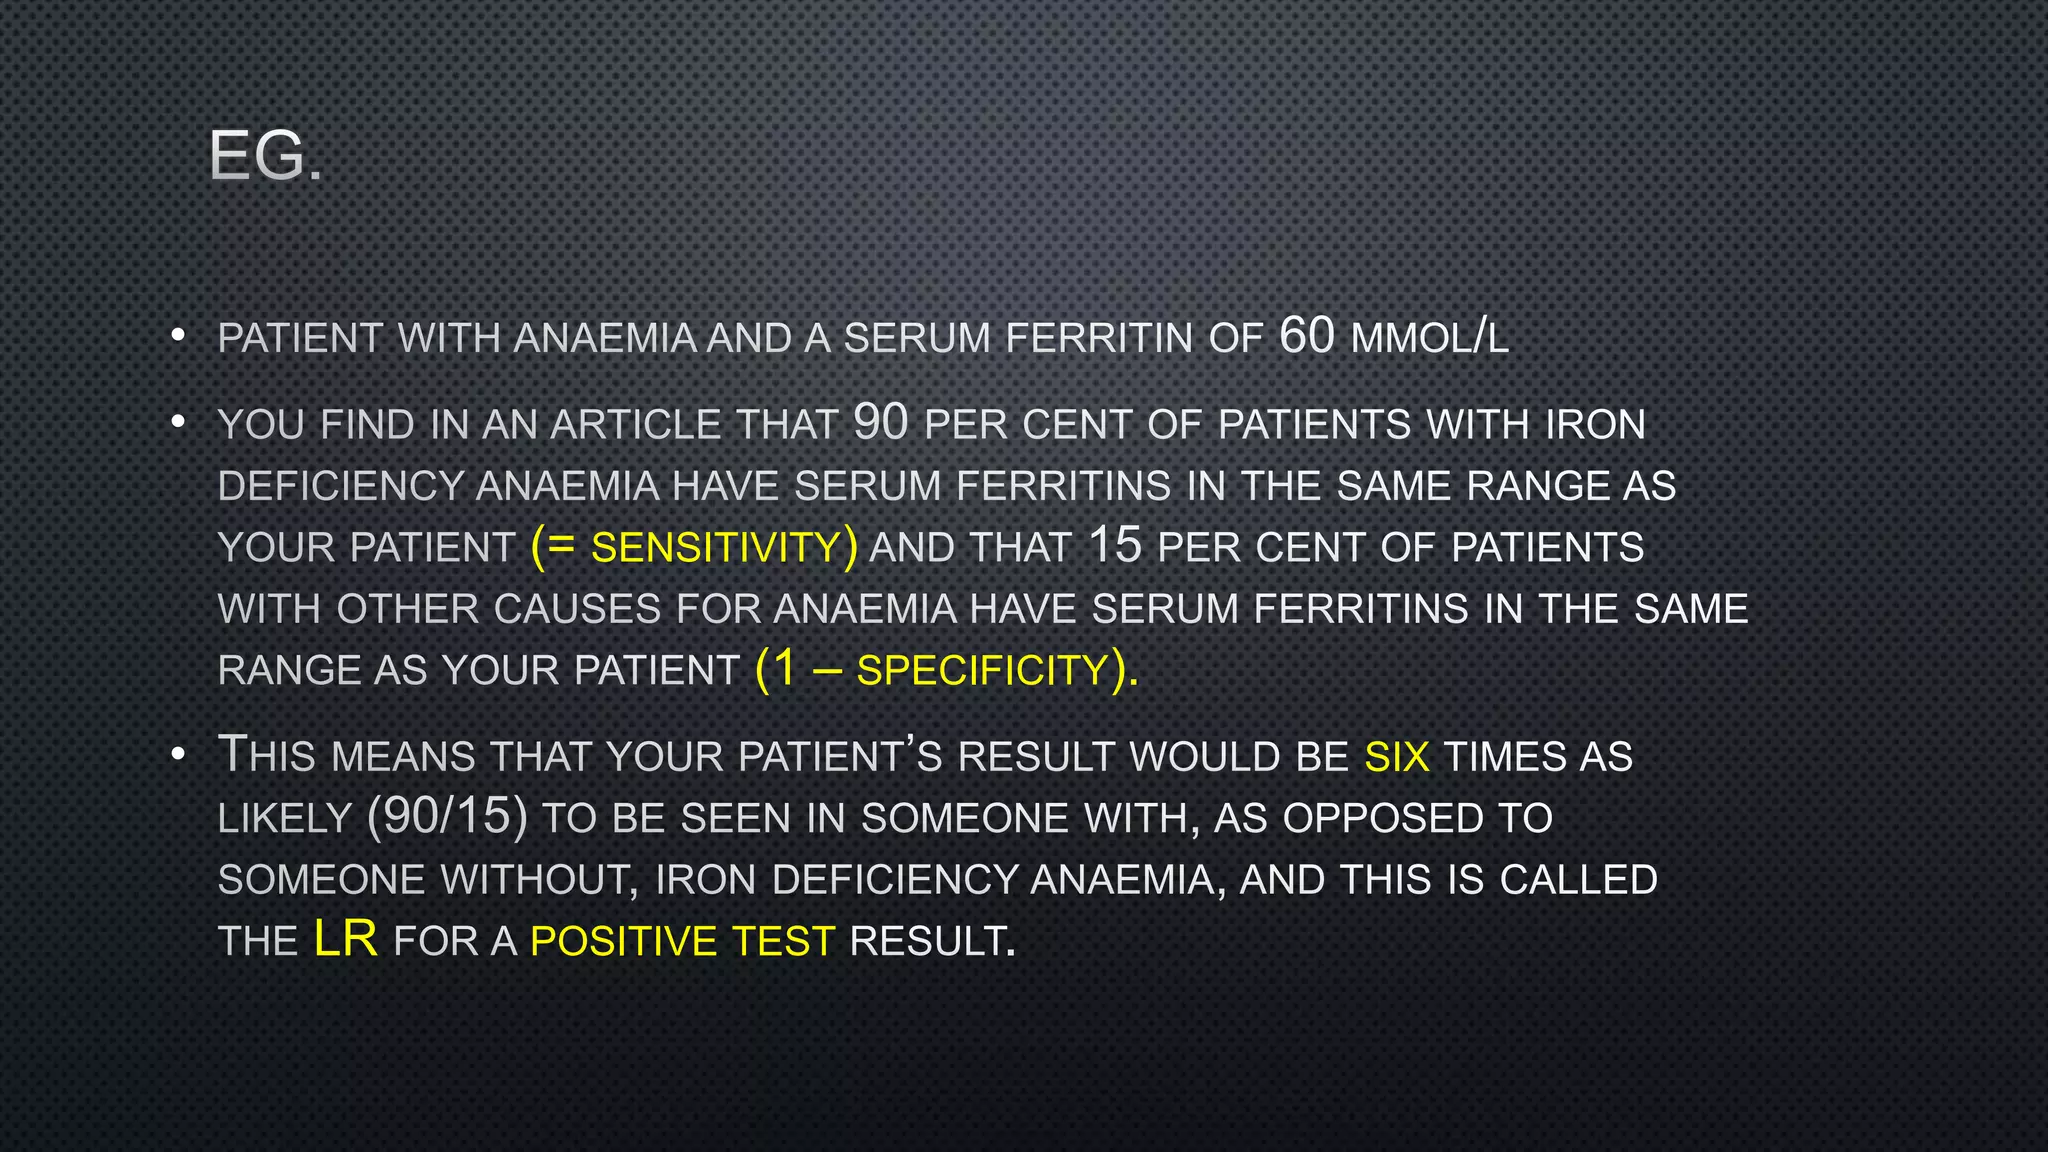
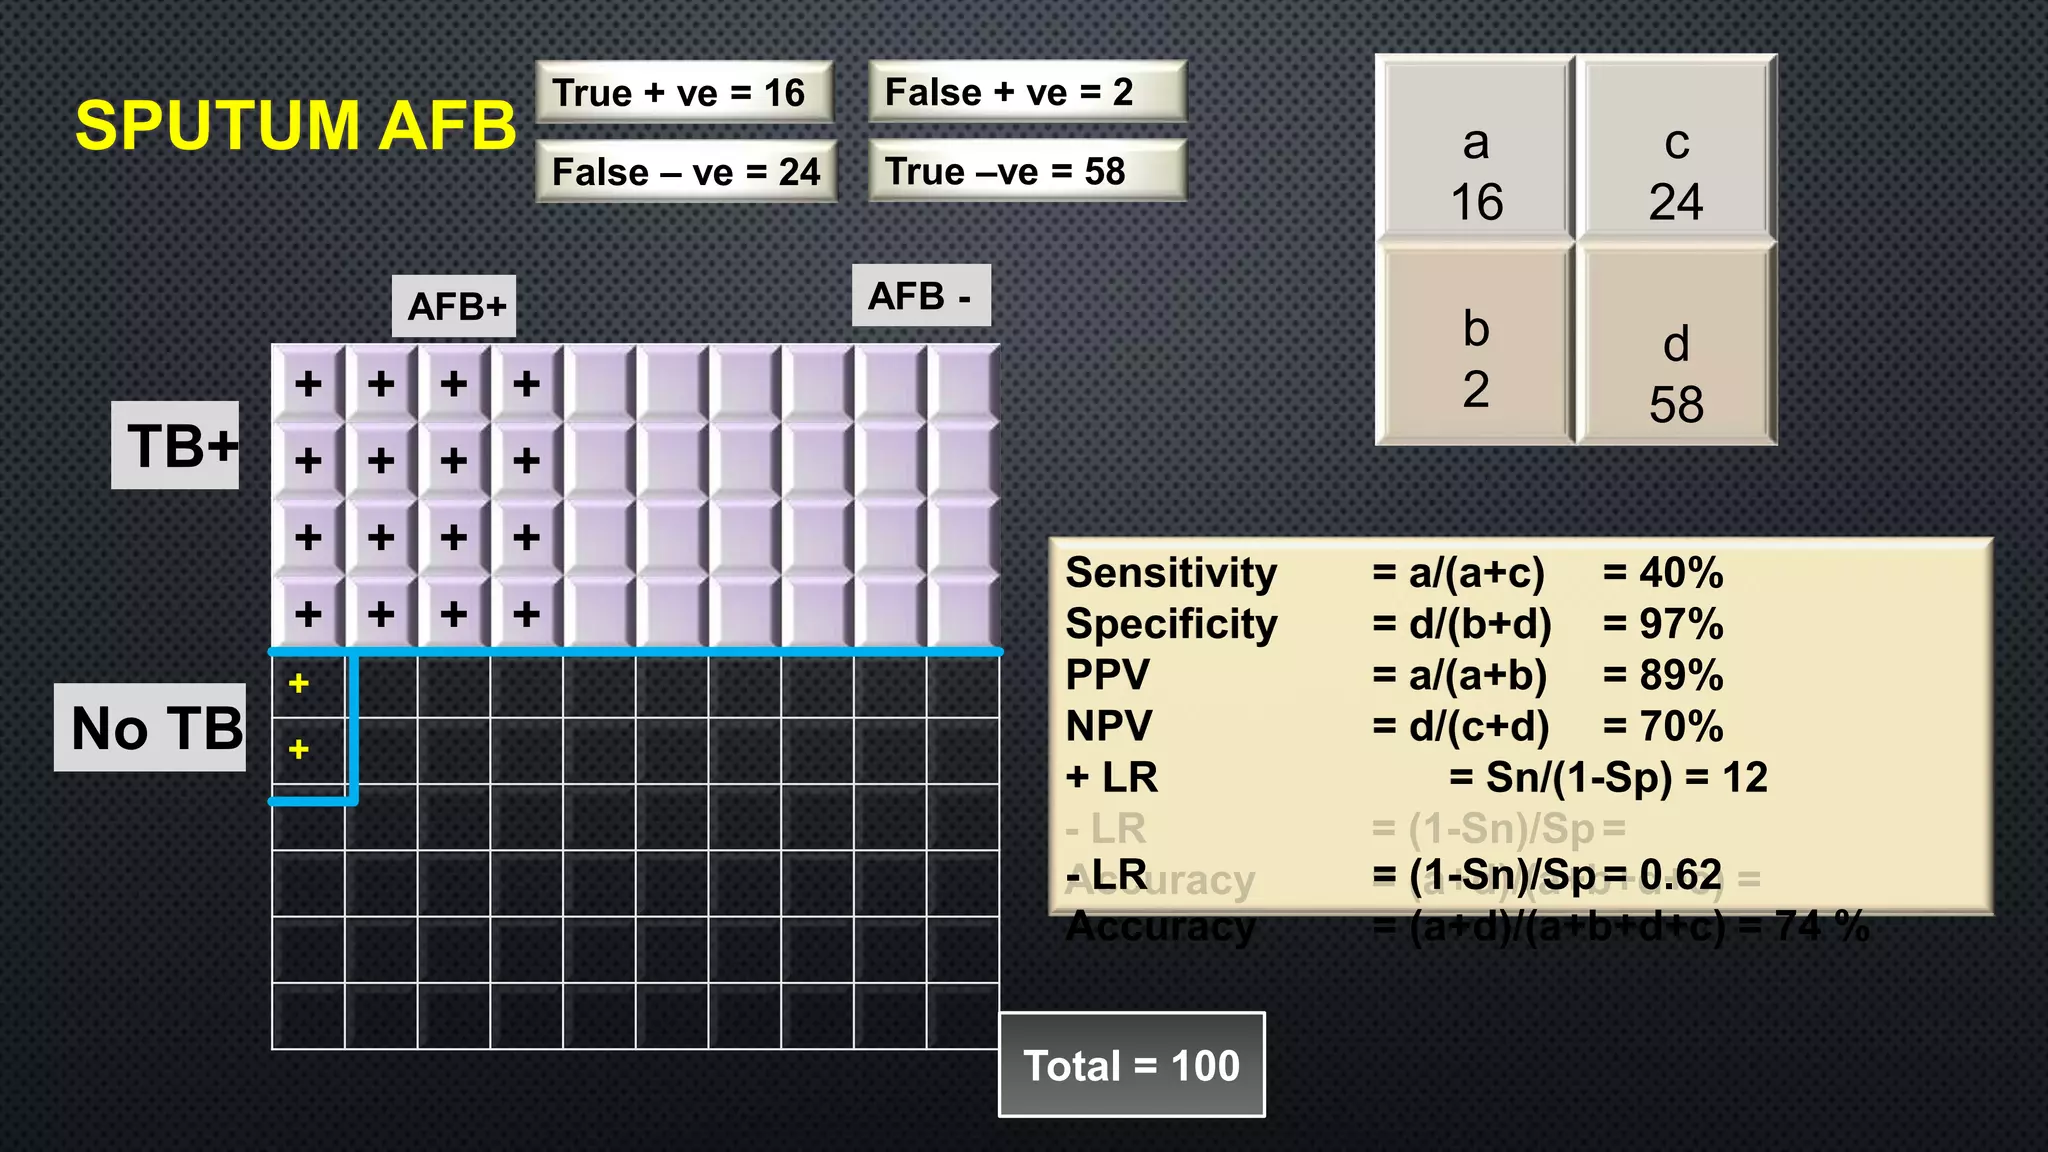
![• sensitivity is 0.52 (22/42)
• specificity is 0.95 (55/58),
• the positive LR is 10.1
[(22/42)/(3/58)], and
• the negative LR is 0.5
[(20/42)/(55/58)].](https://image.slidesharecdn.com/diagnostictests-class-201003073625/75/Diagnostic-Tests-for-PGs-29-2048.jpg)


![P(T- |D+)
P(T- | D-)
=
1- sensitivity
specificity
TPR = Sensitivity = P[T +|D+]
TNR = (1-Sensitivity) = P(T- |D -)
=
False negative rate
Specificity](https://image.slidesharecdn.com/diagnostictests-class-201003073625/75/Diagnostic-Tests-for-PGs-72-2048.jpg)


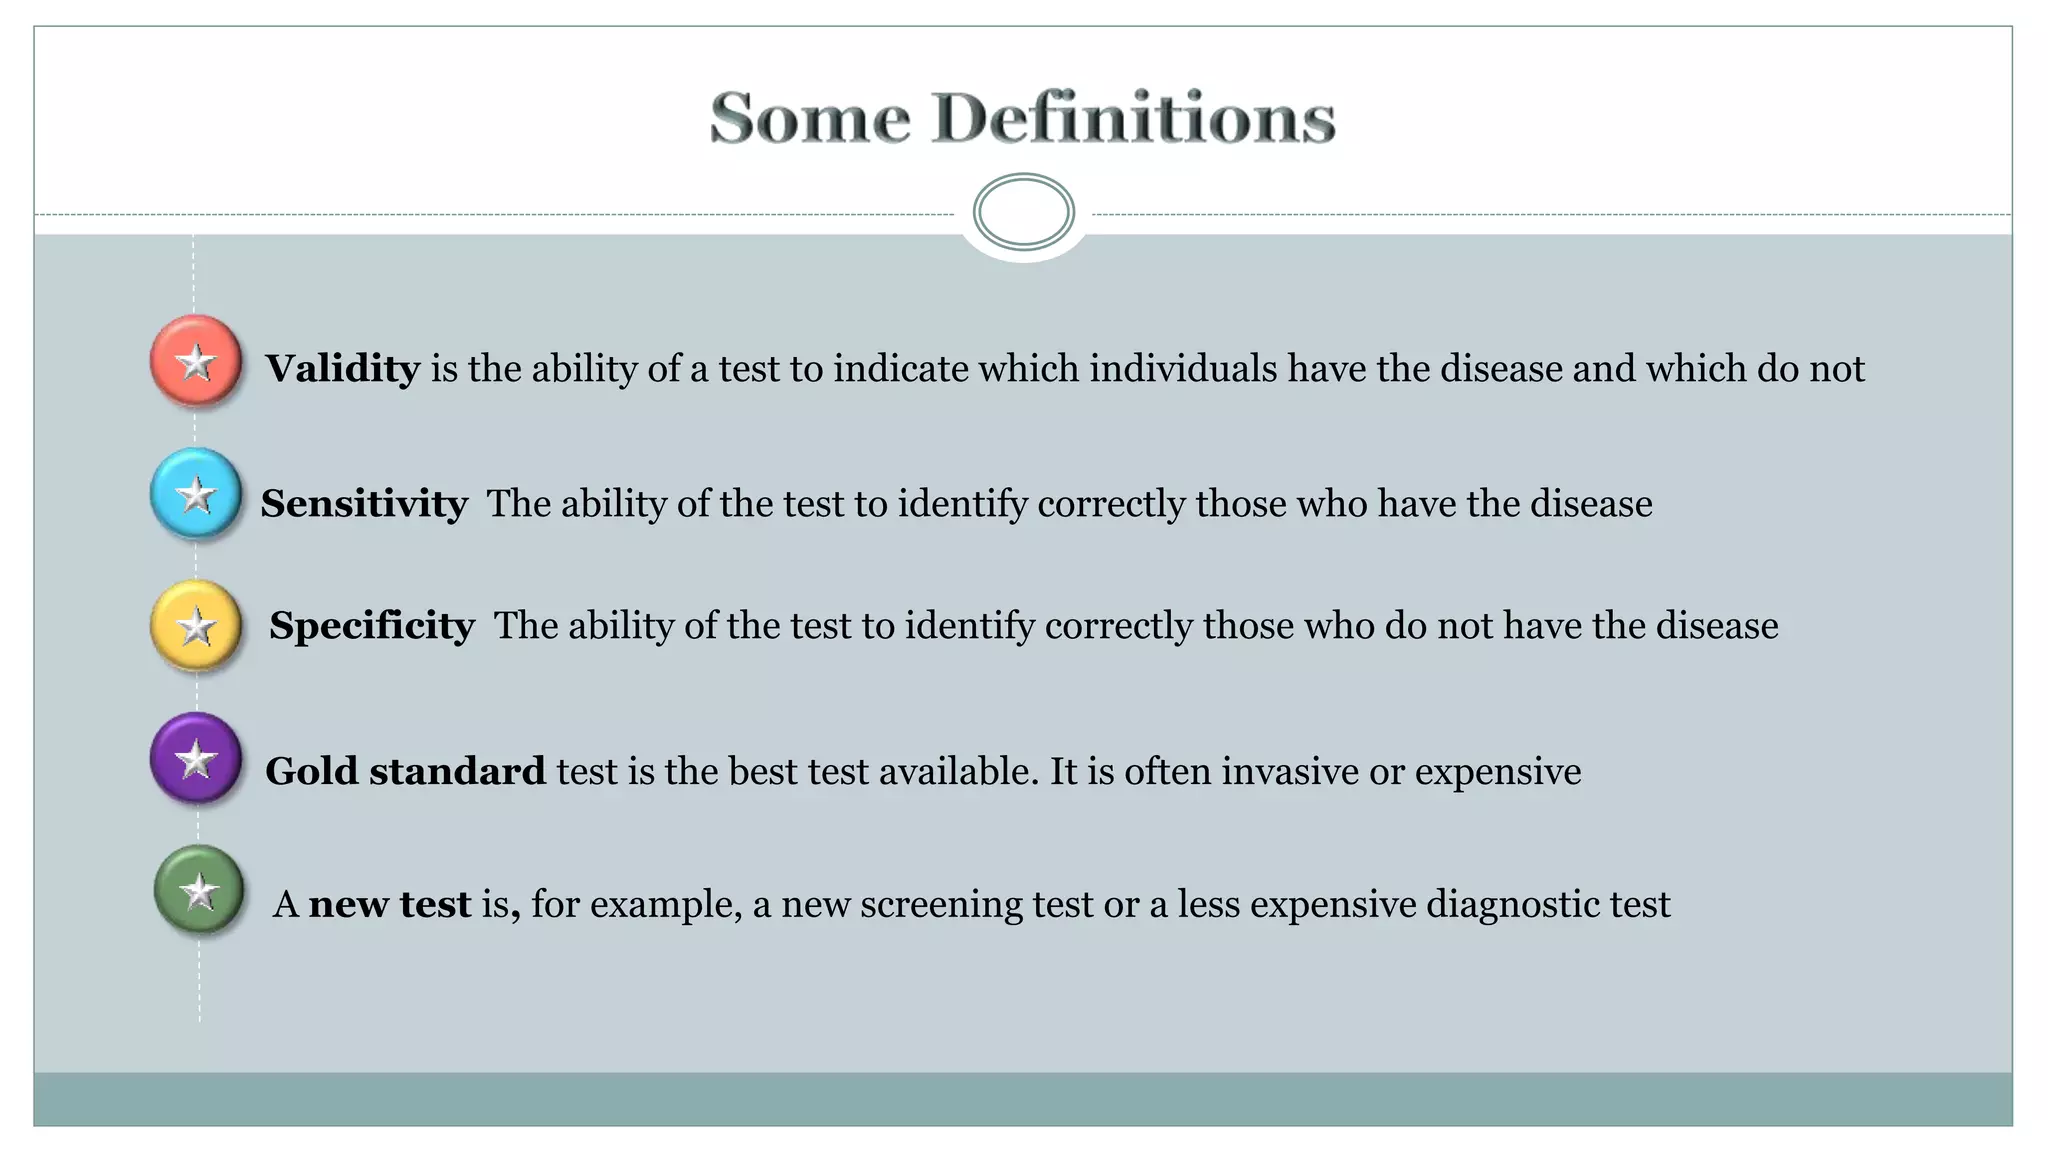
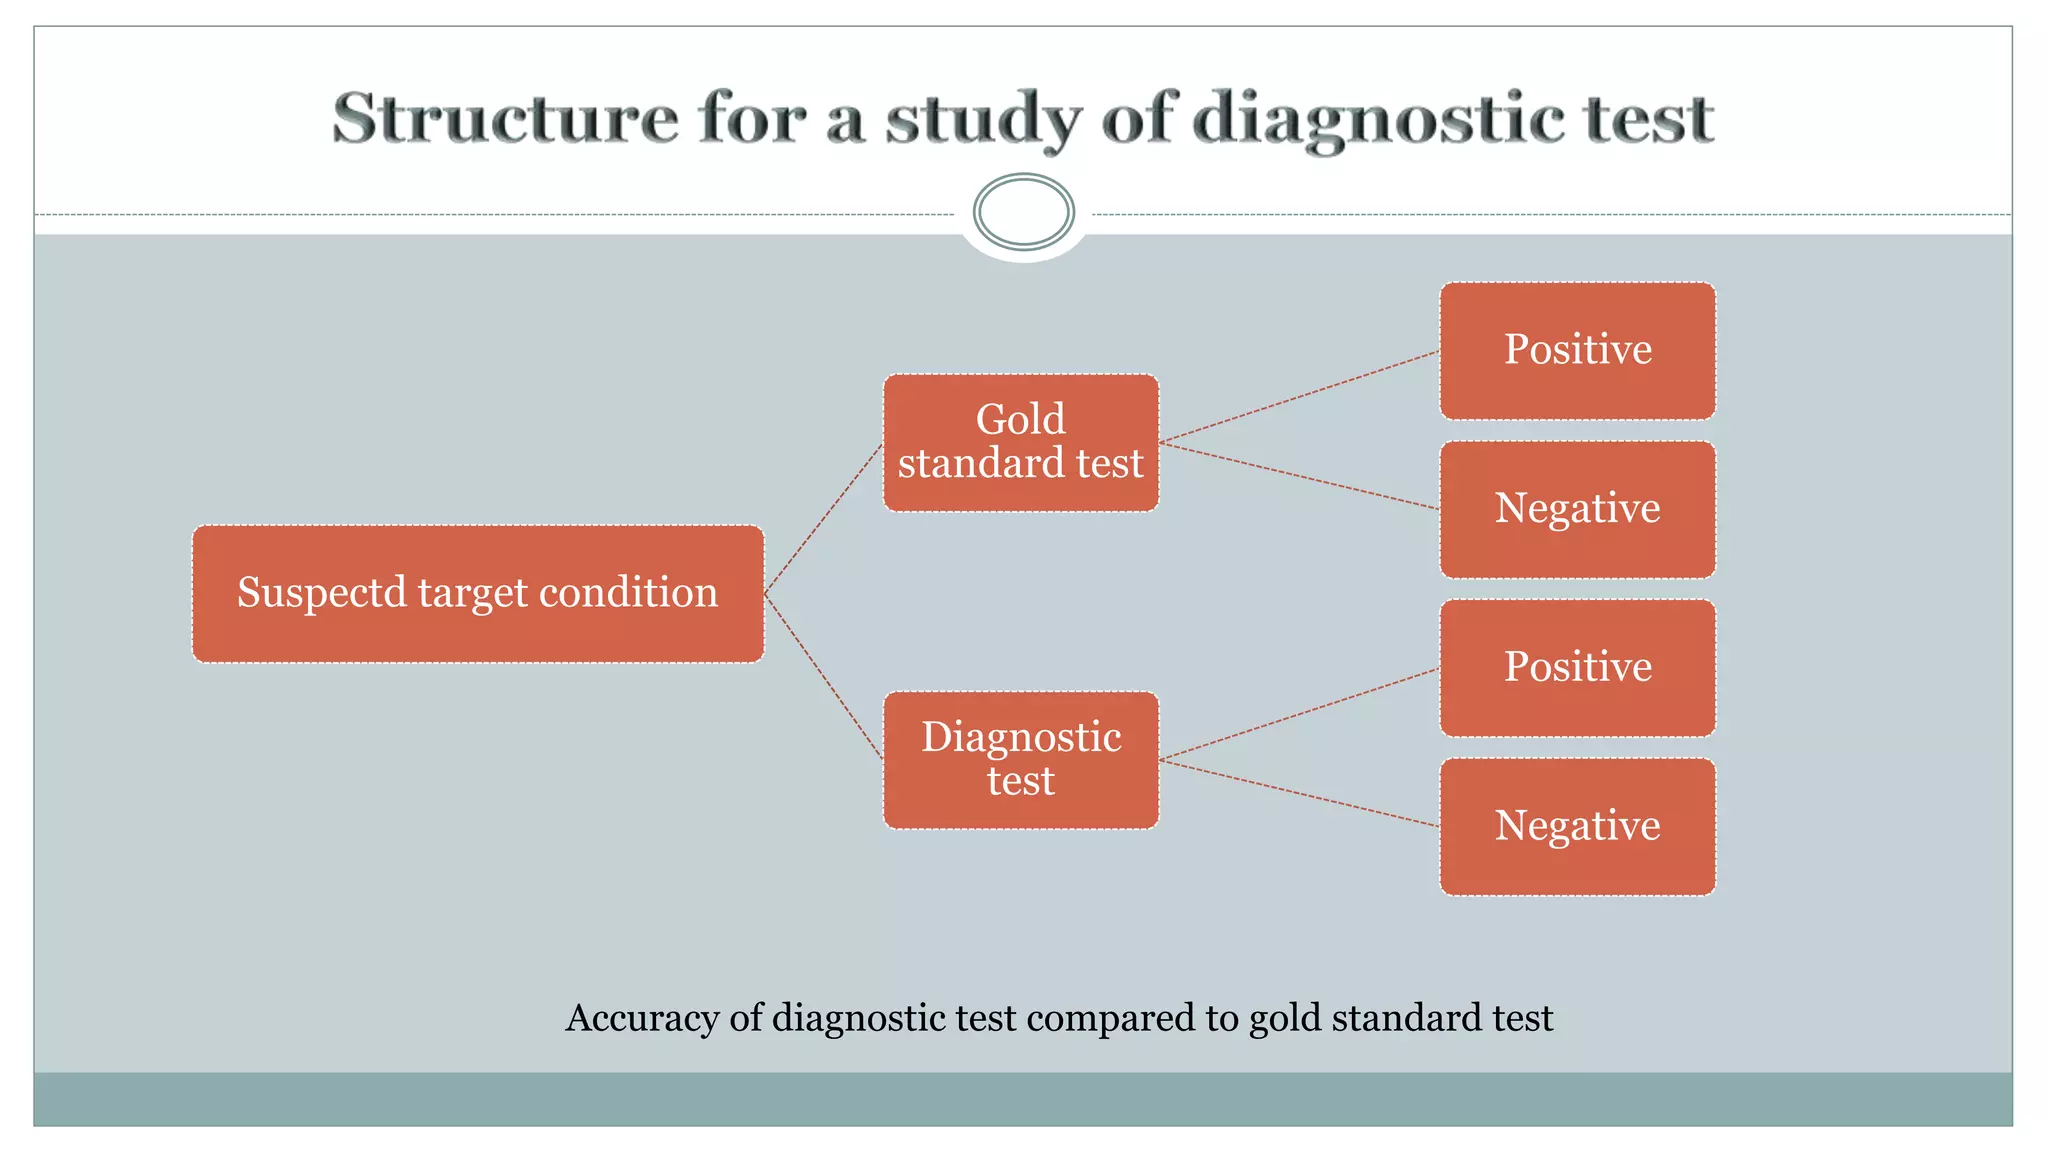
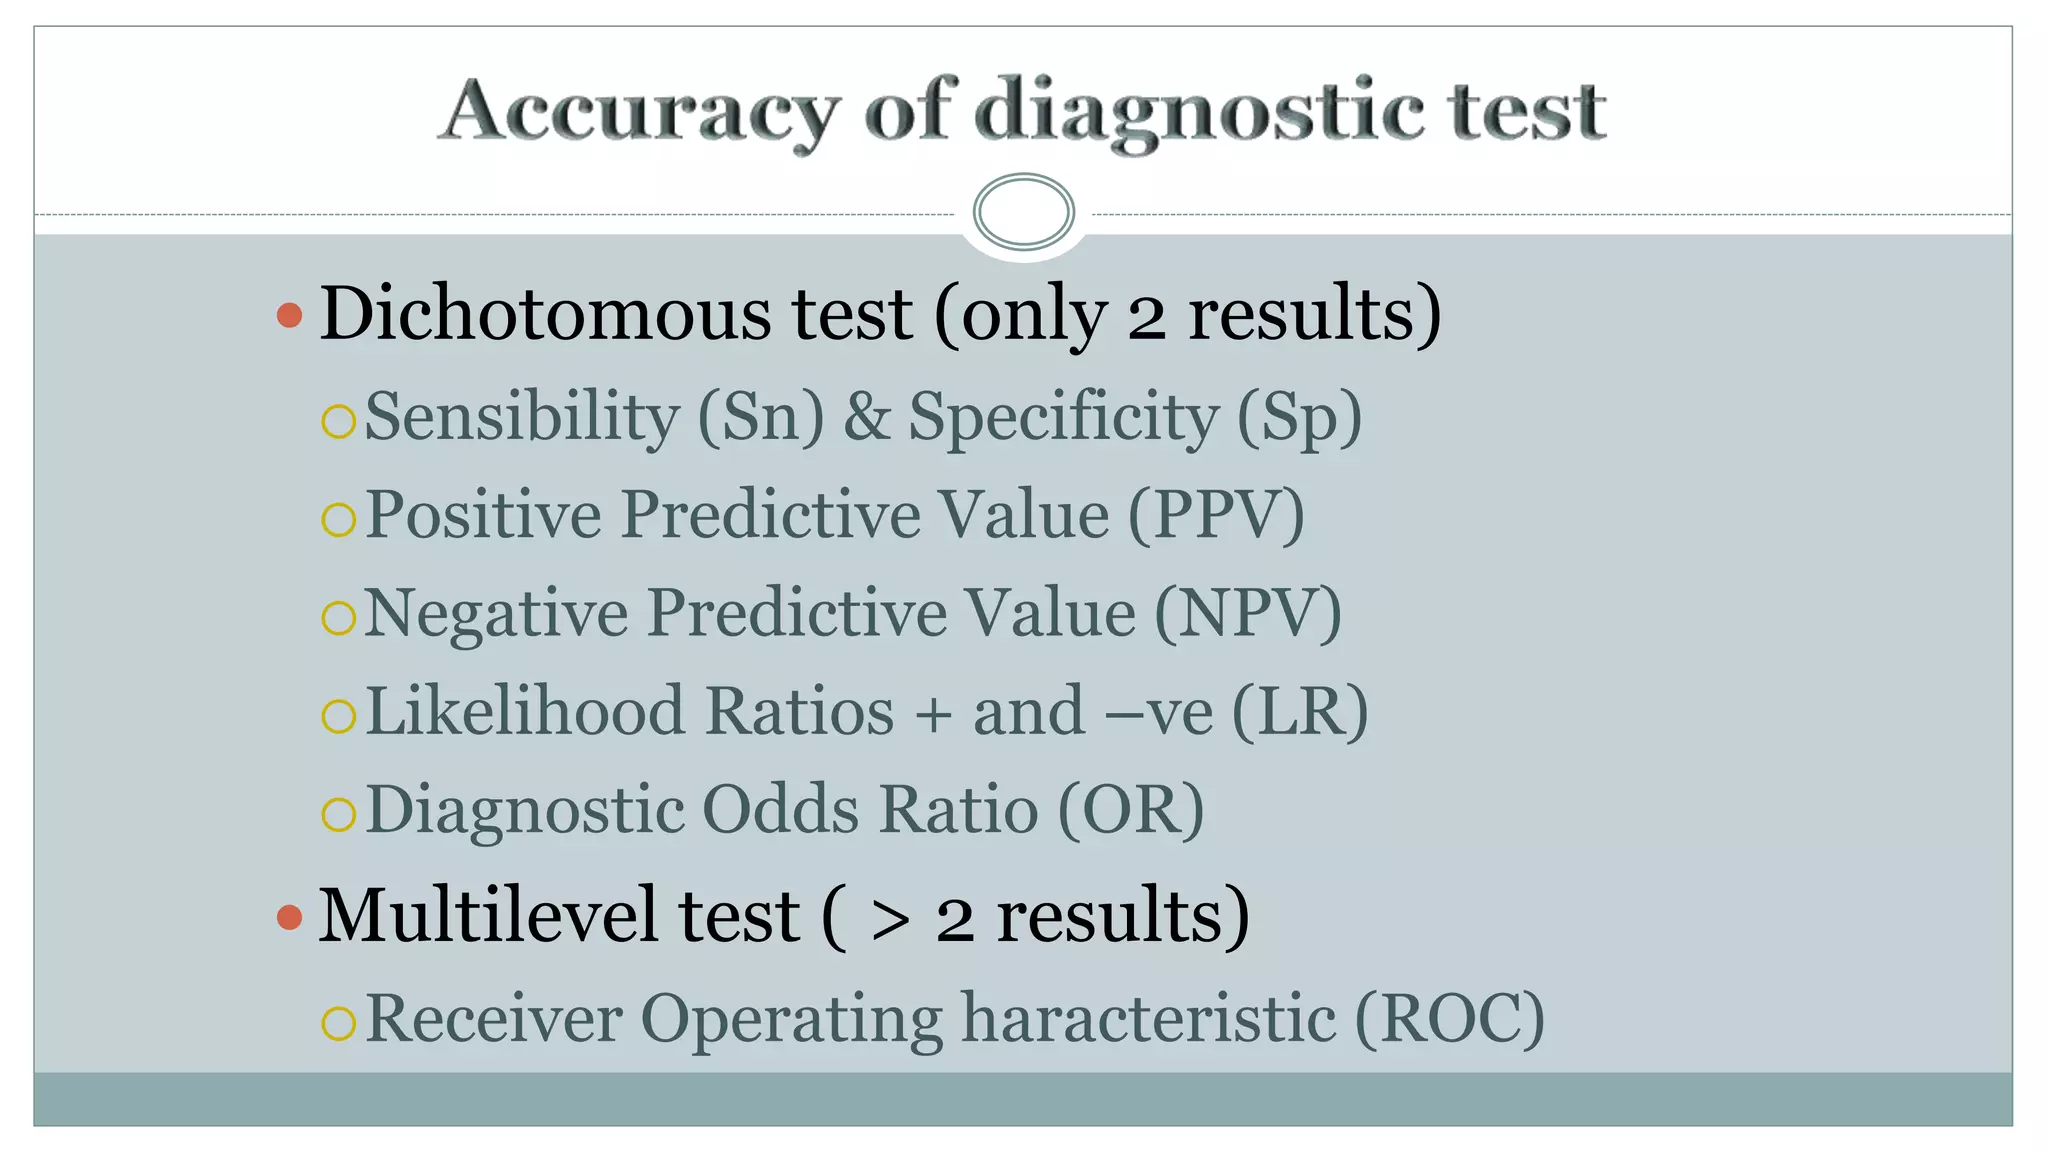
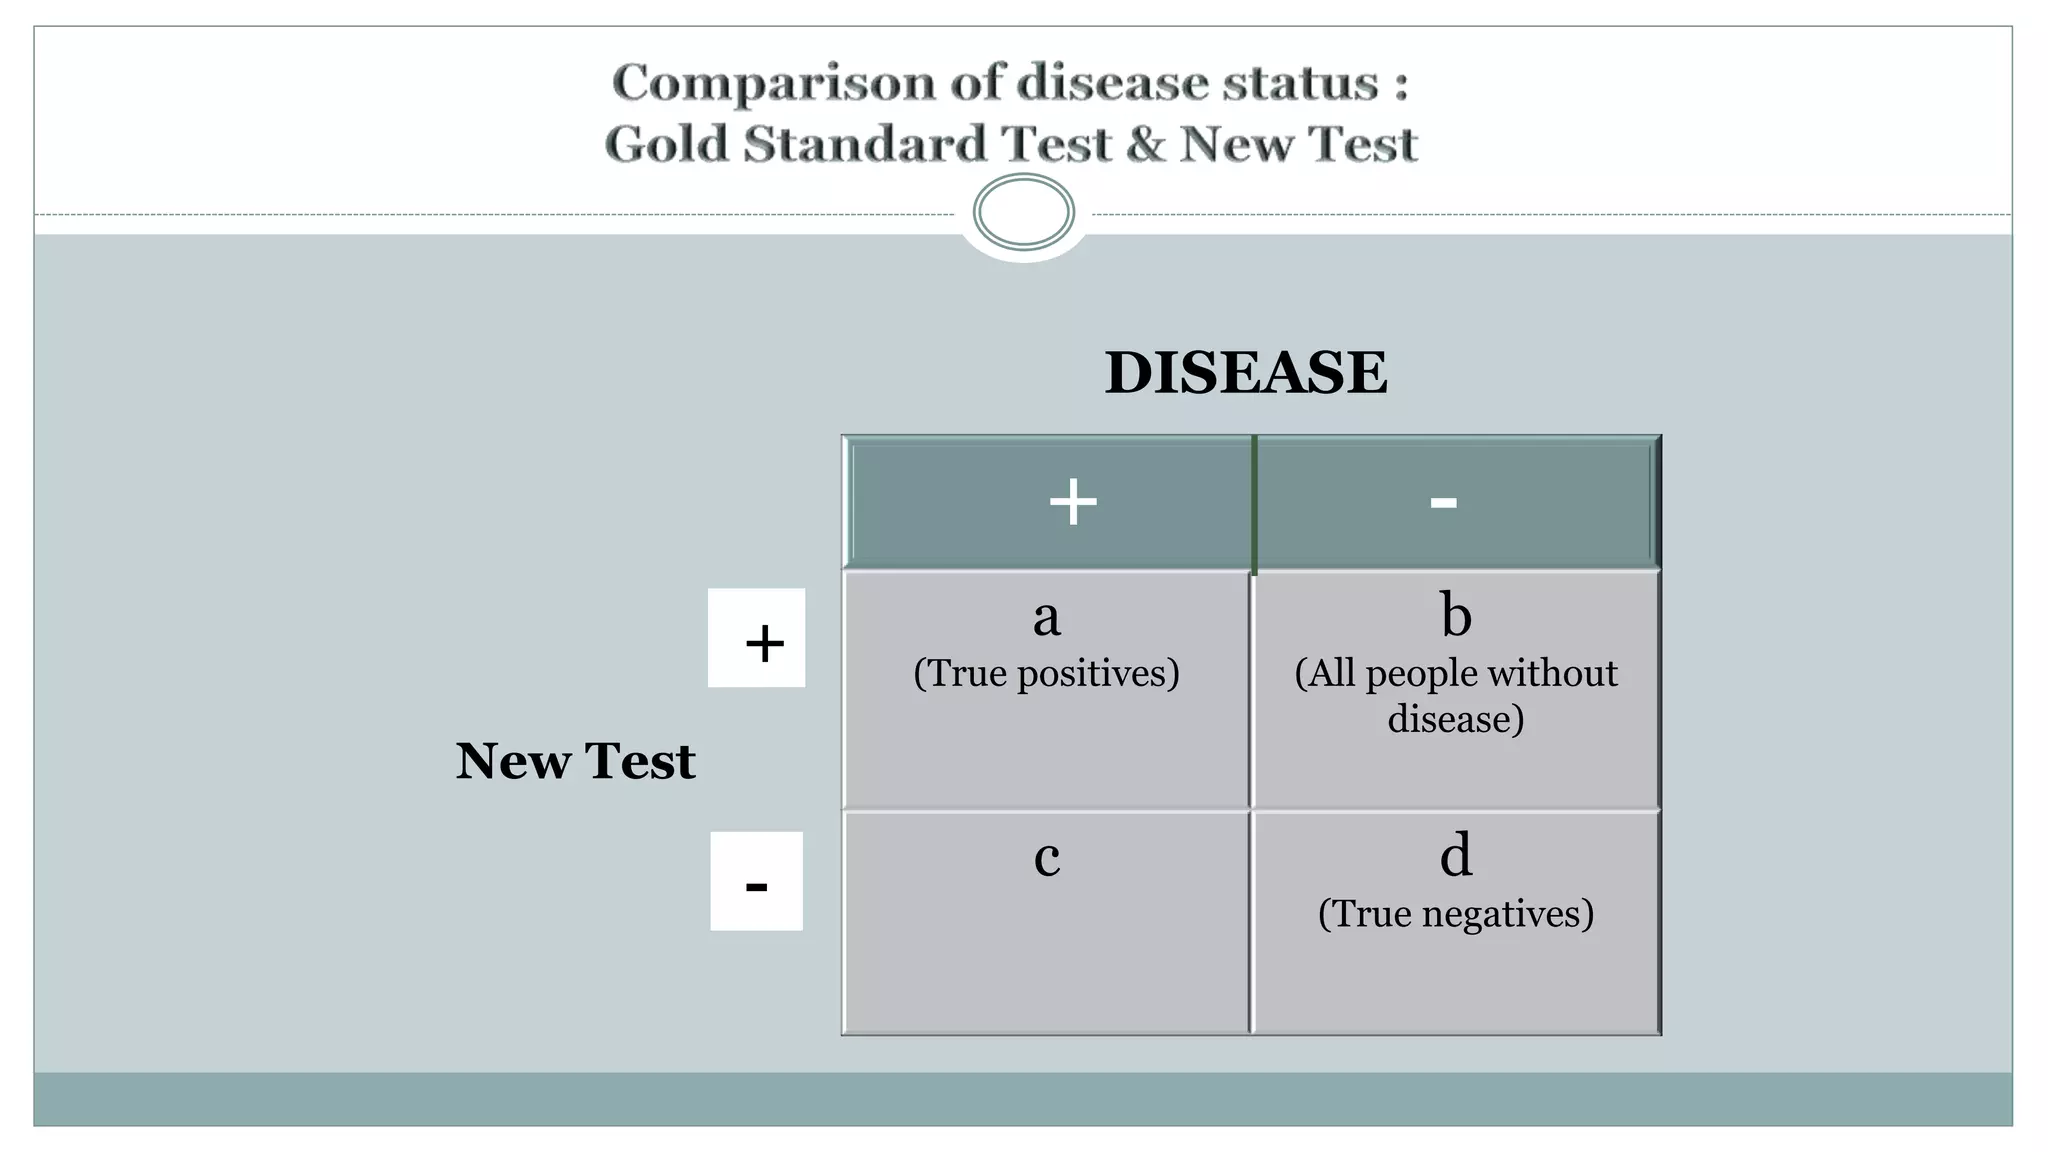
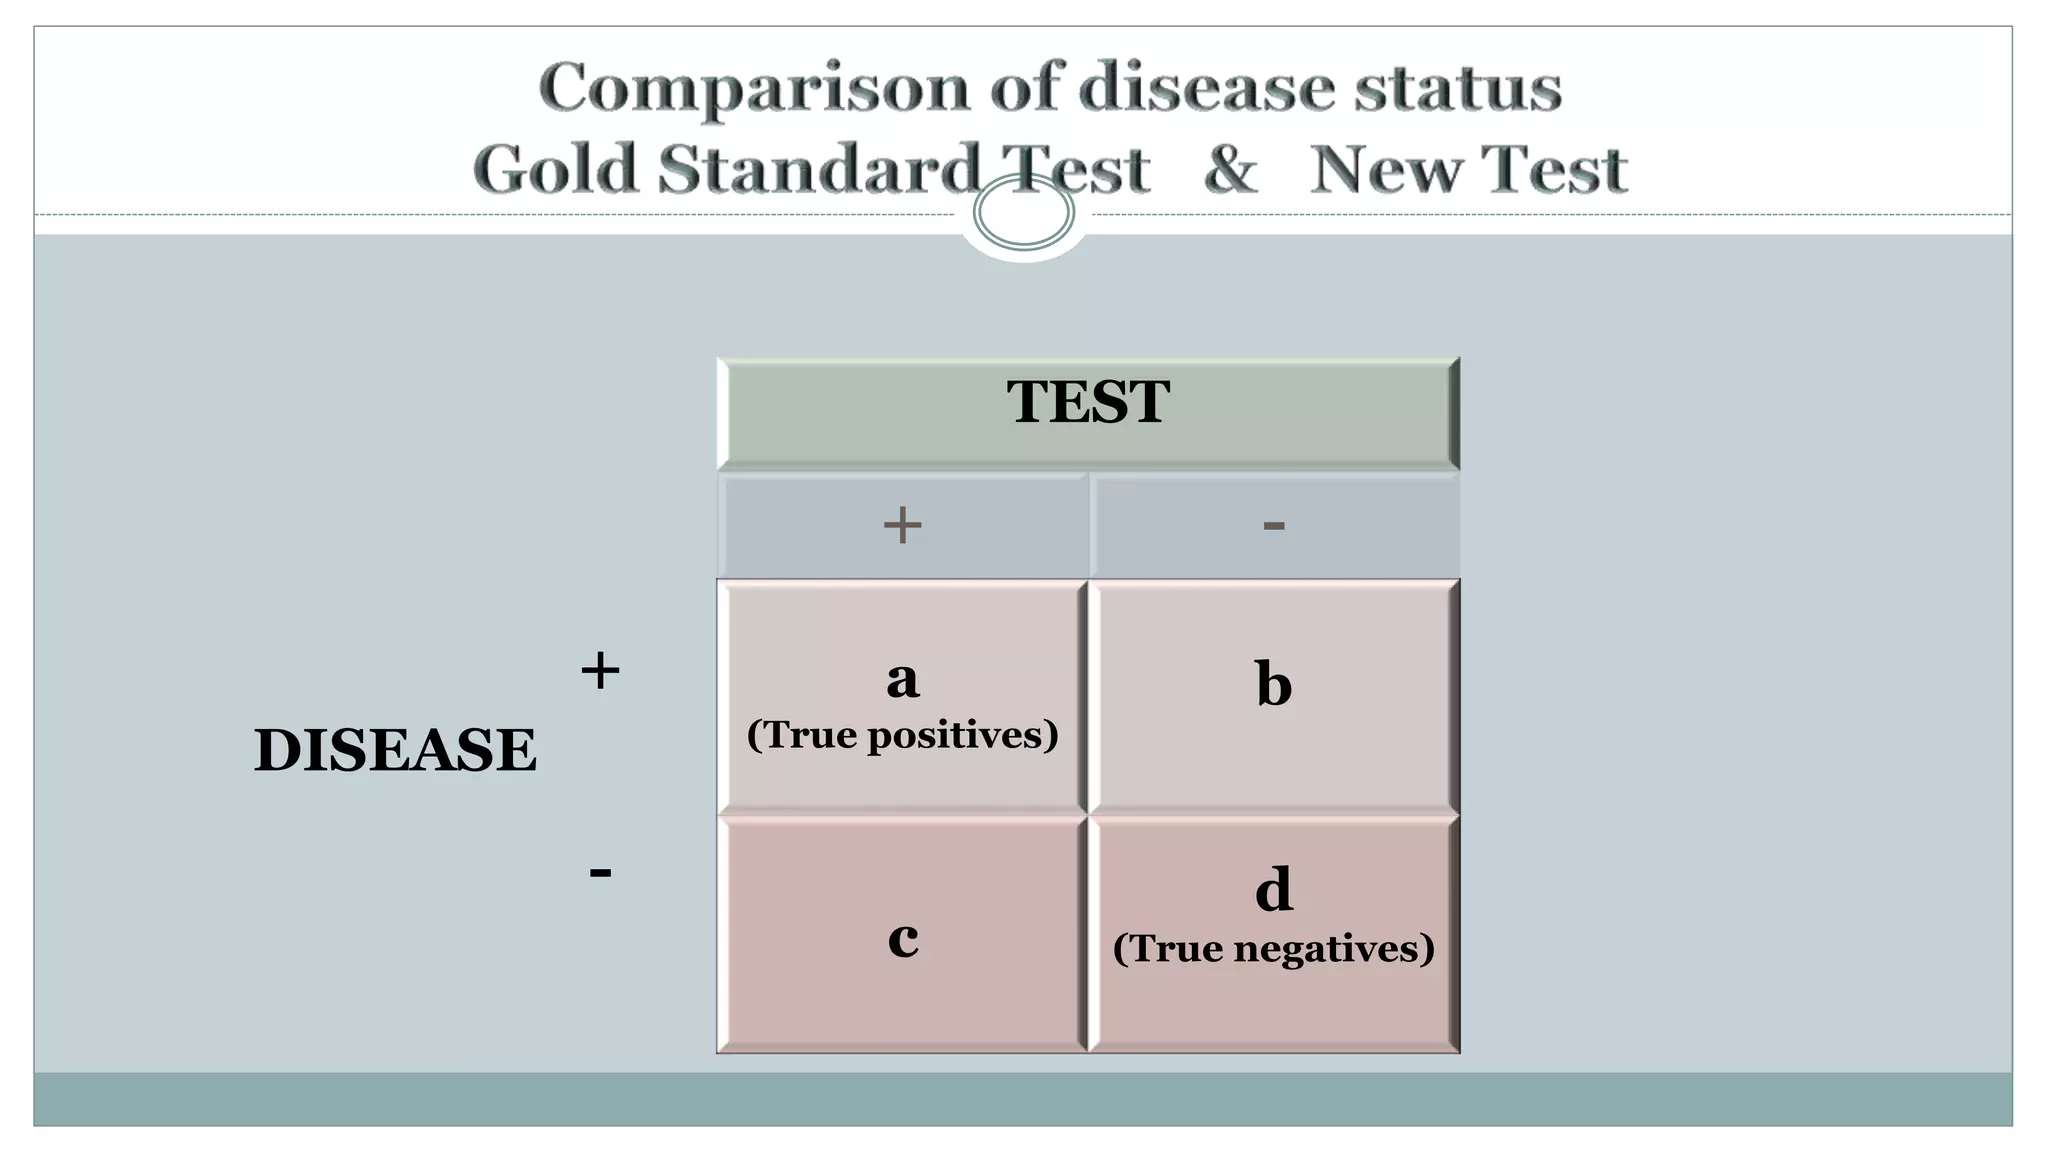
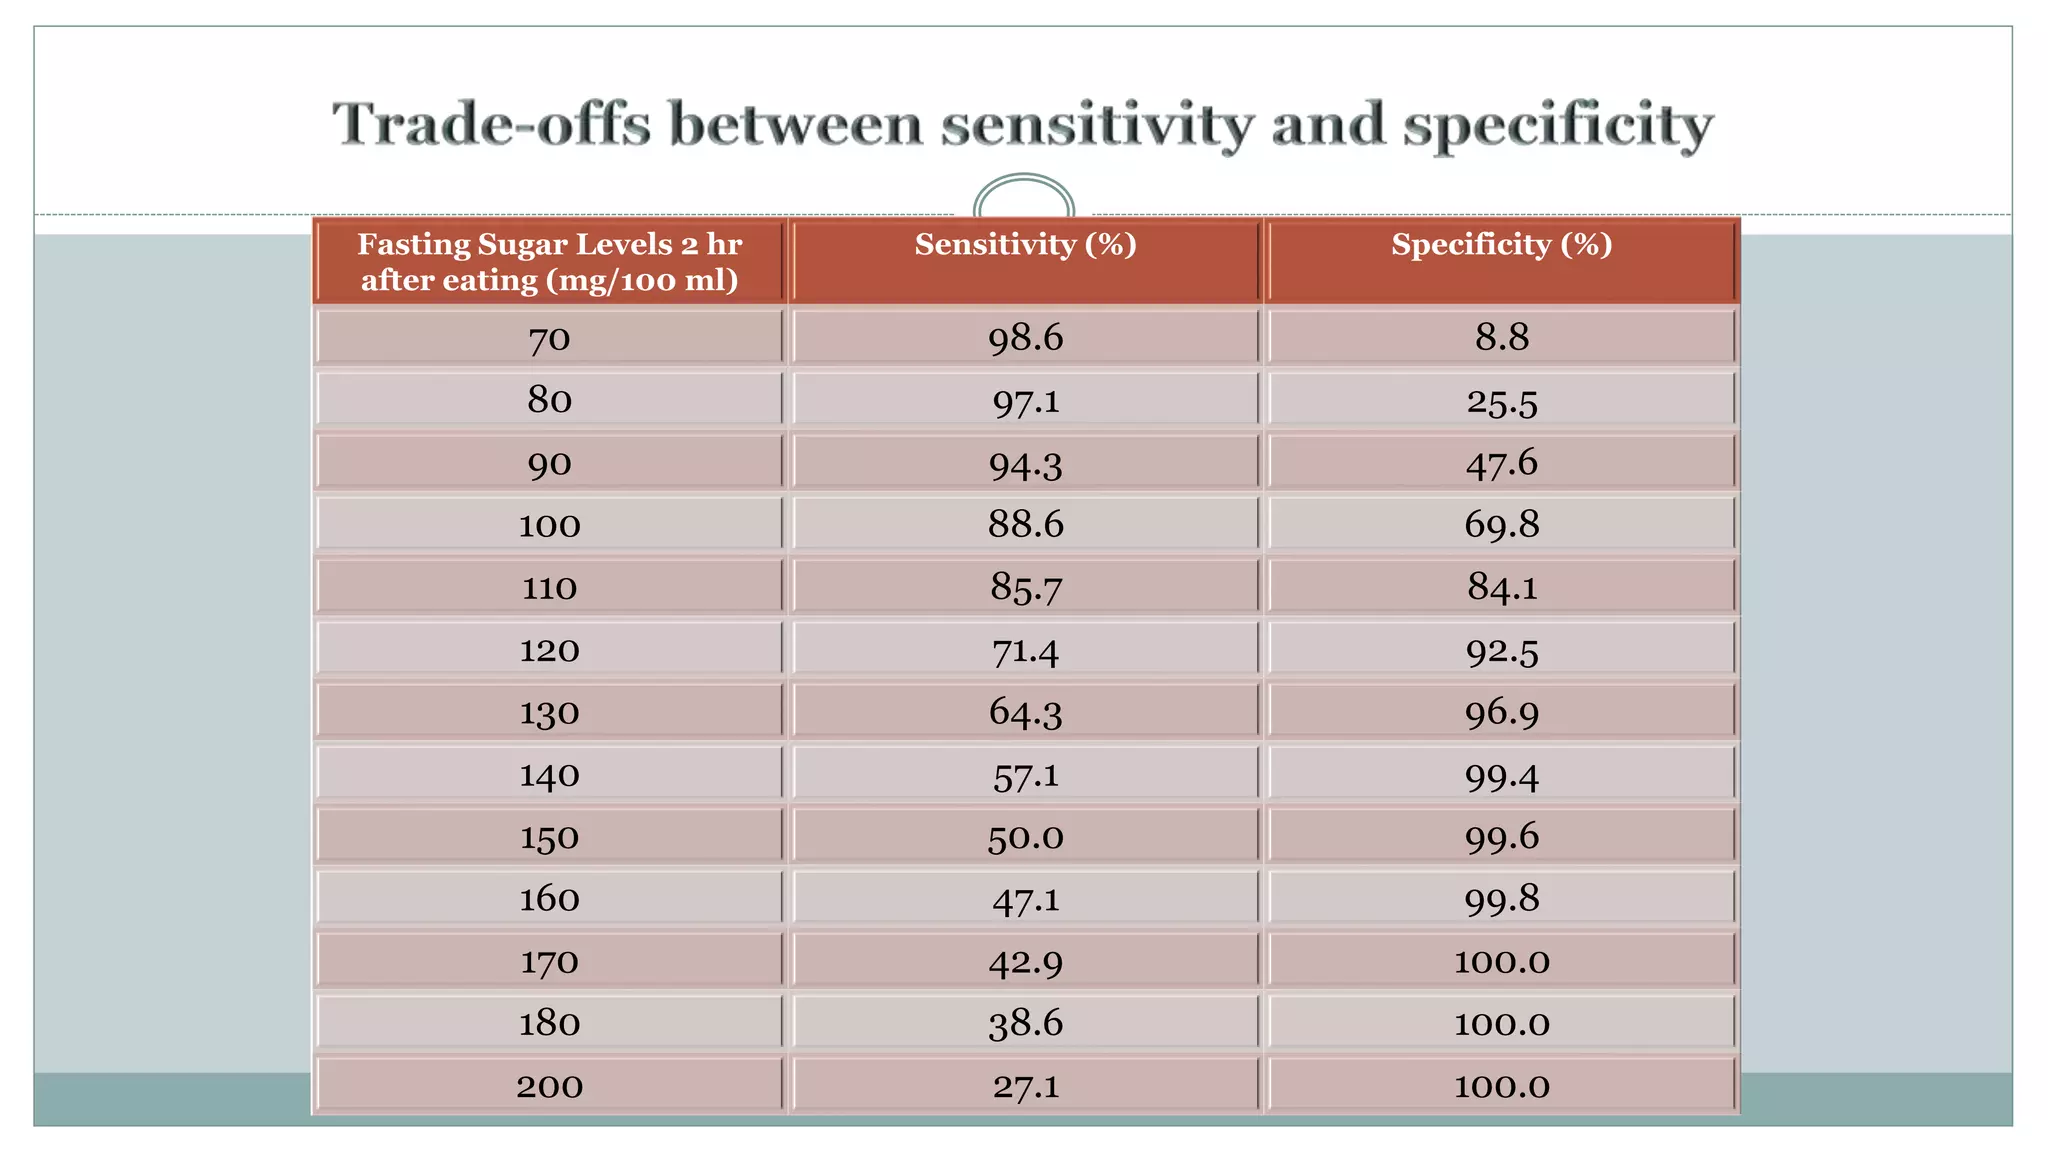
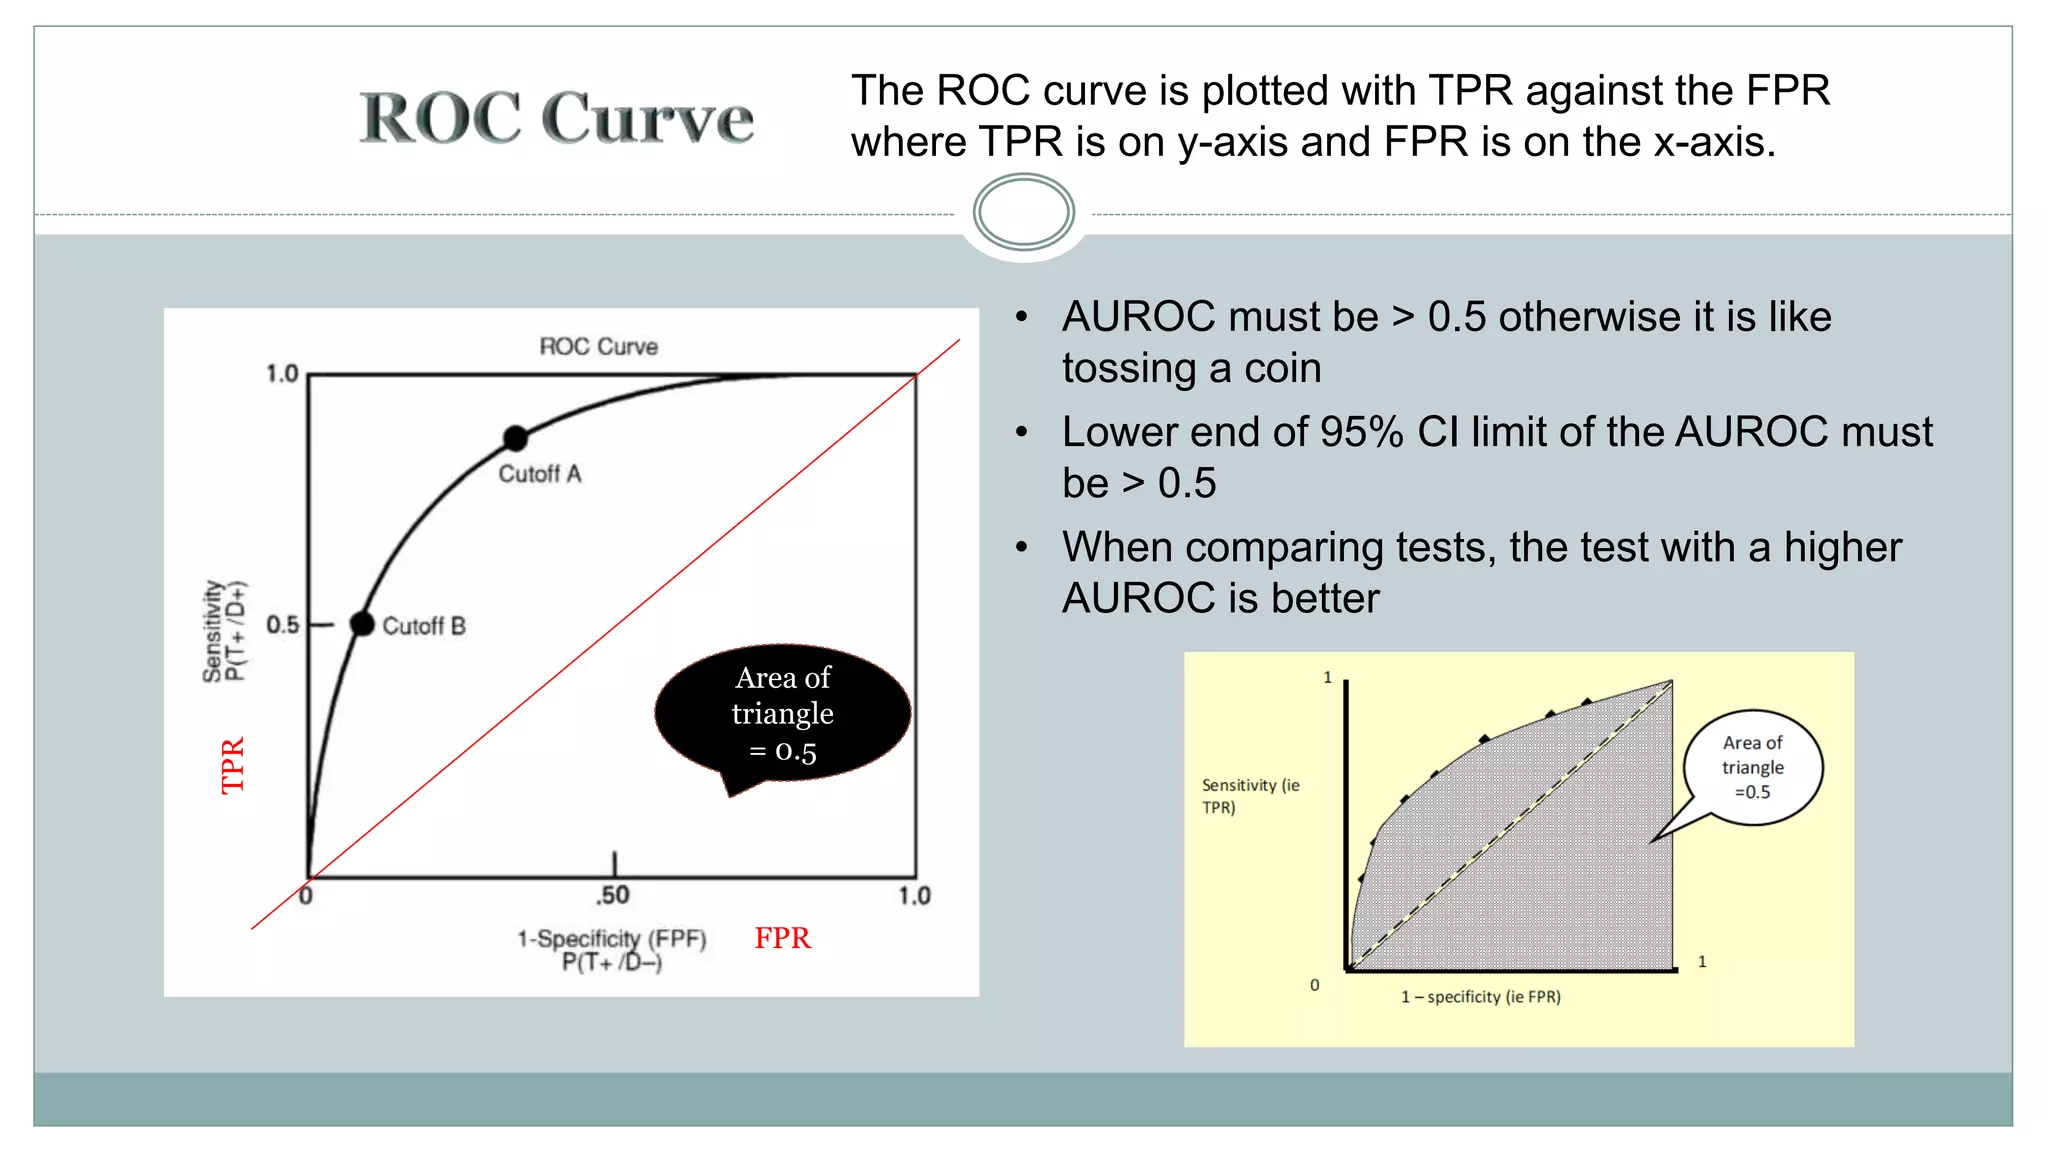
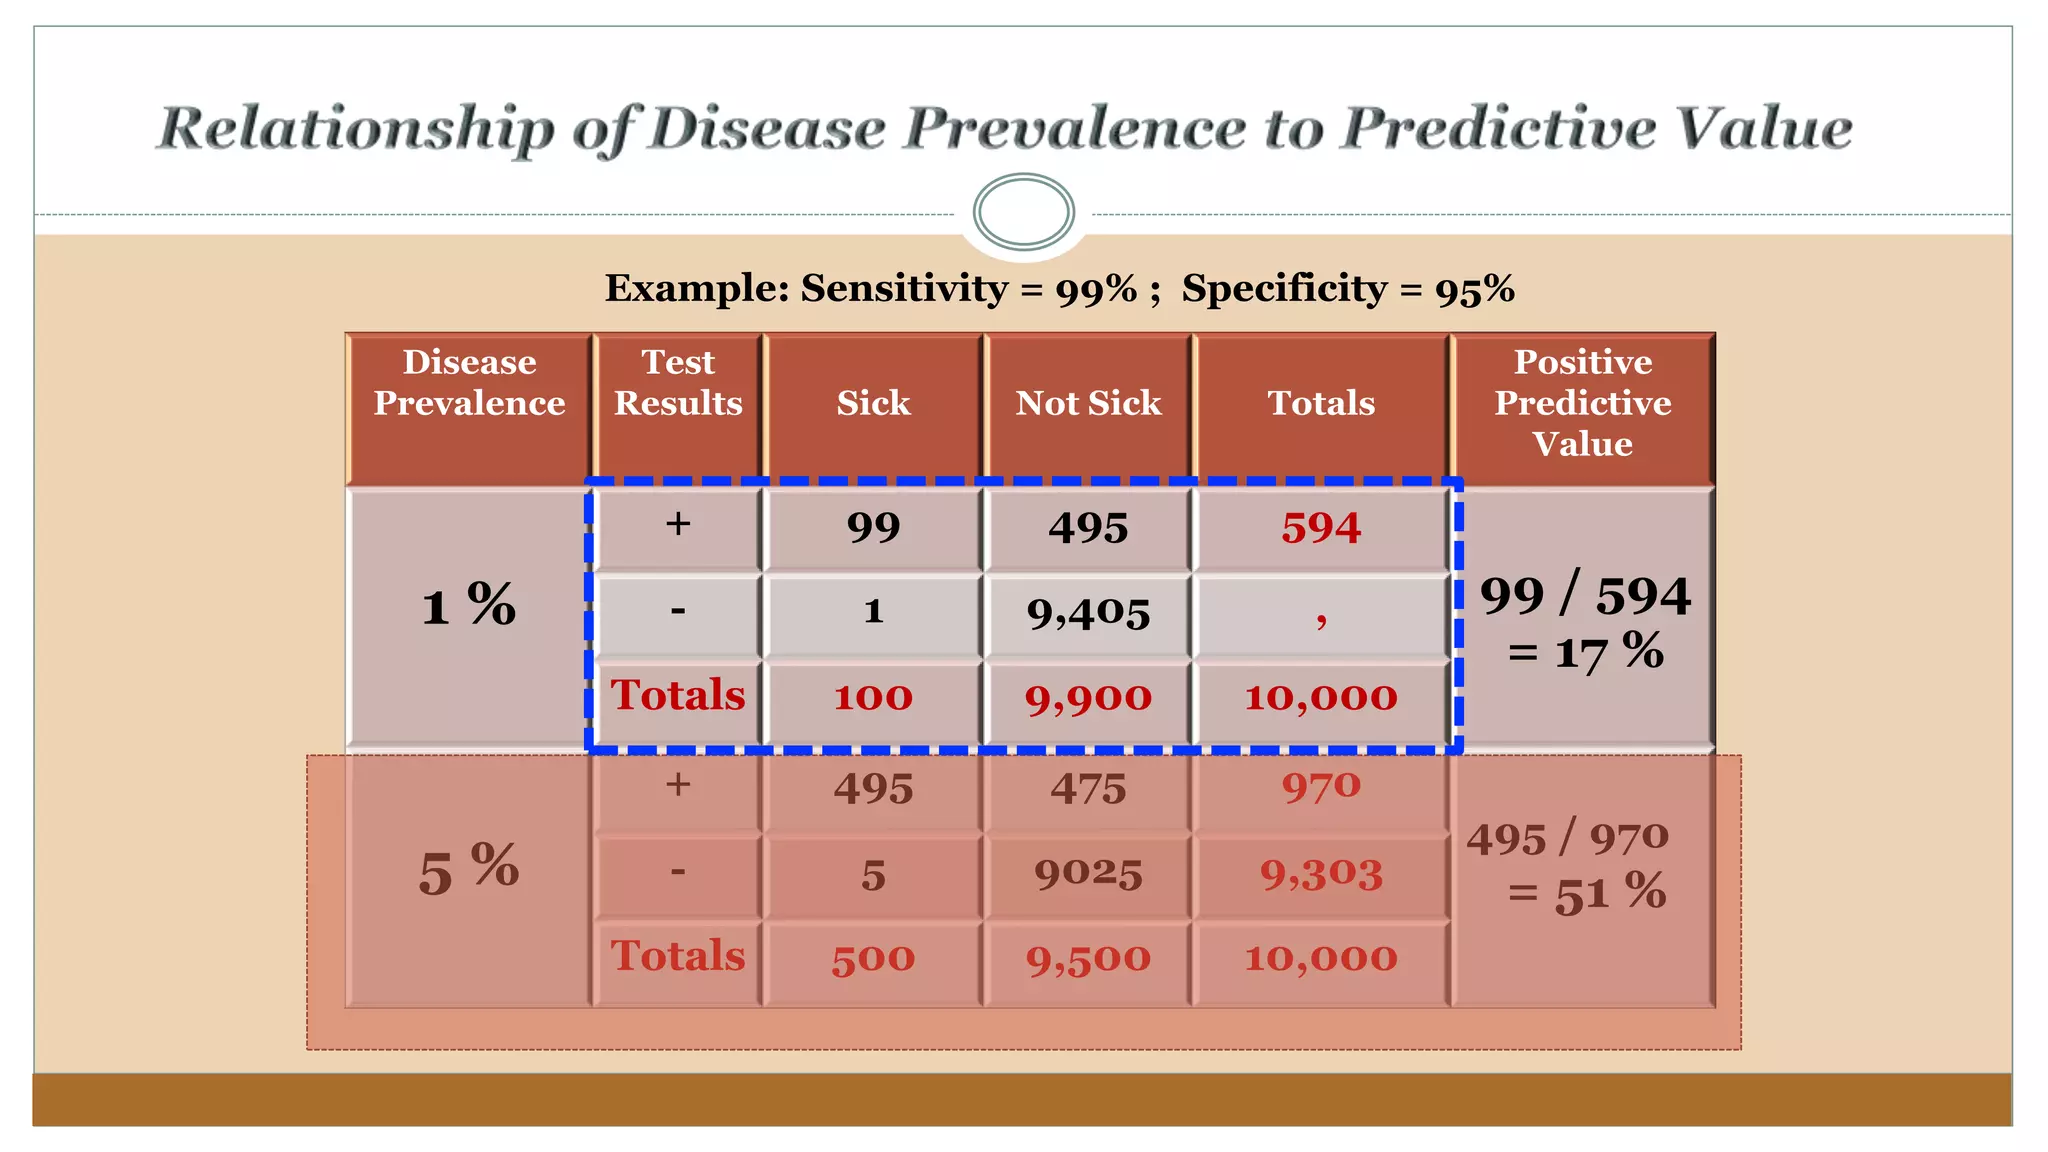
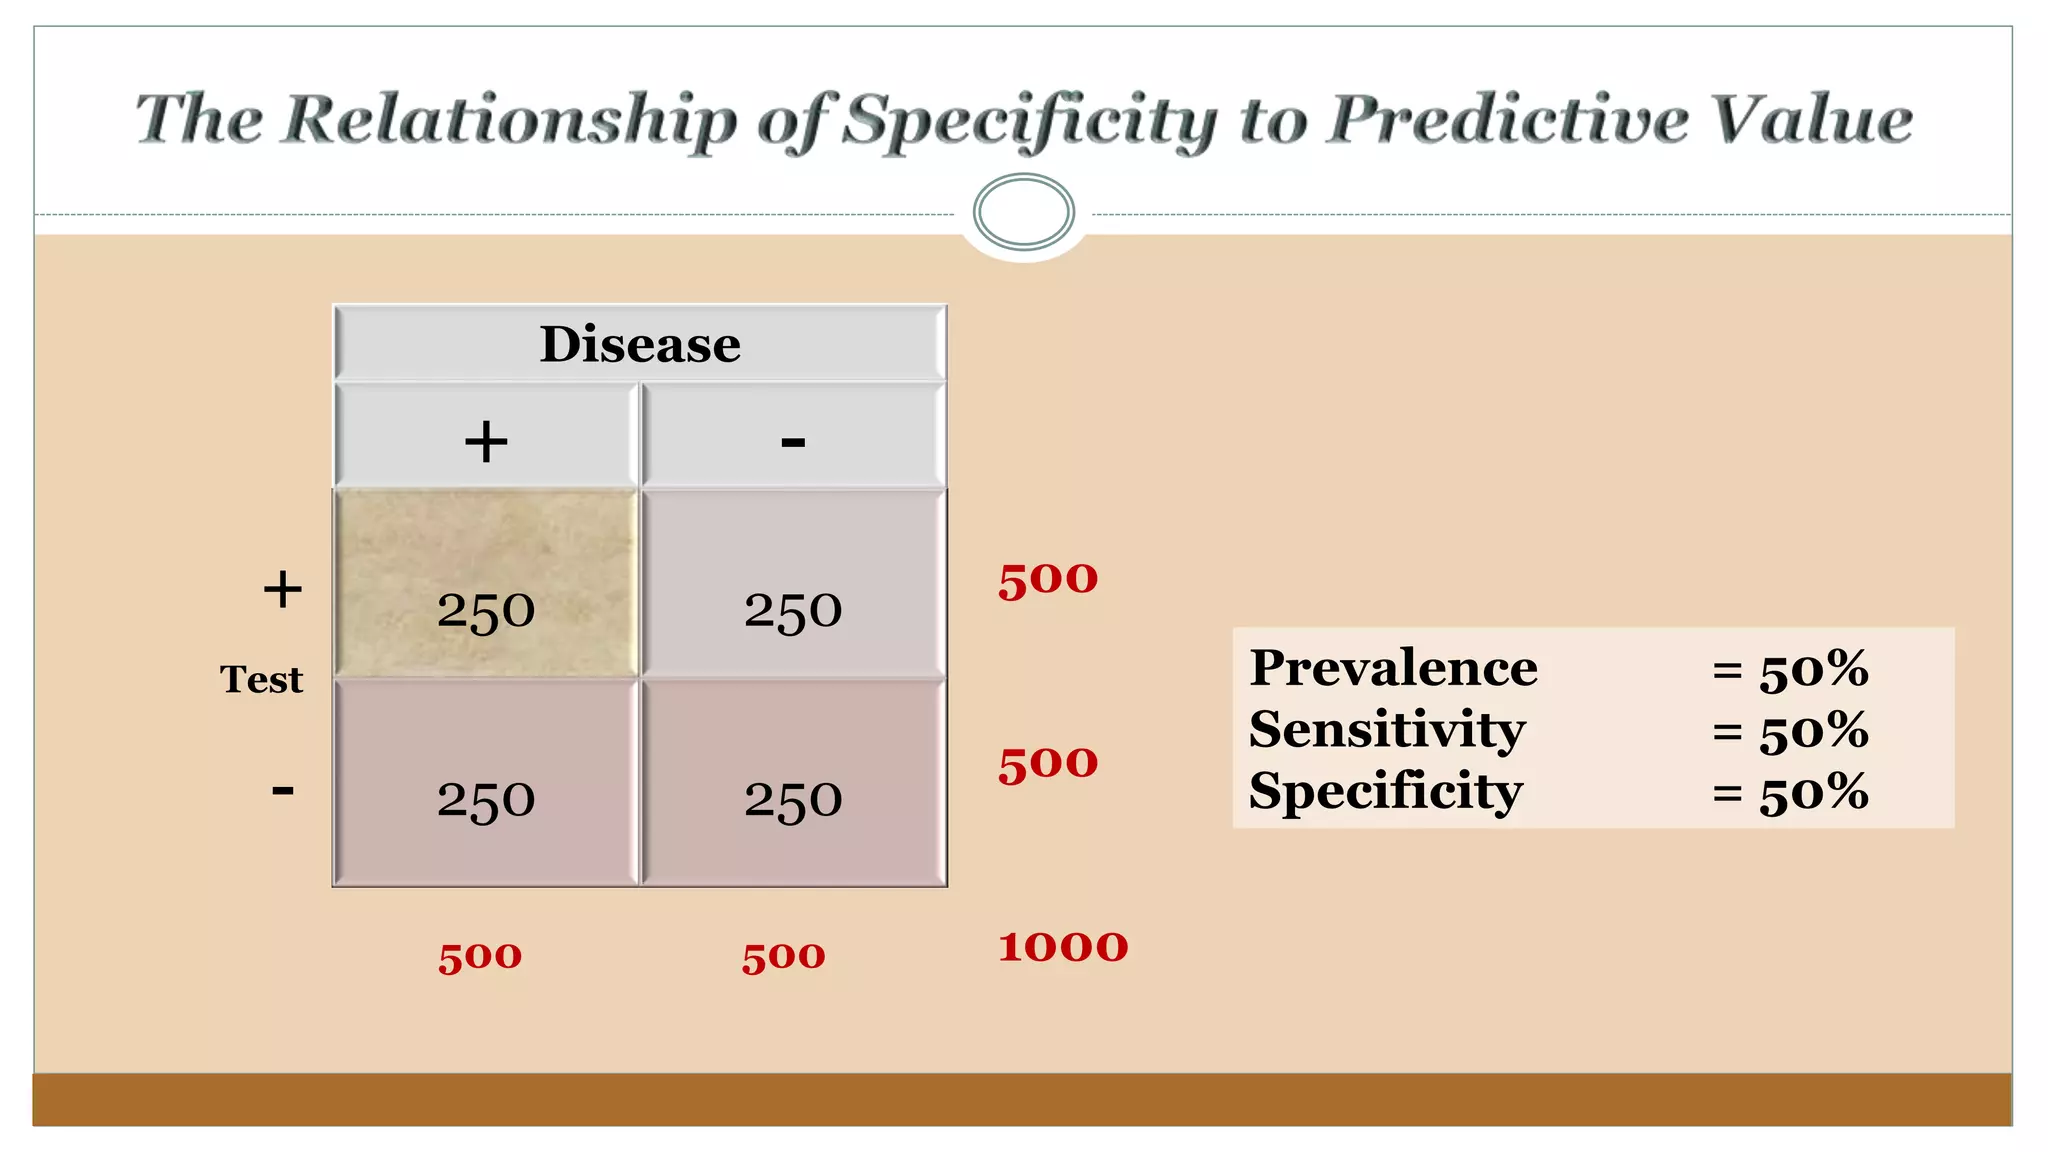
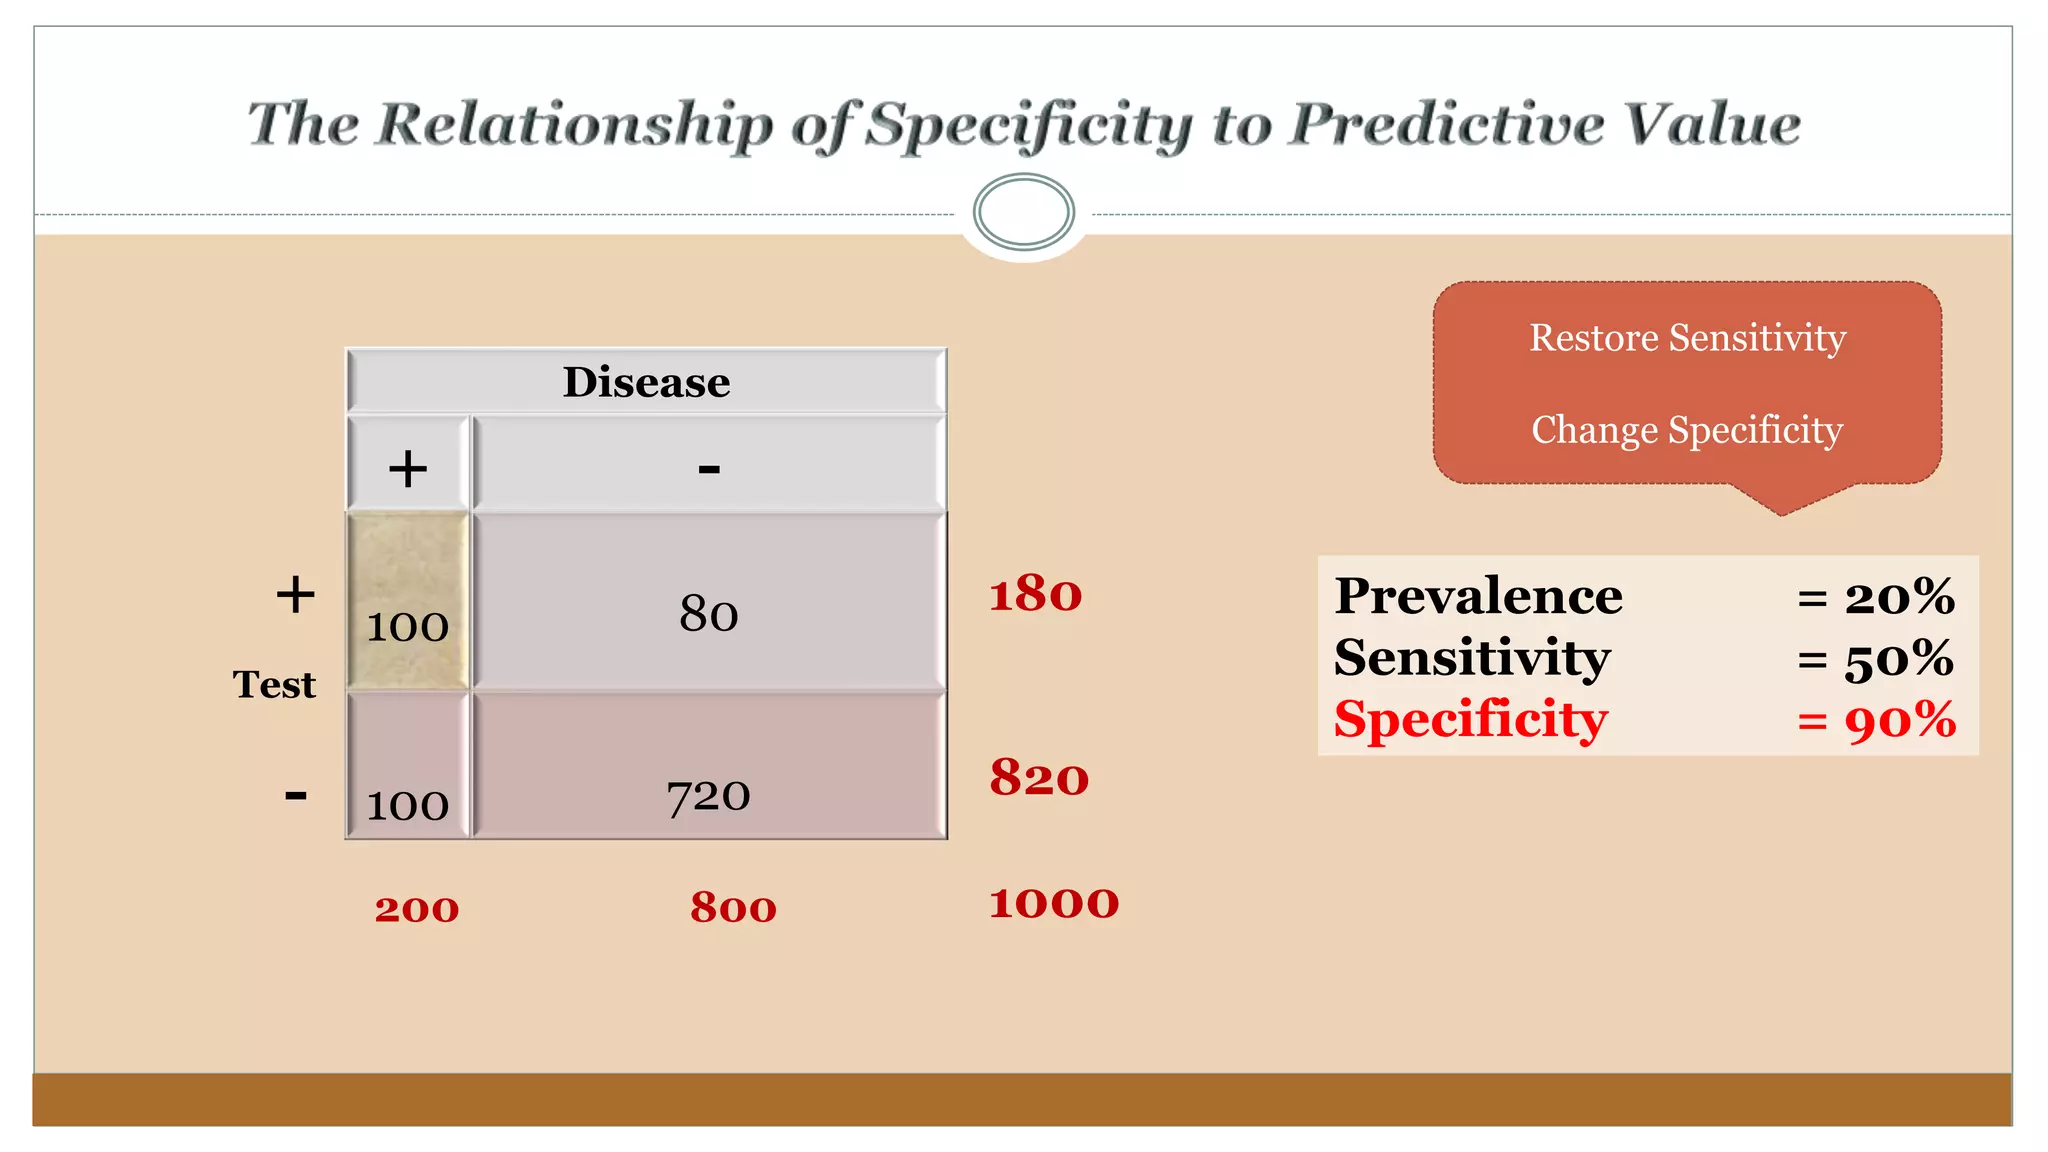
This document discusses key concepts for evaluating diagnostic tests, including sensitivity, specificity, predictive values, and likelihood ratios. Sensitivity refers to a test's ability to correctly identify individuals with the disease, while specificity refers to a test's ability to correctly identify individuals without the disease. The accuracy of a diagnostic test is determined by comparing it to a gold standard test using a 2x2 table to calculate measures like sensitivity, specificity, and predictive values. The optimal test cutoff can be selected by considering the sensitivity and specificity at different cutoff levels or by examining the overall area under the receiver operating characteristic curve.