Download as PDF, PPTX

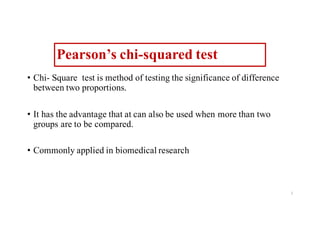


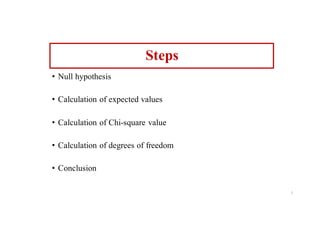


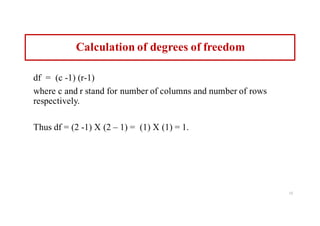


The document explains the Pearson’s chi-squared test, a statistical method used to determine the significance of differences between proportions, especially in biomedical research. It outlines the steps involved in performing the test, the calculation of expected values, the chi-squared value, and how to interpret the results, using smoking and hypertension as an example. The conclusion emphasizes the association between smoking and higher rates of hypertension, with a significant difference indicated by the chi-squared value.


